Summary:
- Amazon is still on my buy list, and only one of a handful of stocks worth buying without a dividend.
- R&D is effectively used like retained earnings with a tax write off to boot. Amazon is the MD of R&D, growing revenue year after year.
- Adjusting operating income and backing out R&D is where investors of lore have found their niche in evaluating Amazon.
HJBC
Amazon and the hidden earnings
Nick Sleep, Qais Zakaria, and Bill Miller all made fortunes betting on Amazon (NASDAQ:AMZN). They all also used one prescribed method, backing out R&D from operating income to come up with an adjusted number and creating multiples and margins based on that. In essence, the investors viewed R&D expense in some wide-moat industries as a form of retained earnings that spurn growth in revenue rather than a normal operating expense that is used to maintain existing operations. The post-tax nature of retained earnings versus the pre-tax expensing of R&D is where Amazon, Google (GOOGL), Meta (META), and Microsoft (MSFT) get their criticism of being tax evaders by Washington D.C. pundits and members of Congress.
The R&D expense has been a unique tool for growth and innovation that has put US tech far ahead of international competition. Those who understand it, utilize it, and those that don’t eat the dust of those who do. Amazon is the biggest retainer of earnings of this tech group if you consider R&D a growth vehicle rather than an expense. They spend each year on R&D right up to where they have a thin positive operating margin. The GAAP numbers always look bad because of this, but even if you don’t prescribe to this methodology of looking at Amazon, the numbers are certainly worth diving into. Amazon has been a buy for me all year. The adjusted operating margin is historically high at the moment and the tech sell-off has presented an excellent opportunity.
Revenue is growing
If we simply look at the compound annual growth rate in revenue over the trailing 5 years, we see more than a double in revenue. The CAGR in revenue over this period is 17.2%. This is an amazing feat considering Amazon is now booking over half a trillion dollars in revenue, the company is rivaling the GDP of some nations at this point. Amazon is about to overtake Sweden.
Price to sales
Price to sales is just over 2 X, the advice of James O’Shaughnessy is that 1.5X is a great deal. We’re not terribly far off here, especially when we evaluate Amazon based on its revenue growth estimates:
Seeking Alpha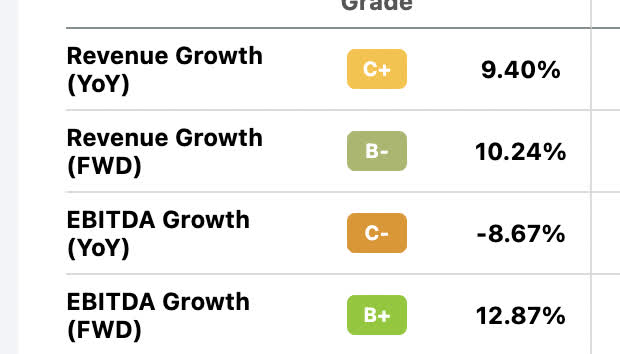
I’ll take a price-to-sales ratio a bit over 2X and growth at 10% over the beaten-down company only expected to grow revenue at 5% but trading at 1.5 X sales, any day of the week.
Adjusted operating income
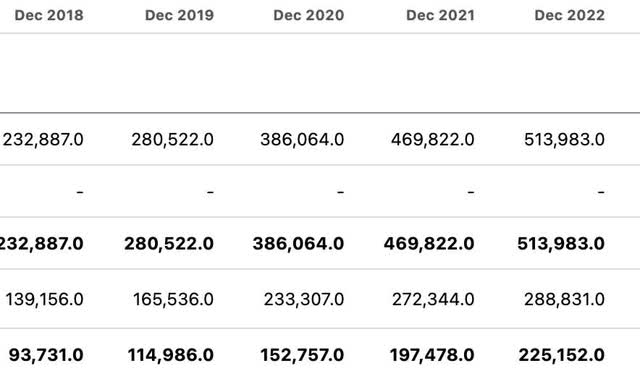
With a market cap of a tad over a trillion and adjusted operating income of USD 85.461 Billion, Amazon is trading for only 11.75 X adjusted operating income. With $513 Billion in revenue and taking into consideration the adjusted operating income, that’s an operating margin of over 16% when backing out R&D.
Looking at the CAGR in adjusted operating income from 2018 on the left to 2022 on the right, we start with $41.258 Billion in 2018 and the terminal value is $85.461 Billion on the right for 2022. This is a CAGR of 15.68%, nearly matching the revenue growth. The close CAGR association with revenue and adjusted operating income growth shows that Amazon is doing an excellent job of controlling costs and growing the top line with R&D. They spend on R&D right up to the max point to where they operate on a razor-thin operating margin and leave little left over for Uncle Sam to tax. This in turn compounds my revenue at a faster clip going forward. Eventually when Amazon determines revenue has been scaled to the max, R&D may be rescinded to show a much higher GAAP income.
The mindset of desiring value based GAAP versus Non-GAAP metrics when there is obvious revenue growth, is like wanting to have a higher AGI on your tax returns via W2 income versus higher cash flow and write offs on a nice portfolio of passive income rental properties. I know which one I personally prefer.
If we look at a PEG ratio comparing the growth rate in adjusted operating income to the adjusted operating income multiple we get 11.75/15.68, or a PEG ratio of .749. With 10.242 Billion shares outstanding and $85.461 Billion in adjusted operating income, we get $8.34 in adjusted operating income per share TTM. If we use 15.68 [the growth rate] as our multiple and $8.34 as our multiplicand, we get a fair value on Amazon of $130.83 per share.
The balance sheet
My favorite two items to evaluate on the balance sheet are current assets and long-term liabilities. At the advice of Peter Lynch, an increase in total current assets combined with a decrease in total liabilities are the two most important balance sheet factors to evaluate.
current assets (seeking alpha)
Total current assets have fluctuated quite a bit, but are up nicely over 5 years from $75 Billion in 2018 to $146 Billion in 2022, a CAGR of 14.25% per year.
total liabilities (seeking alpha)
The total liabilities section is the only item that keeps me from slapping a strong buy on Amazon as the growth rate in LT debt has increased at about the same rate as current assets. In previous articles, I have pointed out that Amazon has undergone a large undertaking in data and logistic center buildouts during the low-rate environment. They may have overbuilt, as evidenced by some of their recent layoffs, but the big shoes they’ve built should be easy to grow into over time. I would expect a slowdown in acquiring debt in forward years from here going forward. They seem to have plenty of PP&E for the time being.
Catalysts
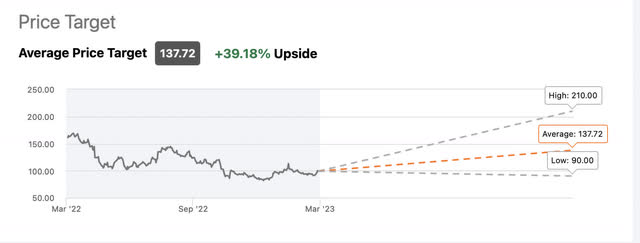
Looking at Wall Streets’ price targets, the adjusted operating income PEG ratio fair value fits right into the middle of this projection as well at $130. $210 is a bit too optimistic in my opinion, assuming a tech bull run that is long-lasting. $90 is too low and would be a strong buy in my portfolio, possibly being my only stock to buy while it hovers around $90.
From Amazon’s recent fourth quarter 2022 results:
Fourth Quarter 2022
- Net sales increased 9% to $149.2 billion in the fourth quarter, compared with $137.4 billion in fourth quarter 2021. Excluding the $5.0 billion unfavorable impact from year-over-year changes in foreign exchange rates throughout the quarter, net sales increased 12% compared with fourth quarter 2021.
- North America segment sales increased 13% year-over-year to $93.4 billion, or increased 14% excluding changes in foreign exchange rates.
- International segment sales decreased 8% year-over-year to $34.5 billion, or increased 5% excluding changes in foreign exchange rates.
- AWS segment sales increased 20% year-over-year to $21.4 billion.
We can see that Amazon continues to increase sales domestically and internationally plus a nice 20% yoy increase in AWS sales. With more companies like Snowflake (SNOW), that operate their cloud-based businesses but still rely on the massive Amazon AWS data center warehouse to operate, this segment should continue to grow. In essence, Amazon has so much data center capacity that they can grow the business by having others spend on R&D and cloud development and then just profit off of their success. The debt acquired during the Covid era to build out the PP&E profile looks to be paying off.
Risks
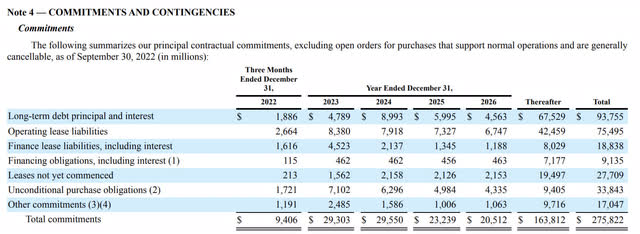
The balance sheet. That has been my one worry about Amazon versus the fortress balance sheets of my other tech favorites like Meta, Google, and Microsoft. Looking at the debt and lease commitments and maturity schedule, Amazon’s 10-Q indicates that the majority occur post-2026, leaving plenty of room for debt pay-down before maturity with the kind of revenue Amazon generates. The biggest risk for any company right now with ascending rates is its debt and maturity profile. Amazon still seems to be in a good position here but is still a risk nonetheless if the cost of capital stays high for a long period that lapses beyond 2026.
Summary
While Amazon remains under $130, I’ll continue to buy and periodically reevaluate via write-ups on Seeking Alpha. The sell-off in tech due to the long versus short duration argument and rate hikes have been a great opportunity. I’ve stated time and again that the anti-bubble thesis credited to Nick Sleep and Qais Zakaria is something that we should all seek to attain in our portfolio allocation.
Easier said than done because it is more of a psychological game than a fundamental one, but rotating into beaten-down blue chips belonging to out-of-favor sectors is a great strategy for the long part of your portfolio. I was all in oil during Covid, and now I’m mostly in blue chip tech for the time being with new capital. These are all stocks I hope to hold into eternity and a great entry point to do so. If there was ever a doctorate in R&D, Amazon has an MD.
Analyst’s Disclosure: I/we have a beneficial long position in the shares of AMZN, GOOGL, META either through stock ownership, options, or other derivatives. I wrote this article myself, and it expresses my own opinions. I am not receiving compensation for it (other than from Seeking Alpha). I have no business relationship with any company whose stock is mentioned in this article.
Seeking Alpha’s Disclosure: Past performance is no guarantee of future results. No recommendation or advice is being given as to whether any investment is suitable for a particular investor. Any views or opinions expressed above may not reflect those of Seeking Alpha as a whole. Seeking Alpha is not a licensed securities dealer, broker or US investment adviser or investment bank. Our analysts are third party authors that include both professional investors and individual investors who may not be licensed or certified by any institute or regulatory body.

