Summary:
- Amazon’s stock has rallied to new highs, driven by robust AWS growth and attractive valuation metrics, but wait for pullbacks before buying into year-end 2024.
- Amazon’s Q3 earnings beat expectations with EPS of $1.43 and revenue of $158.9 billion, though cloud segment growth still lags behind Alphabet and Microsoft.
- Amazon’s forward price-earnings ratio is high at 39.49x, but its forward price-sales ratio of 3.326x makes it the cheapest in the MAG-7 group.
- I maintain a “buy” rating, awaiting deeper pullbacks before adding to my position, with a pivot point support level at $180.25 as a key indicator.
Robert Way
When I last covered Amazon.com, Inc. (NASDAQ:AMZN) on October 15th, 2024, with my article “Amazon Targets New All-Time Highs“, the stock was in the process of consolidating in a sideways manner following a drop to extreme near-term lows at $151.61 (which printed during the August 5th trading session). In the article, I posited the thesis that prior declines appeared to be unsustainable due to the fact that revenue growth within Amazon’s cloud segment remained robust and certain forward valuation metrics were holding at highly attractive levels in relation to other cloud services providers. Since the article was written, we have received major news updates on the earnings front, and the stock has, in fact, rallied to new record highs. However, now that my article thesis has played out (almost exactly as expected), I will be reducing my outlook to a “buy” rating now that I have closed portions of my prior long positions (to collect gains) and I believe that further upside from here might be more limited into the end of 2024.
Amazon: Quarterly Earnings Figures (Amazon: Quarterly Earnings Presentation)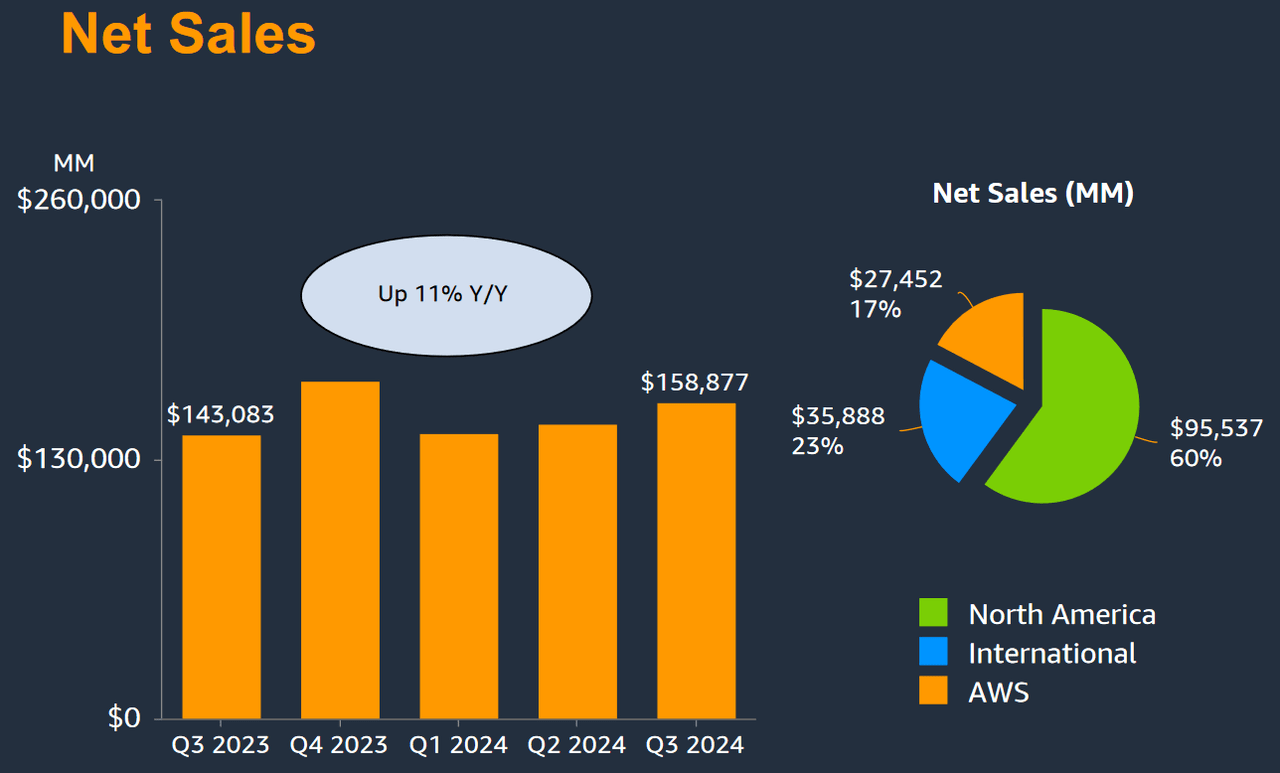
For the third quarter period, Amazon generated per-share earnings of $1.43 and this surpassed consensus estimates by a wide margin of 25.44%. On the revenue side, quarterly results were not quite as impressive, with the company beating consensus estimates by just 1.07% (at $158.9 billion). Similar performances were seen in Amazon’s revenue from advertising and web services (AWS) segments (which were both roughly in line with expectations) at $14.3 billion and $27.4 billion, respectively. Fortunately, AWS growth rates have started to move at a more rapid pace (showing annualized gains of 19%) and this marks a somewhat stark reversal from the period of deceleration that was encountered during large portions of 2023. However, it must also be noted that Amazon’s cloud segment is currently showing clear evidence of weaker expansion when compared to competing products and services from mega-cap technology rivals Alphabet, Inc. (GOOG) (GOOGL) and Microsoft Corporation (MSFT). During the same quarterly period, Alphabet saw nearly 35% growth rates in its cloud services segment, while Microsoft lagged a bit behind (with cloud services growth rates of 33% for the period).
Amazon: Quarterly Earnings Figures (Amazon: Quarterly Earnings Presentation)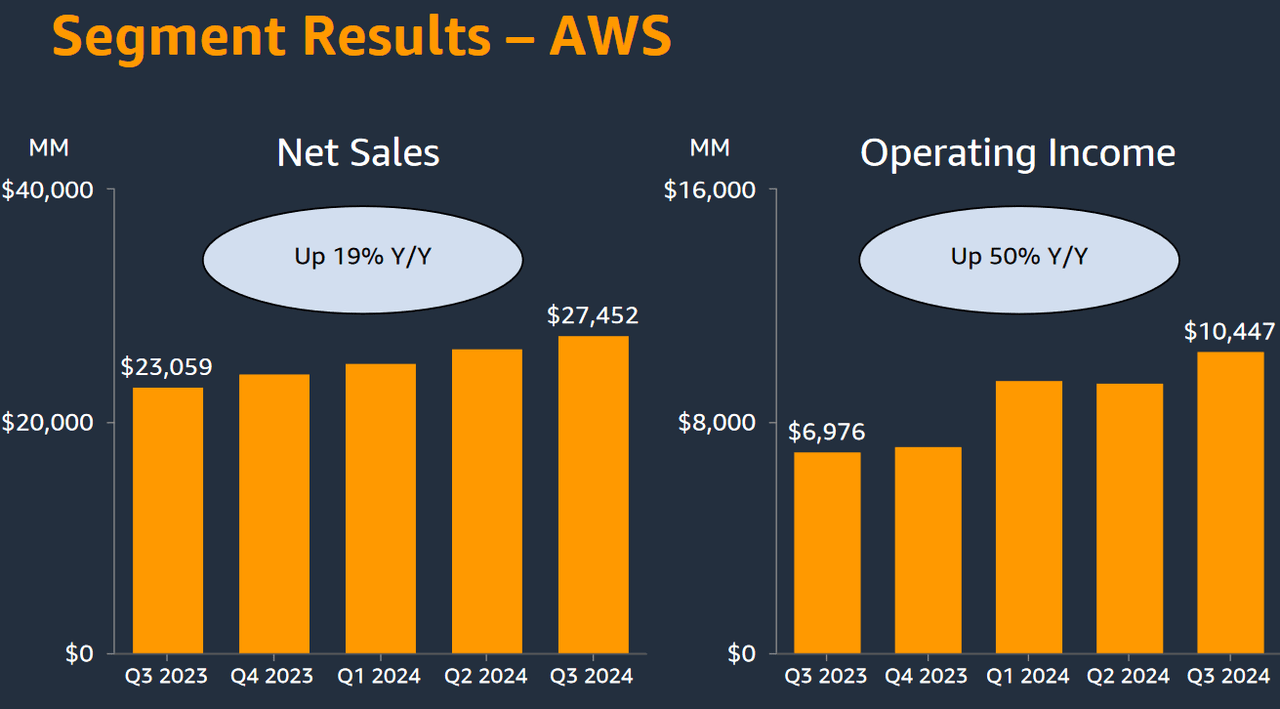
Given these differences in the vital cloud services segment, I think it is important to assess the comparative valuation metrics that are currently seen within the MAG-7 peer group. When looking at the forward price-earnings metrics for this peer group, there are only two stocks trading at levels that are more expensive than Amazon (at 39.49x). Specifically, these examples would be Nvidia Corporation (NVDA) at 49.1x and Tesla, Inc. (TSLA), which is currently trading with an astronomical forward earnings valuation of 136.68x. Unfortunately, this means that the majority of this cohort is trading at cheaper valuations, as Microsoft is trading with a forward price-earnings ratio of 31.75x and Apple, Inc. (AAPL) is trading with a ratio of 30.84x. Currently, much cheaper options can be found with Meta Platforms, Inc. (META) at 24.51x and Alphabet (at just 21.99x).
Amazon: Comparative Forward Price to Earnings Valuations (YCharts)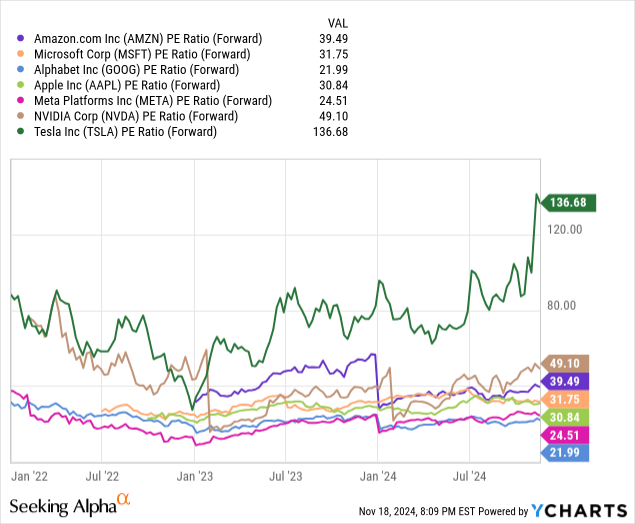
Data by YCharts
Amazon’s forward price-earnings ratio has seen fairly significant improvements in 2024, while prior revenue figures have shown a bit more evidence of weakness on a comparative basis. If we look at the relative forward price-sales metrics for this peer group, Amazon is actually trading at an incredibly low valuation of just 3.326x (making AMZN the cheapest stock in the entire group). By comparison, the next cheapest stocks in the cohort would be Alphabet (at 6.182x), followed by Apple and Meta Platforms (which are trading with roughly similar valuations) at 8.315x and 8.597x, respectively. Tesla (at 10.88x) and Microsoft (at 11.09x) are also trading at roughly similar levels, but these metrics are still far below Nvidia (which currently holds a forward price-sales ratio of 27.23x).
Amazon: Comparative Forward Price to Sales Valuations (YCharts)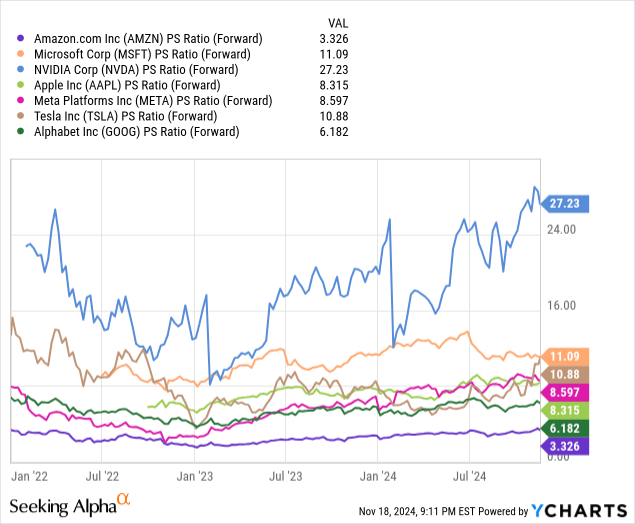
Data by YCharts
Typically, I try to assess MAG-7 stocks using at least three different valuation metrics. If we round out this perspective using the respective price-book value ratios for each stock in this group, we can see that only Alphabet (at 6.891x) is trading at a less expensive valuation relative to Amazon (at 8.186x). Meta Platforms is trading with a slightly higher price-book ratio of 8.506x and Microsoft still looks reasonable at 10.74x. From there, however, these ratios really start to skyrocket, with Tesla currently trading with a price-book valuation of 15.55x, Nvidia at 59.1x, and Apple at 60.53x. Overall, we can see that Amazon’s comparative valuation metrics still look quite favorable in relation to the rest of the MAG-7 cohort, and this suggests that potential drawdowns for long positions might be somewhat limited into the end of 2024.
Amazon: Comparative Forward Price to Book Valuations (YCharts)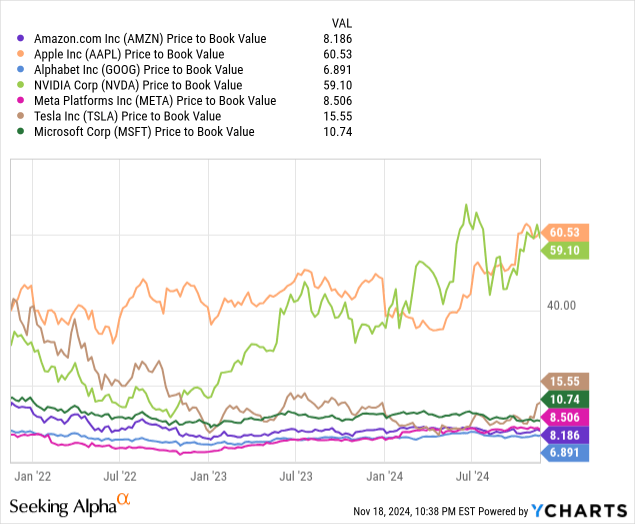
Data by YCharts
Looking into the chart history, we can see that Amazon stock has recently fallen through support zones near $201.20. Essentially, this level marks the previous all-time high (which marks a prior resistance level that would now be expected to function as support) that was printed during the July 8th, 2024 trading session, and the 23.6% Fibonacci retracement of the bull rally from the August 5th, 2024 lows (located at $151.61) to the November 14th, 2024 highs of $215.90. Now that this area has been breached to the downside, we are likely to see a re-test of the 38.2% retracement of the aforementioned upward price move. Indicator readings on the daily time frame largely support this outlook because the moving average convergence/divergence has recently developed a bearish crossover (signifying the emergence of downside price momentum) with a great deal of visible distance to cover before the stock enters into oversold territory. Ultimately, this suggests that the stock is more likely to continue moving lower before finding substantive support and reversing sustainably in the upward direction.
AMZN: Daily Support and Resistance Levels (Income Generator via TradingView)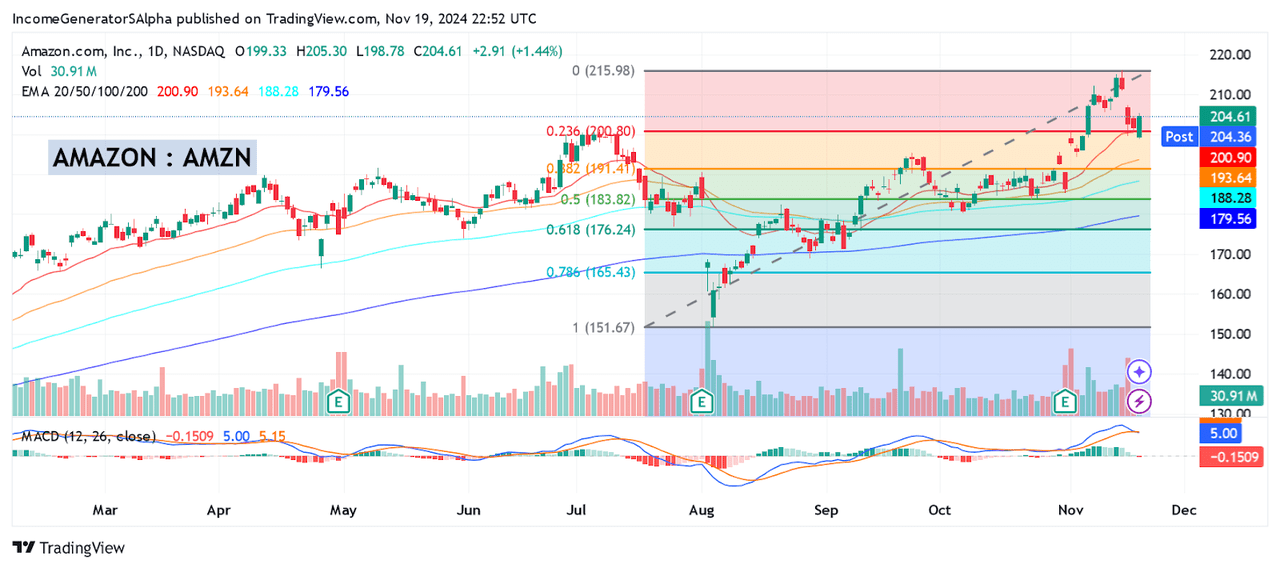
Overall, I will be waiting for a deeper pullback into these price zones before adding again to my current AMZN long position. In line with the thesis of my prior article, I closed part of my position following Amazon’s break to new all-time highs, and I will be using the same strategy to identify better entry points at lower levels. Given the company’s strong operating performances during the third-quarter period, I still believe that it is important to maintain a bullish outlook. $17.4 billion in operating income and annualized EPS growth rates of 52% make it relatively clear that Amazon is currently in a very strong position to end the year on an excellent footing. From a strategic standpoint, I would first need to see AMZN share prices break below my pivot point support level of $180.25 (which marks the historical lows from October 7th, 2024, as well as the ascending 200-day exponential moving average) in order to further revise my outlook to a “sell” rating. Barring this negative outcome, I will be maintaining my current long position and reducing my outlook (by one level) to a “buy” rating while I wait for targeted pullbacks to use as new entry points.
Analyst’s Disclosure: I/we have a beneficial long position in the shares of MSFT, NVDA, AMZN either through stock ownership, options, or other derivatives. I wrote this article myself, and it expresses my own opinions. I am not receiving compensation for it (other than from Seeking Alpha). I have no business relationship with any company whose stock is mentioned in this article.
Seeking Alpha’s Disclosure: Past performance is no guarantee of future results. No recommendation or advice is being given as to whether any investment is suitable for a particular investor. Any views or opinions expressed above may not reflect those of Seeking Alpha as a whole. Seeking Alpha is not a licensed securities dealer, broker or US investment adviser or investment bank. Our analysts are third party authors that include both professional investors and individual investors who may not be licensed or certified by any institute or regulatory body.
