Summary:
- Advanced Micro Devices, Inc. stock has surged due to expected growth in the AI industry, with revenue rising yearly since 2020.
- The company faces competition from Nvidia and Intel in the chipset space, with the potential for a price war impacting AMD.
- The growing R&D costs of AMD may be adding additional risk.
- While AMD has strong fundamentals, it’s vital to examine its real value before investing.
Javier Lizarazo Guerra/iStock via Getty Images
Advanced Micro Devices, Inc. (NASDAQ:AMD) has seen a major upswing in its stock as artificial intelligence industry growth continues to be on investors’ minds. Revenue has risen yearly since 2020, and the company has rebounded from its previous lows many years ago. AMD graphics cards and chipsets have increased competition in the industry that was thought to only feature NVIDIA Corporation (NVDA) as the dominant player. The back half of 2024 is anticipated to feature growth for AMD, as the recent supply chain issues have subsided with its product lines.
As mentioned, AMD stock has seen large increases because of expected growth in the AI industry. Research and Development costs have, however, been eating away at operational profits as AMD looks to keep up with Nvidia in the AI chipset space. AMD continues to face strong competition from Nvidia and Intel in the chipset space and attempts to position itself as the one to beat in this market. Even with its recent chipsets launched to gain market share in the AI market, Nvidia has so much margin and weight that an eventual price war could erupt that would impact AMD considerably. The second half of 2024 should see an upswing and could propel further growth in the stock, but these long-term headwinds will still weigh down the stock overall.
AMD is attempting to position itself as the competitor to Nvidia’s dominance in the space, and will likely have a large challenge to unseat this competitor. Nvidia has a first-mover advantage and maintains better financials than AMD overall. AMD will look to gain market share from Nvidia but could face pricing pressure as the dominant player has more runway to compete.
Even with the intense competition, the industry growth will likely allow both players to see growth, but perhaps not meet current expectations. I am concerned that the stock currently already has high valuations baked into the stock price, and AMD could fail to meet these lofty expectations.
While current news stories, good or bad, can sway our opinion about investing in a company, it’s good to analyze the fundamentals of the company and to see where it’s been in the past and in which direction it’s heading.
This article will focus on the long-term fundamentals of the company, which tend to give us a better picture of the company as a viable investment. I also analyze the value of the company versus the price and help you determine if AMD is currently trading at a bargain price. I provide various situations which help estimate the company’s future returns. In closing, I will tell you my opinion about whether I’m interested in taking a position in this company and why.
Snapshot of the Company
A fast way for me to get an overall understanding of the condition of the business is to use the BTMA Stock Analyzer’s company rating score. AMD shows a rating score of 73.75 out of 100. In summary, AMD has some strong fundamental financials, but its long-term EPS category score is much lower than I would expect.
Before jumping to conclusions, we’ll have to look closer into individual categories to see what’s going on.
Fundamentals
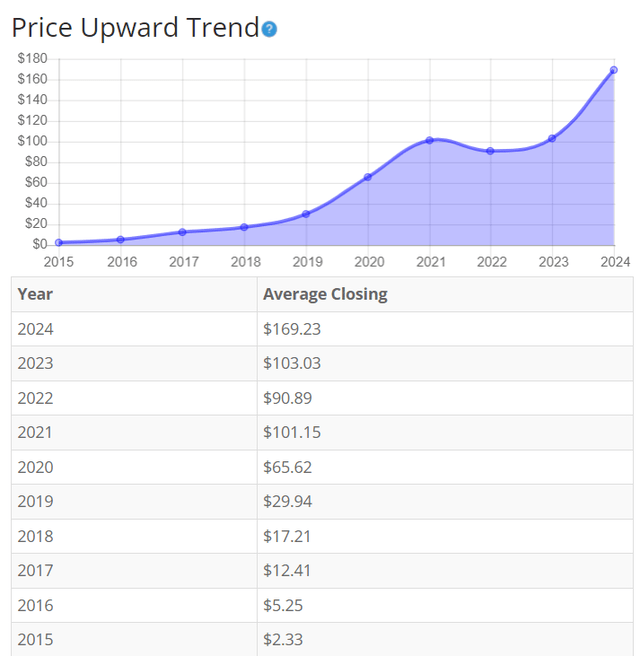
The share price has continued to rise every year over the last 9 years. The stock has continued to surge due to increased revenue and potential growth in artificial intelligence. The price likely includes lofty expectations of sales driven by continued market share gains against Nvidia and other players in the chipset market. This does bring some inherent risk to shareholders. There could be a major downtrend if AMD does not meet its large sales expectations. Overall, the share price average has grown by about 7163.09% over the past 10 years, or a Compound Annual Growth Rate of 60.98%. This is an incredible return!
Earnings
Earnings per share have steadily risen before a recent decline. AMD was thought to be a dud before beginning to build onto cost savings initiatives and outperform Intel chipsets. The main reason for the EPS decline is increased research and development expenses to create cutting-edge technology to compete with Nvidia. If AMD reaches its target of 10.5 billion GPU data center sales, EPS should begin to rise again.
BTMA Stock Analyzer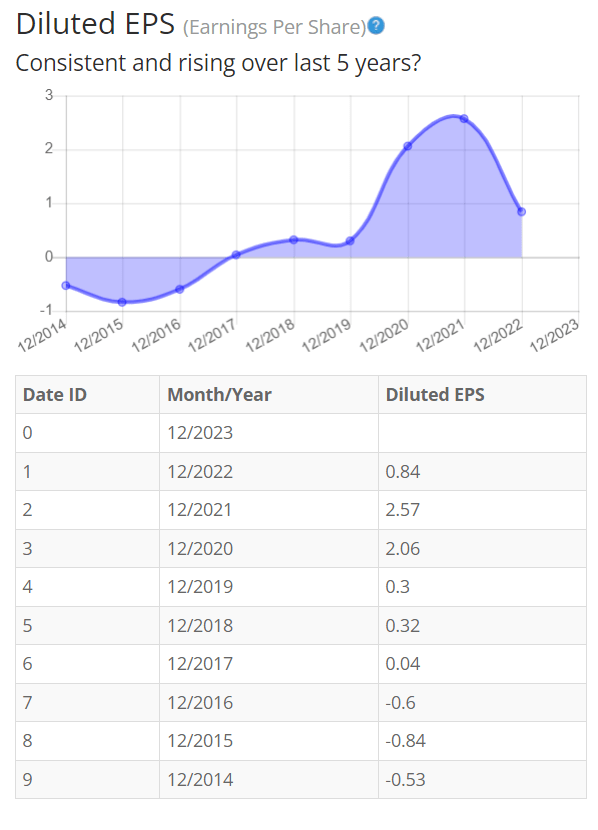
Since earnings and price per share don’t always give the whole picture, it’s good to look at other factors like gross margins, return on equity, and return on invested capital.
Return on Equity
The return on equity grew substantially before falling off in the recent year. AMD’s data center GPU solutions continue to be forecasting large growth. The return on equity drop is driven by a large rise in AMD shareholder equity, while the actual net income of the company has fallen due to increased research and development expenses without any spikes in sales. Since most expected sales gains are baked into the current stock price, I do anticipate a reversal of the declining trend in the short term. For return on equity (ROE), I look for a 5-year average of 16% or more. So, AMD exceeds this requirement, but be cautious of a continued decline in ROE.
BTMA Stock Analyzer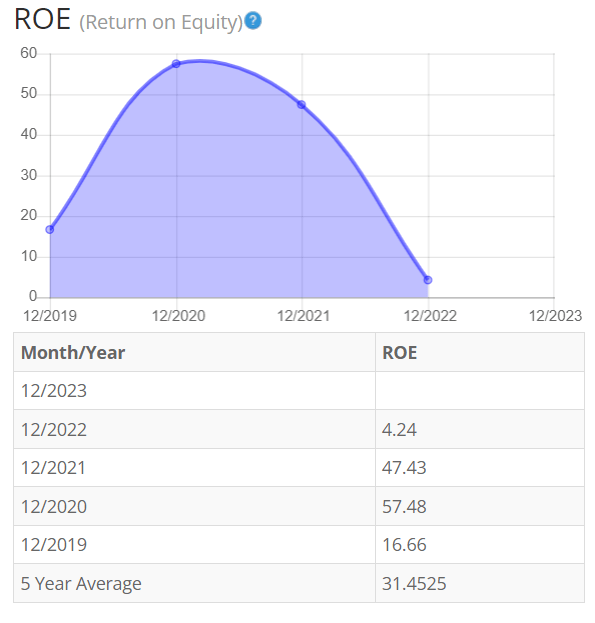
Let’s compare the ROE of this company to its industry. The average ROE of 63 Semiconductor companies is 12.61%.
Therefore, AMD’s 5-year average of 31.45% is far above its peers.
Return on Invested Capital
The return on invested capital follows a similar trend to ROE. The company has maintained a stable capital expenditure, continuing to invest in property, plant, and equipment to produce its chipsets. Since the invested capital has remained consistent, the ROIC is mainly driven by the operating profit of the company. The operating profit for the company has recently decreased due to research and development costs and short-term gross margin reductions as a percentage of revenue. I expect ROIC to increase after the back half of 2024, due to expected sales growth. For return on invested capital (ROIC), I also look for a 5-year average of 16% or more. So, AMD also exceeds this requirement, and investors should keep an eye on the continued declining ROIC.
BTMA Stock Analyzer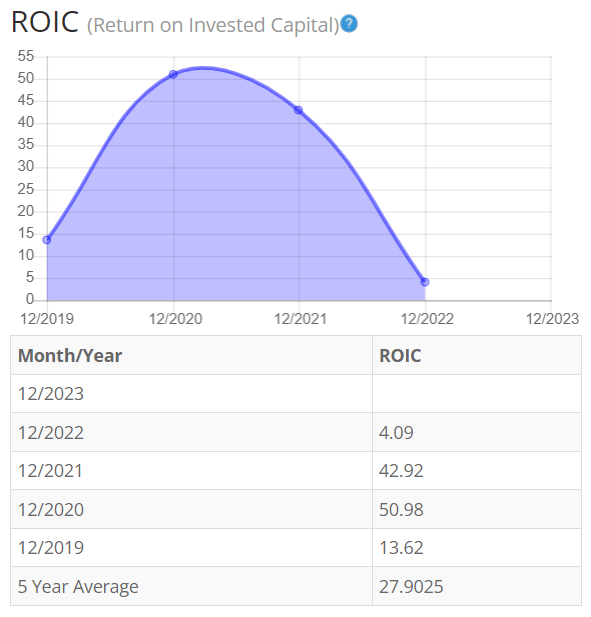
Gross Margin Percent
The gross margin percentage (GMP) has remained stable over much of the last 5 years, outside the recent year driving down the margin. Semiconductor manufacturing businesses tend to maintain high utilization to keep costs low. The gaming business has recently experienced sluggish sales numbers that impact manufacturing utilization. I expect a rebound in gross margin percentage in the next year as manufacturing utilization rebounds when sales and data center GPU growth kicks in.
I typically look for companies with gross margin percent consistently above 30%. So, AMD is above this criterion.
BTMA Stock Analyzer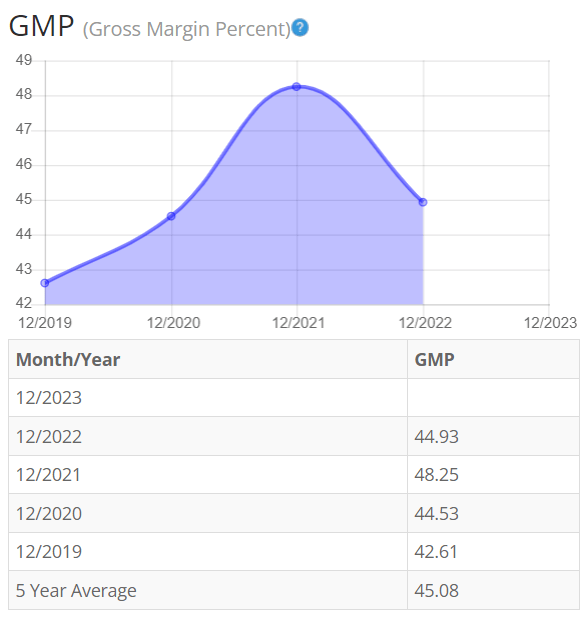
Financial Stability
Looking at other fundamentals involving the balance sheet, we can see that the debt-to-equity is less than one. The company shows low long-term debt and the ability to raise more capital, if need be, in the future.
AMD’s Current Ratio of 2.64 indicates it can pay off short-term debt with its current assets.
Ideally, we’d want to see a Current Ratio of more than 1, so AMD exceeds this amount.
AMD shows a strong balance sheet aside from being potentially overvalued with an extremely high P/E ratio. The company would have to hit high sales growth targets to maintain this valuation and is likely highly overvalued right now.
AMD does not pay a regular dividend.
This analysis wouldn’t be complete without considering the value of the company vs. share price.
Value Vs. Price
The company’s Price-Earnings Ratio of 224.10 indicates that AMD is extremely overpriced when comparing AMD Ratio to a long-term market average P/E Ratio of 15.
Even when comparing AMD’s P/E Ratio (TTM) versus its tech competition, we can clearly see that AMD seems extremely overpriced. AMD’s PE Ratio (TTM) is over three times greater than NVIDIA!
GuruFocus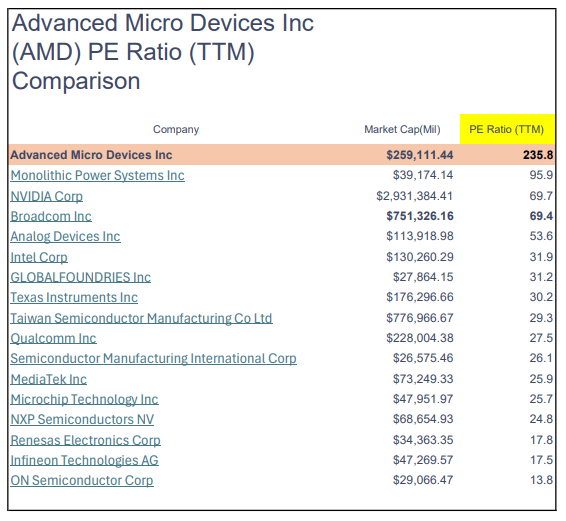
The 10-year and 5-year average P/E Ratio of AMD has typically been 110 and 136, respectively. This indicates that AMD could be currently trading at a high price when compared to its average historical P/E Ratio range.
For more detailed valuation purposes, I will be using a conservative diluted EPS of 0.53. I’ve used various past averages of growth rates and P/E Ratios to calculate different scenarios of valuation ranges from low to average values. The valuations compare growth rates of EPS, Book Value, and Total Equity.
In the table below, you can see the different scenarios, and in the chart, you will see vertical valuation lines that correspond to the table valuation ranges. The dots on the lines represent the current stock price. If the dot is towards the bottom of the valuation range, this would indicate that the stock is undervalued. If the dot is near the top of the valuation line, this would show an overvalued stock.
BTMA Wealth Builders Club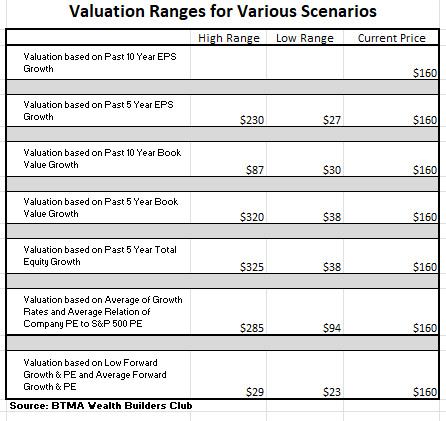
BTMA Wealth Builders Club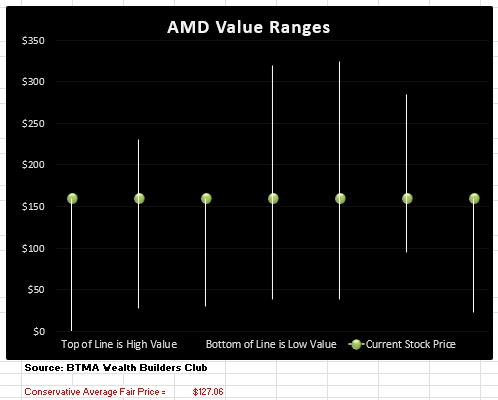
This analysis shows an average valuation of around $127 per share versus its current price of about $160, this would indicate that AMD is significantly overpriced.
Summarizing the Fundamentals
After analyzing the fundamentals, I believe that AMD is a formidable company, but it shows some red flags. The balance sheet indicates a financially strong business. Price per share has risen in the last 9 years as the AI movement and GPU data center sales expectations have driven the stock price higher. However, EPS, ROIC, ROE, and GMP have all fallen due to increased costs from research and development and sluggish sales of gaming GPU products. I expect a rebound of these metrics in the back half of 2024 as the highly anticipated sales growth begins to materialize and possibly mitigate some risk.
Additionally, there still remains some risk in my mind, that AMD could be overextending itself trying to compete with NVIDIA by taking on ever-increasing Research and Development Costs. AMD’s R&D costs ($5.8 billion) are approaching near NVIDIA’s R&D costs ($9.5 billion), but keep in mind that NVIDIA’s market cap is roughly 11 times bigger than AMD’s!
AMD Vs. The S&P 500
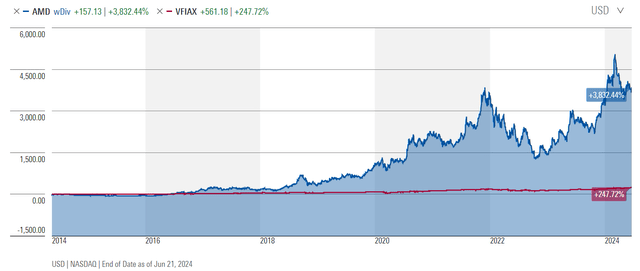
Now, let’s see how AMD compares versus the US stock market benchmark S&P 500 (SP500) over the past 10 years. From the chart below, AMD has crushed the overall market in returns making the S&P look like it is a flat line. The stock growth has accelerated over the last year due to the AI boom and expectations of a continued growing market. AMD could continue this strong sales growth with its data center GPU and capture some market share from Nvidia.
Forward-Looking Conclusion
Over the next five years, the analysts who follow this company are expecting it to grow earnings at an average annual rate of 33.16%.
In addition, the average one-year price target for this stock is $187.37, which is about a 16.2% increase in a year.
Does AMD Pass My Checklist?
- Company Rating 70+ out of 100? Yes (73.75).
- Share Price Compound Annual Growth Rate > 12%? Yes (60.98%).
- Earnings history mostly increasing? Yes.
- ROE (5-year average 16% or greater)? Yes (31.45%).
- ROIC (5-year average 16% or greater)? Yes (27.9%).
- Gross Margin % (5-year average > 30%)? Yes (45.08%).
- Debt-to-Equity (less than 1)? Yes.
- Current Ratio (greater than 1)? Yes.
- Outperformed S&P 500 during most of the past 10 years? Yes.
- Do I think this company will continue to successfully sell the same main product/service for the next 10 years? Yes.
AMD scored 10/10 or 100%. Therefore, AMD is a strong candidate to consider as a potential investment (if it is selling at a good price).
Is AMD currently selling at a bargain price?
- Price Earnings less than 16? No (224) – Extremely Overpriced.
- Estimated Value greater than the Current Stock Price? No (Value $127 < $160 Stock Price) – Significantly Overpriced.
AMD has a strong balance sheet and a growing product portfolio, especially in the AI data center GPU products. The AI industry and growing cloud infrastructure continue to drive meaningful growth in sales. AMD is looking to capture market share from Nvidia and put pressure on Nvidia as the incumbent in the market.
Aside from rising research and development costs and sluggish gaming GPU sales, AMD has maintained strong fundamentals with a recent downward decline. If the expected sales growth materializes, there should be strong rebounds in the fundamentals in 2024. The price-to-earnings ratio is very high and likely encompasses sales growth already baked into the stock price. This does make purchasing the stock at current levels a risk. Overall, the fundamentals are strong, and AMD will likely grow long-term, but short-term could be a risk (especially if buying at this inflated share price.)
I do not recommend entering a position in this company currently, unless you are a momentum trader who is aware of your risks. The current stock price has baked in massive growth and likely has a short-term correction. (Think of Tesla, Inc.’s (TSLA) rise a few years ago before correcting to reasonable levels.)
Long term, I believe this company could be a winner. However, I also see Advanced Micro Devices, Inc. as a less consistent and more risky stock than the higher-caliber companies such as Apple, Google, Amazon, and Nvidia.
But the company has shown great potential to be a strong fundamental competitor. I am adding it to my watch list and will wait patiently to see if the stock experiences a correction and can be bought at a fair-to-bargain price.
Analyst’s Disclosure: I/we have no stock, option or similar derivative position in any of the companies mentioned, and no plans to initiate any such positions within the next 72 hours. I wrote this article myself, and it expresses my own opinions. I am not receiving compensation for it (other than from Seeking Alpha). I have no business relationship with any company whose stock is mentioned in this article.
Seeking Alpha’s Disclosure: Past performance is no guarantee of future results. No recommendation or advice is being given as to whether any investment is suitable for a particular investor. Any views or opinions expressed above may not reflect those of Seeking Alpha as a whole. Seeking Alpha is not a licensed securities dealer, broker or US investment adviser or investment bank. Our analysts are third party authors that include both professional investors and individual investors who may not be licensed or certified by any institute or regulatory body.
If you want to find good companies at bargain prices that will provide you with long-term returns and dividends in any investing climate, then my Seeking Alpha Marketplace service (Good Stocks@Bargain Prices) is a good match for you.


