Summary:
- AMD’s stock has declined significantly, with technical analysis indicating a very weak outlook across daily, weekly, and monthly charts, flashing strong sell signals.
- Short-term and intermediate-term analyses show negative indicators, including a death cross in moving averages and bearish crossovers in stochastics and MACD.
- Despite some long-term support, the monthly analysis reveals significant downside risks, with bearish SMA crossovers and negative MACD and stochastics signals.
- Overall, AMD is rated a strong sell due to converging technical indicators suggesting major decline potential in the short and intermediate terms.
Ryan McVay/DigitalVision via Getty Images
Thesis
Advanced Micro Devices, Inc. (NASDAQ:AMD) (NEOE:AMD:CA) has declined significantly from its peak set early this year. A technical analysis of the daily, weekly, and monthly data shows a very weak outlook for AMD’s stock. AMD is flashing sell signals in its charts and in key indicators. The short-term and intermediate-term are particularly worrying, while even long-run investors should exercise extreme caution when evaluating AMD. In addition, looking at the fundamentals, AMD is overvalued as its growth is very modest. Therefore, I initiate a strong sell rating as a result of the analysis below.
Daily Analysis
Chart Analysis
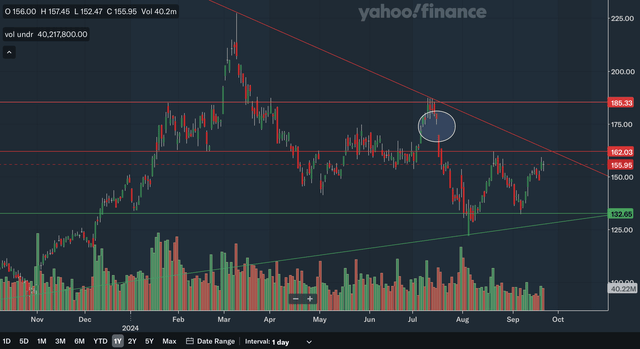
AMD is currently trading below two significant resistance zones as shown above in the low-160s area and mid-180s area. The low-160s area has been resistance in late August as well as in April and therefore could be a significant zone. The mid-180s area has been resistance in July and January. In addition, the gap that I have circled could prove to be further resistance in the mid-170s range. With this gap being the first one in quite a while, it has a significant chance it may not be closed in the near future. This closest area of support I identified above is in the low-130s range as AMD has bounced from this level three times this year in January, August, and just recently in September. This support level is both fresh and significant, as it has been hit by more than two times. As for trend lines, in the nearer term, AMD is getting weighed on by the downward-sloping trend line in red. This trend line is waiting for a third touch to be confirmed significant, but even if AMD drifts out horizontally, it is very near hitting that line. Lastly, there is an upward-sloping trend line that has developed, reaching back to the end of 2023. Moving forward, this trend line could reinforce the support level identified above as it nears 130. This could provide stronger support for AMD. As a whole, I am net neutral from this chart analysis of AMD, since we are trading in between key support and resistance levels. As the two trend lines converge, AMD will soon break out in either direction.
Moving Average Analysis
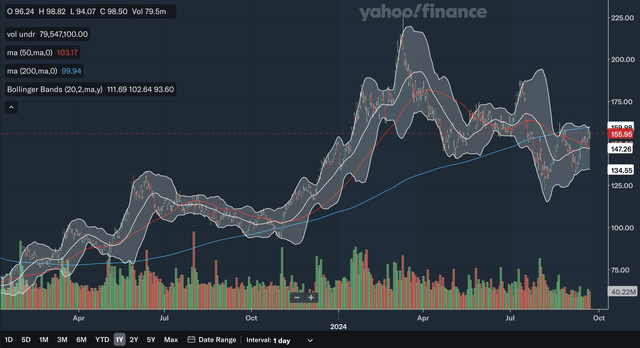
The moving averages show a very ugly picture for AMD. Its 200-day SMA and 50-day SMA formed a death cross in the recent past. A golden cross was formed in early 2023 and the stock was up over 100% since that signal. The newly formed death cross could cause AMD to retrace even more of that move. Currently, AMD is trading above its 50-day SMA showing that it has some near-term momentum, but it is still below the 200-day SMA and that level could prove hard to penetrate. I have also included the Bollinger Bands indicator above, and it shows that AMD has hit the upper band just very recently, showing that in the near term, it is overbought and could pull back to at least the centre 20-week average. Overall, I believe the moving average analysis shows a bleak short-term future for AMD as negative signals converge.
Indicator Analysis
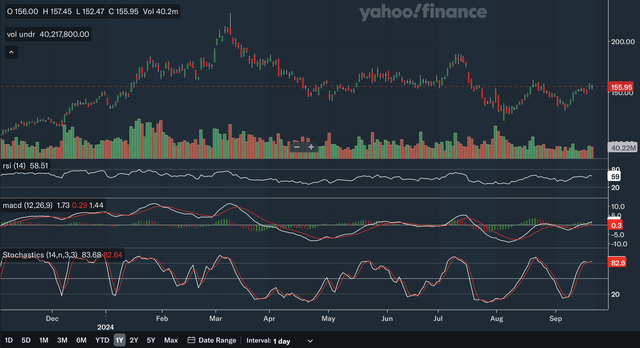
For the RSI, AMD is currently neither overbought nor oversold, as it is currently at 59. The RSI has not been past 80 or 20 in the graph above. The most notable development in the RSI is that it showed some divergence earlier this year. The highest RSI achieved this year was in January, which coincided with a stock price of around 160. The stock price went on to increase to over 200 in March, but the RSI failed to best the levels seen in January. Although the RSI basically stayed below the 80 mark, this could be seen as a top failure swing, indicating the potential for a pullback. We have seen that develop, and the downtrend could continue as a result of this divergence. As for the MACD, it is currently above the signal line, with a crossover earlier this month. This is potentially short-term bullish but, since then, the MACD has failed to significantly advance above the signal line and the histogram has been virtually flat, there is some weakness in the short-term positive trend. In terms of the stochastics indicator, I believe it shows a negative short-term outlook. While there are no significant divergences to discuss, the %K line has been above the %D line since early September, but recently the gap between the lines has narrowed and has disappeared. Currently, a bearish crossover may be taking place and that would indicate short-term weakness in AMD’s stock. Overall, I believe the analysis of these three key indicators shows a net negative situation for AMD in the short term.
Daily Analysis Takeaway
Despite a neutral outlook from the chart analysis, the moving average and indicator analyses show that the short-term outlook for AMD stock is quite negative. Most significant is the death cross in the moving averages and the potential bearish stochastics crossover. The short-term downside risk is significant.
Weekly Analysis
Chart Analysis
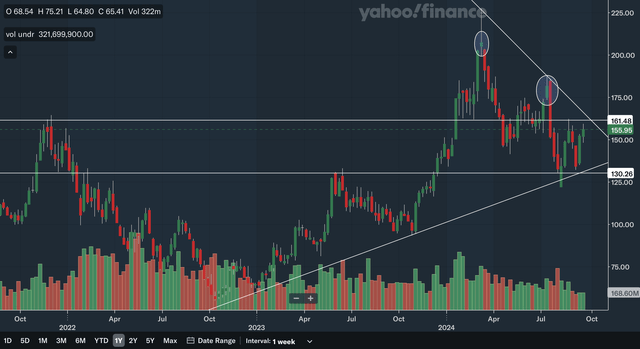
The support and resistance zones that I have identified in the above chart are very similar to the ones identified on the daily chart. However, we can now see that these levels stretch even further back in the trading history. The low-160s resistance level was hit in late 2021 and is proving to be significant as of late. As for the support level in the low-130s, that was hit all the way back in mid-2023 and even in early 2022. The two trend lines I identified above are basically the same ones as on the daily chart. I have circled two potentially significant candlestick formations that deserve caution. The first one is a doji with a large upper wick, showing a large reversal during that week. This doji is very close to a graveyard doji and could have signalled a major trend reversal. The second is a large bearish engulfing pattern, with the red candle far exceeding the length of the green candle. Again, this is a signal for caution as it further shows trend reversal. Overall, I would be slightly net negative from this chart analysis as it is trading between significant support and resistance, but it has shown ominous signals in its candlestick formations.
Moving Average Analysis
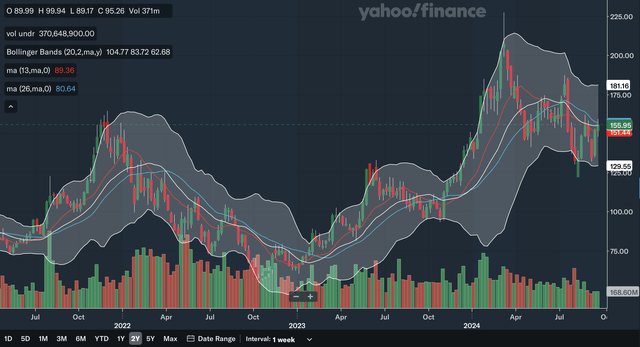
Similar to the moving average analysis of the daily chart, the weekly analysis is quite negative. The 13-week and 26-week SMAs have shown another bearish crossover earlier this year, showing the potential for a major pullback in the intermediate term. Similar to the daily analysis, the last time there was a bullish crossover in these weekly SMAs, the stock increased nearly 100%. AMD is currently trading above the 13-week SMA but below the 26-week SMA, showing very near-term momentum but large resistance above. As for the Bollinger Bands, the centre 20-week average is resistance on downtrends and with AMD trading right on that line currently, we could see AMD’s near-term upward momentum come to an end. From my analysis, AMD’s intermediate-term moving average analysis shows a highly negative outlook for its stock.
Indicator Analysis
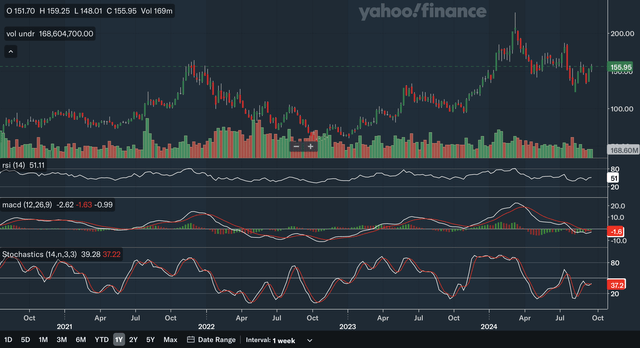
Similar to the daily analysis, the RSI showed some divergence over the intermediate term. Back in late 2022, the stock hit a high of around 160 and the RSI hit the 80 mark. Earlier this year, AMD hit a new high of over 200, but the RSI only hit 80, again without ascending higher. This signalled a potential end to the bull run in the intermediate term, and the decline continued to the present. For the MACD, the line has stayed below the signal line since early this year, and the stock has declined since then. The MACD seems to be closing the gap with the signal line, which is a positive, but in the middle of this year, it did the same thing, but the MACD ultimately failed to overcome the signal line. Until the MACD official breaks the signal line, I would be cautious about AMD stock. Lastly, the stochastics shows some positive divergence in the shorter run. Earlier this year, the stock dropped to around the 150 level and the stochastics dipped below the 20 oversold level. Later in the middle of the year, AMD dropped to a fresh low, but the stochastics did not confirm that move as it did not drop lower than the level set earlier in the year. Overall, I believe this weekly indicator analysis shows a net negative outlook for AMD, as the stochastics signal is a relatively short-term signal.
Weekly Analysis Takeaway
All three analyses of the weekly chart have been negative, reflecting a very negative intermediate outlook for AMD. Most notably, the 13-week and 26-week SMAs showed a bearish crossover, and the MACD continues to decline under its signal line. The intermediate-term downside for AMD is considerable.
Monthly Analysis
Chart Analysis
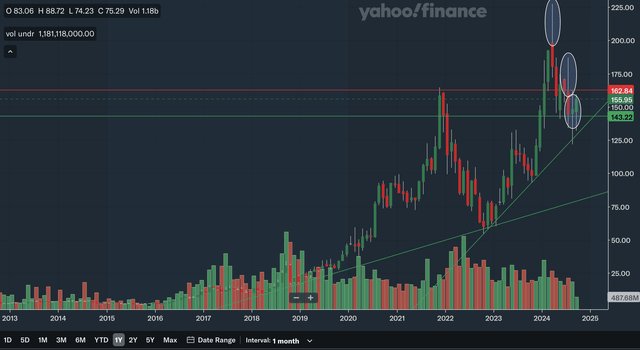
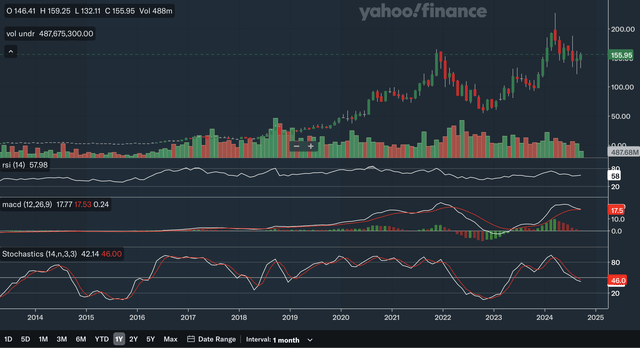
The resistance areas identified above are the same ones as on the daily and weekly charts. The support area is nothing new, but I identified it since has been bouncing off this level throughout this year. As for trend lines, the only new one identified is the longer range, slower upward-sloping trend line. This shows that AMD is still on a very long-term upward trend. Even if AMD were to break the intermediate upward trend line, it could still find support at the long-term trend line. However, as you can see, projecting that line out to 2025, it is still below the 100 mark, showing that the next area of support is well below current levels. I have also circled three notable candlestick formations. The first two are long upper wick candles that show there is weakness in AMD’s uptrend and could signal reversal. The third one is an equal-wicked doji, showing that the bearish pressure has at least subsided in the short term. Overall, I would still be net long-term positive about AMD, but the near-term risks are considerable given the next area of support is miles down.
Moving Average Analysis
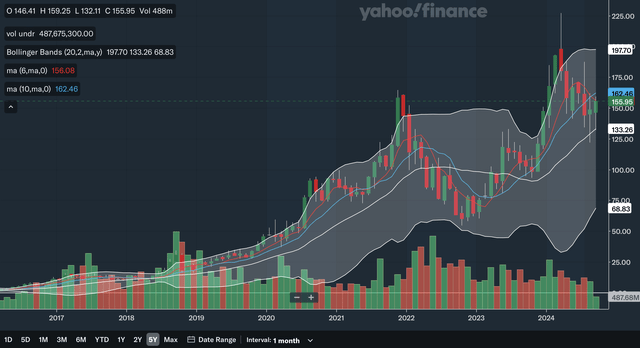
The 6-month and 10-month SMAs have shown a bearish crossover very recently. Similar to both the daily and weekly analyses, the stock was up around 100% after the previous bullish crossover. This shows that AMD stock’s pullback this year could be just the start of a major decline. The major difference compared to the daily and weekly analyses is the support from the Bollinger Bands. As shown above, AMD is still in a long-term uptrend, and so the 20-month average centre line on the Bollinger Bands should provide support as the stock bounces from the upper band. Just very recently, we have seen AMD bounce from that level, and it may find support there in the near future. However, if AMD breaks down from that level, the lower band becomes the target price, and therefore AMD could have a long way to drop. Overall, the monthly moving average analysis shows a highly negative outlook for AMD, but the Bollinger Bands is showing some near-term support.
Indicator Analysis
The divergence in the RSI is virtually the same as discussed in the weekly analysis. This RSI currently sits at a 58 level, neither overbought nor oversold. For the MACD, it is currently right at the crossover with the signal line. This could be a major bearish signal as the MACD has been above the signal line since early 2023 and the stock advanced over 100% after the signal. The last time the MACD declined below the signal line, the stock plunged significantly. For the stochastics, the %K line is below the %D line after a bearish crossover earlier this year, indicating a continuation of the negative trend. The crossover took place within the 80 overbought range, making this signal even more significant. Overall, the long-term indicator analysis shows AMD stock is very vulnerable to a major pullback as negative signals converge.
Monthly Analysis Takeaway
Even though, the chart analysis shows a net minor positive outlook, the highly negative moving average and indicator analyses are very concerning for AMD. The emergence of the bearish 6-month and 10-month SMA crossover recently and the highly negative conditions in both the MACD and the stochastics shows that there is weakness in the long term. Overall, I believe that while the long term is more promising than the intermediate and short terms, even long-term investors should practice extreme caution as there are many red flags in AMD’s long-run outlook.
Fundamentals & Valuation
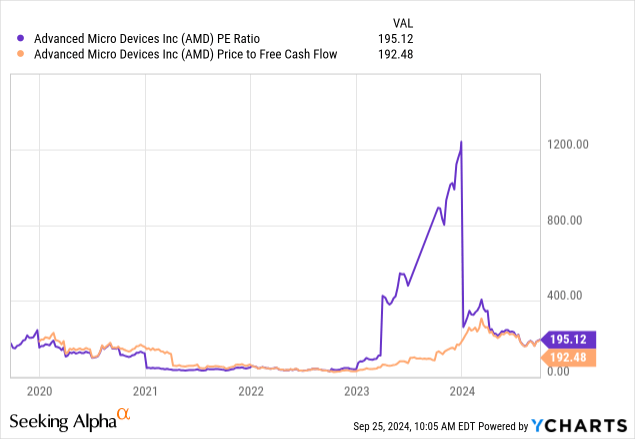
Back in July, AMD reported its Q2 results and the growth rates were very modest. Their revenue was reported to be $5.835 billion, up 9% YoY, while adjusted diluted EPS was $0.69, up 19% YoY. In terms of their business segments, they had mixed results as Data Center revenues were up 115% YoY and Client segment revenues were up 49% YoY, while their Gaming segment saw revenues decline by 59% YoY and Embedded segment revenues decline by 41%. In my view, these mediocre growth figures do not support the current rich valuation figures. The P/E and P/FCF ratios have both declined significantly from their peaks, as shown above. However, they are still at nosebleed levels relative to AMD’s growth. Revenue being up by just single digits and EPS up by a mere 19% does not warrant the valuation to be anywhere near current levels. In addition, the Seeking Alpha valuation rating for AMD is an F with the stock being overvalued in virtually all multiples.
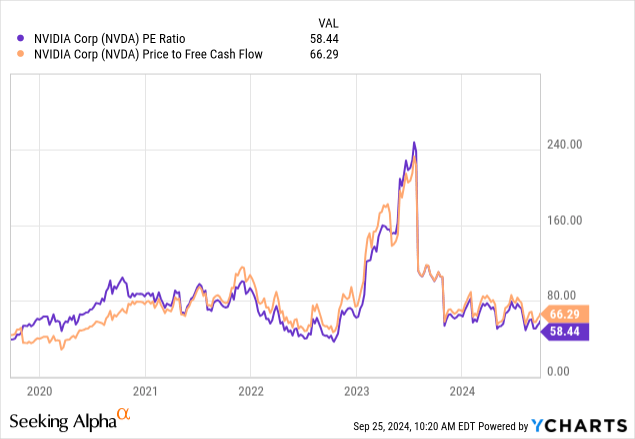
As a comparison, I have included NVIDIA’s (NASDAQ:NVDA) P/E and P/FCF ratios above. In August, Nvidia reported revenue growth of 122% while adjusted diluted EPS grew by 152%. These growth figures are much stronger than AMD’s yet, its P/E and P/FCF ratios are significantly lower. From my analysis, AMD is significantly overvalued relative to its growth prospects and its multiples could contract to below Nvidia’s level as its growth is relatively poor.
Conclusion
In all three timeframes, the overall outlook for AMD is very negative. In the short and intermediate terms, the technical pictures warrant a strong sell rating in my view, as many technical approaches converge to the conclusion of major decline potential ahead. As for the long run, I believe it is less negative, as shown in the chart analysis section. However, long-run investors should be mindful of the long-term red flags that were discussed and the highly negative developments in the short and intermediate terms. In addition, a look into its fundamentals and valuation shows that AMD is significantly overvalued relative to its growth. From my analysis of AMD, I believe its stock is a strong sell.
Analyst’s Disclosure: I/we have no stock, option or similar derivative position in any of the companies mentioned, and no plans to initiate any such positions within the next 72 hours. I wrote this article myself, and it expresses my own opinions. I am not receiving compensation for it (other than from Seeking Alpha). I have no business relationship with any company whose stock is mentioned in this article.
Seeking Alpha’s Disclosure: Past performance is no guarantee of future results. No recommendation or advice is being given as to whether any investment is suitable for a particular investor. Any views or opinions expressed above may not reflect those of Seeking Alpha as a whole. Seeking Alpha is not a licensed securities dealer, broker or US investment adviser or investment bank. Our analysts are third party authors that include both professional investors and individual investors who may not be licensed or certified by any institute or regulatory body.

