
Summary:
- Advanced Micro Devices’ revenue growth and margins are recovering, but H1 2024 growth fell short; Q3 2024 indicates a 16% YoY increase.
- The Gaming segment declined due to weak gaming console sales, while the Embedded segment was affected by broader FPGA market weakness.
- Profitability margins show improvement, driven by normalization of amortization expenses post-Xilinx acquisition.
- We maintain our Buy rating on AMD, expecting growth to improve through 2025 despite H1 challenges.
JHVEPhoto
In our previous analysis, we highlighted the competition between Advanced Micro Devices, Inc. (NASDAQ:AMD) and Intel in the CPU market, with AMD having seen significant growth in desktop CPUs, narrowing the performance gap and increasing its market share, and similarly in the server CPU market with AMD gaining share rapidly against Intel.
In this current analysis, we examine whether the company’s revenue growth and margins are on track to continue recovering. The company’s revenue growth in H1 2024 was 4% YoY, falling short of our forecast of 27.5% but management’s guidance for Q3 indicates a 16% YoY increase. In terms of profitability, its net margin increased to 5.8%, up from 3.77% in 2023, but it still lags behind our previous forecast of 12.6%. Firstly, we identify the underperforming segments, including Gaming and Embedded, to determine the reasons for the decline. For the Gaming segment, we analyze whether the decline could be attributed to the gaming console market. In the Embedded segment, we assess whether the weakness is due to broader market conditions or company-specific factors. Finally, we compile and analyze the profitability margins of the company’s segments to determine the trend in margin growth driven by higher-growth segments.
|
AMD Revenue Breakdown ($ bln) |
2020 |
2021 |
2022 |
2023 |
H1 2024 |
Average |
|
Data Center |
1,685 |
3,694 |
6,043 |
6,496 |
5,171 |
|
|
Growth % YoY |
119.2% |
63.6% |
7.5% |
97.7% |
63.4% |
|
|
Client |
5,189 |
6,887 |
6,201 |
4,651 |
2,860 |
|
|
Growth % YoY |
32.7% |
-10.0% |
-25.0% |
64.7% |
-0.7% |
|
|
Gaming |
2,746 |
5,607 |
6,805 |
6,212 |
1,570 |
|
|
Growth % YoY |
104.2% |
21.4% |
-8.7% |
-53.0% |
38.9% |
|
|
Embedded |
143 |
246 |
4,552 |
5,321 |
1,707 |
|
|
Growth % YoY |
72.0% |
1750.4% |
16.9% |
-43.5% |
613.1% |
|
|
Total |
9,763 |
16,434 |
23,601 |
22,680 |
11,308 |
|
|
Growth % YoY |
68.3% |
43.6% |
-3.9% |
5.6% |
36.0% |
Source: Company Data, Khaveen Investments
Gaming Segment Decline Due to Weak Gaming Console Sales
Firstly, we examine why the Gaming segment underperformed our previous forecasts. The Gaming segment consists of revenues from its PC GPUs and semi-custom SoCs. According to management, the decline was attributed to the decline in “semi-custom SoC sales”. Based on our estimates in previous analyses, its semi-custom SoCs are primarily used as chipsets in gaming consoles such as Sony’s (SONY) PlayStation and Microsoft’s (MSFT) Xbox, accounting for 85% of its segment revenue. Moreover, management also indicated that “Semi-custom demand remains soft” and provided a grim outlook with expectations for “sales to be lower in the second half of the year compared to the first half”. On the other hand, management stated that its PC GPU revenues increased with positive growth YoY. Therefore, we focused on the company’s semi-custom SoC business.
Gaming Console Market Shipments
Thus, we compiled total gaming console shipments by year for Microsoft’s Xbox series, Sony’s PlayStation series as well as all of Nintendo’s game consoles series such as Switch and others.
|
Total Gaming Console Shipments (‘mln’) |
2014 |
2015 |
2016 |
2017 |
2018 |
2019 |
2020 |
2021 |
2022 |
2023 |
Q1 2024 |
Q2 2024 |
Average |
|
Microsoft |
9.6 |
9.9 |
9.2 |
8.8 |
6.5 |
7.0 |
8.2 |
8.7 |
7.5 |
0.9 |
1.1 |
||
|
Growth % YoY |
3.1% |
-7.4% |
-4.1% |
-25.7% |
6.6% |
17.5% |
5.9% |
-13.5% |
-51.9% |
-42.0% |
-2.2% |
||
|
Sony |
22.4 |
18.7 |
19.4 |
19.4 |
17.7 |
14.6 |
10.7 |
14.7 |
14.9 |
22.7 |
4.5 |
2.4 |
|
|
Growth % YoY |
-16.6% |
4.0% |
0.0% |
-8.8% |
-17.5% |
-26.7% |
37.4% |
1.4% |
52.3% |
-28.6% |
-27.3% |
5.3% |
|
|
Nintendo |
12.6 |
10.2 |
10.8 |
21.5 |
19.5 |
21.7 |
29.0 |
23.1 |
18.0 |
15.7 |
2.0 |
2.1 |
|
|
Growth % YoY |
-19.2% |
6.0% |
99.2% |
-9.1% |
11.4% |
33.5% |
-20.5% |
-22.1% |
-12.6% |
-35.9% |
-46.3% |
10.7% |
|
|
Total |
34.9 |
38.4 |
40.1 |
50.0 |
46.0 |
42.9 |
46.7 |
45.9 |
41.5 |
45.9 |
7.4 |
5.6 |
|
|
Growth % YoY |
10.0% |
4.3% |
24.8% |
-8.1% |
-6.8% |
8.9% |
-1.5% |
-9.6% |
10.5% |
-10.6% |
-47.7% |
2.8% |
Source: Company Data, Statista, Khaveen Investments
Based on the table above, Nintendo game consoles series such as its Nintendo 3DS, Switch, and others have the highest average shipment growth at 10.7%, whereas Microsoft’s Xbox shipments have the lowest growth. To add on, Sony’s shipment growth has been growing steadily at 5.3% during the same period. However, importantly, total gaming console shipments decreased significantly during 2024, with total Q2 2024 shipments declining substantially by -47.7%, the highest in 10 years.
Cumulative Console Sales
Furthermore, management also stated, “we are now in the fifth-year of the console cycle”. We compiled the latest gaming console gen by Microsoft for its Xbox Series X/S and by Sony for its PS5 series to analyze the current shipment trends below.
|
PS5 and Xbox Series X/S Shipments (‘mln’) |
2020 |
2021 |
2022 |
2023 |
2024F |
2025F |
2026F |
2027F |
|
PS5 Cumulative |
4.5 |
17.3 |
32.1 |
54.8 |
65.8 |
78.9 |
94.2 |
112.3 |
|
Growth % YoY |
284.4% |
85.5% |
70.7% |
20.1% |
19.8% |
19.5% |
19.2% |
|
|
Shipments by Year |
4.5 |
12.8 |
14.8 |
22.7 |
11.0 |
13.0 |
15.3 |
18.1 |
|
Growth % YoY |
184.4% |
15.6% |
53.4% |
-51.4% |
17.9% |
17.9% |
17.9% |
|
|
Xbox Series X/S Cumulative |
3.0 |
11.1 |
19.7 |
27.2 |
30.9 |
35.2 |
40.2 |
46.2 |
|
Growth % YoY |
268.1% |
78.1% |
38.0% |
13.4% |
13.9% |
14.4% |
14.8% |
|
|
Shipments by Year |
3.0 |
8.1 |
8.7 |
7.5 |
3.6 |
4.3 |
5.1 |
6.0 |
|
Growth % YoY |
168.1% |
7.2% |
-13.4% |
-51.4% |
17.9% |
17.9% |
17.9% |
|
|
Total Cumulative Shipments |
7.5 |
28.4 |
51.8 |
82.0 |
96.7 |
114.0 |
134.4 |
158.5 |
|
Growth % YoY |
277.9% |
82.6% |
58.2% |
17.9% |
17.9% |
17.9% |
17.9% |
|
|
Total Shipments by Year |
7.5 |
20.9 |
23.5 |
30.2 |
14.7 |
17.3 |
20.4 |
24.1 |
|
Growth % YoY |
177.9% |
12.4% |
28.7% |
-51.4% |
17.9% |
17.9% |
17.9% |
Source: Company Data, Statista, Khaveen Investments
Company Data, Statista, Khaveen Investments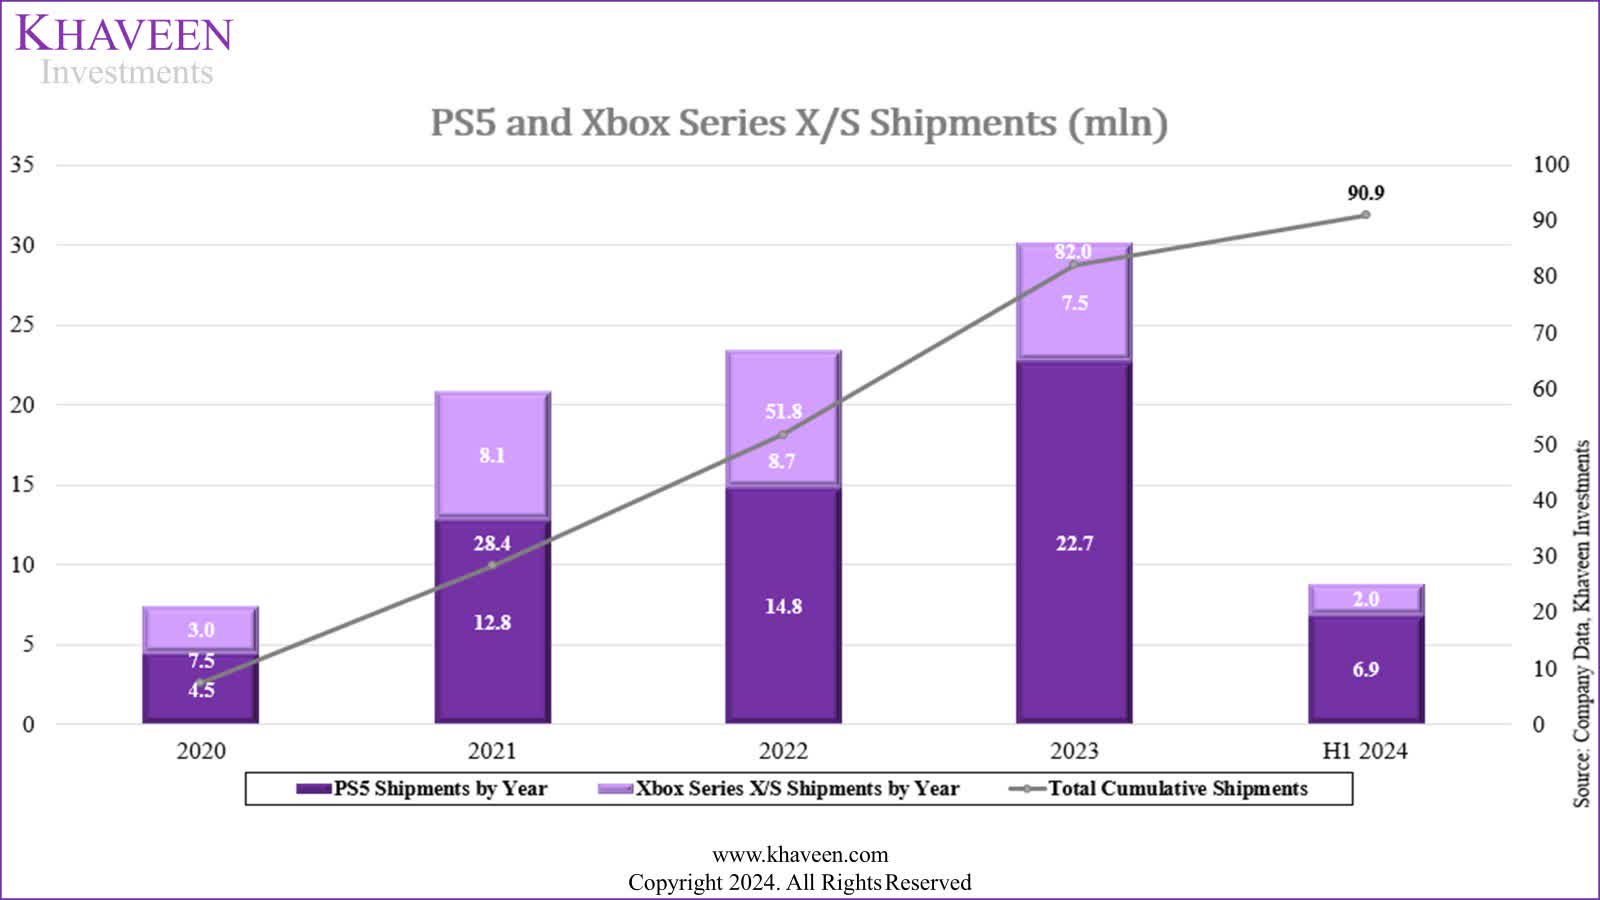
Based on the table above, total shipments per year have increased consistently every year from 7.5 mln in 2020 to 30.2 mln in 2023. However, significant growth slowdown of 12.4% in 2022 compared to the previous year, due to supply chain shortages for Sony and Microsoft. Moreover, total cumulative shipments have increased from a mere 7.5 mln to a significant 90.9 mln. Importantly, during H1 2024, shipments per year declined considerably by -33.4%. Moreover, Microsoft’s Xbox X/S series contributed the majority of the H1 2024 shipments decline, as shipments declined -47.0%, whereas Sony shipments declined only -28.1%. Sony’s shipment growth was also consistently better than Microsoft’s for the same period, with the most significant difference during 2023, whereby Sony shipments grew 53.4% and Microsoft declined -13.4%.
Comparison with Previous Generations
|
Cumulative Shipments by Generation (‘mln’) |
Gen 1 (PS1) |
Gen 2 (PS2 & Xbox) |
Gen 3 (PS3 & Xbox 360) |
Gen 4 (PS4 & Xbox One) |
Gen 5 (PS5 & Xbox X/S) |
|
Sony |
102.5 |
158.7 |
87.4 |
117.2 |
61.7 |
|
Microsoft |
24.7 |
85.7 |
58 |
29.2 |
|
|
Total Shipments |
102.5 |
183.4 |
173.1 |
175.2 |
90.9 |
|
Growth % |
78.9% |
-5.6% |
1.2% |
-48.1% |
Source: Company Data, Statista, Khaveen Investments
Based on the table above, cumulative console shipments peaked during Gen 2 (PS2/Xbox) at 183.4 mln before slightly decreasing for the following generations. Furthermore, cumulative shipments declined significantly by -48.1% for Gen 5 (PS5/Xbox X/S), when compared to the previous generation. As mentioned before, the slowdown in Gen 5 shipments is likely because Gen 5 consoles are still in the middle of the product cycle and have not completed the full product cycle yet. Moreover, both Sony and Microsoft are expected to launch their model refreshes for the current generation consoles. Sony’s PS5 Pro is expected to run AMD’s 8-core Zen 4 CPU, AMD’s iGPU based on RDNA 3 or RDNA 3.5, as well as TSMC’s 5/4 nm process nodes. Additionally, the report also highlighted that “the PS5 Pro’s 33.5 TFLOPs would give it twice the raw processing power of the current PlayStation 5”. Thus, the new PS5 Pro is expected to have 45% higher rendering speed compared to PS5, 2 to 3x ray tracing, and is expected to support 8K resolutions through future software updates. Additionally, Sony recently announced the new PS5 Pro, which is expected to launch in early November, with pre-orders starting during September. Comparatively, Microsoft’s 3 new Xbox X/S are expected to be released later this year such as the new All-Digital Series X (1 TB SSD), Special Edition Series X (2 TB SSD), and Series S (1 TB SSD)
Outlook
Overall, we believe the decline in AMD’s Gaming segment is due to the sharp contraction of the gaming console market in H1 2024. We believe the reasons for the decline are unlikely due to chip shortages for consoles, as the issue had already been resolved in 2023. Furthermore, the reason for the shipment decline in 2024F is also unlikely to be reduced gamer interest in new games, as playtime for new games is quite consistent, averaging around 21% of total playtime from 2021 to 2023. We believe the reason for the decline is also unlikely to be a decline in the number of gamers, as the number of console players has increased at 6.8% CAGR from 2018 to 2023.
However, we believe the reason for shipments decline in 2024 could be due to more structural factors in the gaming console market. For example, the rise of cross-play whereby consumers do not have to purchase newer-gen consoles to have access to new games, as they can use their previous-gen consoles to play with new gens. Cross-play is defined as allowing “different gaming platforms to share the same online servers in a game, allowing players to join regardless of the platform”. Furthermore, there is a substantial number of cross-playable games which reduces the need for new consoles, as there are 143 cross-playable games between PS4 and PS5 (20.4% of 700 PS5 games) as well as 123 cross-playable games between Xbox One and Xbox X/S (27.8% of 442 Xbox X/S games). Additionally, in terms of the gaming market, console games accounted for a 28% share of the total gaming market in 2023, a decline from a share of 39% in 2019. On the other hand, the share of mobile gaming has risen significantly, from 23% to 49%, indicating the rise in mobile gaming which, we believe, could also further suggest gamers’ engagement in console gaming has declined.
However, we believe there is still an opportunity for continued sales of the current generation of consoles which is only around 50% of the previous total cumulative sales of past console generations, indicating remaining sales opportunity throughout the current cycle. For our projections, we first forecasted 2027F total cumulative shipments by multiplying the peak of the previous gen cumulative shipments (175.2 mln), against the average remaining percentage of cross-playable console games, against the remaining change in console games % of total games from 2019 to 2023, against the average number of active gamers growth rate from 2020 to 2024. We then calculate the forecasted cumulative shipments CAGR from 2023 to our expected 2027F to get 17.9% CAGR. Furthermore, we calculated the shipments per year by measuring the change in cumulative shipments per year.
Embedded Segment Affected by FPGA Market Weakness
Besides the Gaming segment, the Embedded segment also declined significantly, weighing down the company’s performance in H1 2024. Therefore, we examined why the Embedded segment underperformed our forecasts. Furthermore, we explore whether this underperformance is due to market-specific or company-specific factors and whether its growth outlook could improve through the rest of the year.
The company’s Embedded segment consists of products such as FPGAs and other embedded processors. We believe the segment’s primarily focuses on the FPGA business. This is as in 2022, AMD acquired Xilinx, which we previously covered, and we estimated contributed around 90% of its Embedded segment revenues.
AMD’s FPGA competitors include Intel (Altera), Microchip (MCHP), and Lattice (LSCC). Thus, to determine whether the company’s weak performance in Embedded is due to market factors, we compiled the revenue performance of AMD’s competitors below.
|
Company FPGA Revenues ($ mln) |
2020 |
2021 |
2022 |
2023 |
H1 2024 |
Average |
|
Intel (Programmable Solutions Group) |
1,853 |
1,934 |
2,722 |
2,958 |
1,250 |
|
|
Growth % YoY |
-6.7% |
4.4% |
40.7% |
8.7% |
-57.8% |
11.8% |
|
Lattice |
408 |
515 |
660 |
737 |
236 |
|
|
Growth % YoY |
1.0% |
26.3% |
28.1% |
11.6% |
-28.7% |
16.8% |
|
Microchip |
954 |
1,021 |
1,266 |
1,367 |
567 |
|
|
Growth % YoY |
-0.2% |
7.1% |
23.9% |
8.0% |
-16.1% |
4.6% |
|
AMD (Embedded) |
143 |
246 |
4,552 |
5,321 |
1,707 |
|
|
Growth % YoY |
72.0% |
1750.4% |
16.9% |
-67.9% |
442.9% |
|
|
Total |
3,358 |
3,717 |
9,200 |
10,383 |
3,760 |
|
|
Growth % |
0.3% |
10.7% |
147.5% |
12.9% |
-63.8% |
26.8% |
Source: Company Data, Khaveen Investments
Based on the table above, in H1 2024, all companies experienced a downturn in revenue. AMD, which had previously seen growth in 2023, saw a sharp decline of 67.9% in H1 2024. Similarly, Intel experienced a large decline of 57.8% (Altera). However, smaller competitors Lattice and Microchip had a less severe decline in H1 2024. Thus, we believe this sharp drop in revenue across all companies in H1 2024 indicates a market-specific decline affecting the entire FPGA segment.
Company Data, Khaveen Investments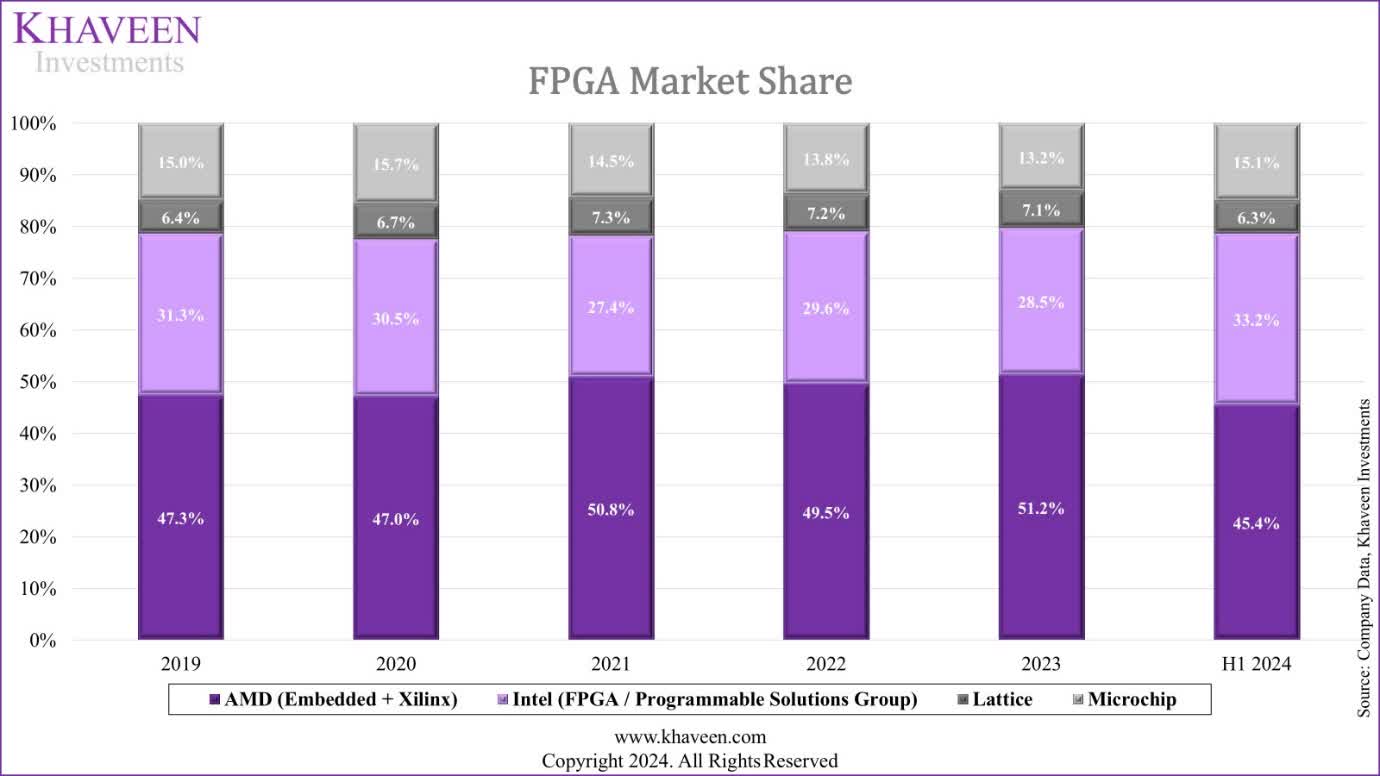
*AMD Market Share Before 2022 Based on Xilinx
We adjusted AMD revenues before 2022 to include Xilinx for a better comparison of AMD’s market share before 2022, as AMD acquired Xilinx in February 2022, and without including Xilinx, AMD’s market share would be 4.3% in 2020. Based on the chart above, AMD’s market share grew from 47.3% in 2019 to a peak of 51.2% in 2023, following the acquisition of Xilinx. Furthermore, AMD’s market share remained stable over the 5 years but moderated slightly in H1 2024, whereas Intel’s market share had increased slightly in H1 2024.
Market Weakness and Outlook
Overall, we believe the company’s Embedded performance has primarily been affected by the wider FPGA market weakness rather than due to the competitiveness of AMD. Based on AMD’s annual report, it stated that “Embedded segment revenue decreased as a result of an inventory correction in several end markets in the second half of 2023”. There has been indication of FPGA market oversupply since 2023 as according to Supply Frame:
By the end of 2023, stockpile levels were increasing, with the Commodity IQ Inventory Index for FPGAs rising above the baseline in October and November.
Furthermore, AMD’s competitors such as Lattice and Intel both highlighted the market inventory correction as well. Lattice reported a significant sequential and year-over-year revenue decline as customers reduced inventory. Intel noted that the FPGA market is undergoing an industry-wide correction, expected to persist into the first half of 2024.
In our previous analysis of Lattice, we highlighted that the company experienced weakness across specific end markets ‘Communication and Computing’ and ‘Consumer’ segments of the company in 2023 with a decline of 6.3% and 6% respectively, whereas its Industrial and Automotive segments growth remained strong at 35.7%. However, Lattice’s latest earnings briefing in Q2 2024 indicated its industrial and automotive market segments had also experienced weakness.
We compiled the various types of products that use FPGA chips. For example, this includes Aerospace Electronics, Medical Devices, Industrial Automation, Test and Measurement Equipment in the Industrial end market, as well as Servers in the Data Centers end market. Additionally, this also includes Telecom Equipment, Ethernet Switch, and Router in the Communications end market, and also Streaming Boxes / Set-Top Boxes, Smart Cameras in the Consumers end market, as well as Automotive ADAS, and Automotive Infotainment in the Automotive end markets.
|
FPGA Products |
Market |
Segment |
2023 Market Performance |
H1 2024 Market Performance |
2024F Market Performance |
Market Size ($ bln) |
Market Forecast CAGR |
|
Aerospace Electronics |
Aerospace & Defense |
Industrials |
6.0% |
11.6% |
5.1% |
112.15 |
6.5% |
|
Medical Devices |
Medical Devices |
Industrials |
6.4% |
4.7% |
6.4% |
478.54 |
5.7% |
|
Industrial Automation |
Industrial Automation |
Industrials |
7.7% |
-3.6% |
2.0% |
83.68 |
8.2% |
|
Test and Measurement Equipment |
Test and Measurement Equipment |
Industrials |
5.9% |
-5.1% |
-1.8% |
34.37 |
4.6% |
|
Servers |
Data Center |
Data Center |
-2.1% |
34.3% |
19.8% |
95.00 |
12.3% |
|
Telecom Equipment |
Communications Equipment |
Communications |
-5.0% |
-15.7% |
-5.2% |
718.30 |
4.1% |
|
Ethernet Switch |
Communications Equipment |
Communications |
20.1% |
-4.0% |
3.3% |
44.20 |
5.5% |
|
Router |
Communications Equipment |
Communications |
-0.4% |
-9.9% |
-8.1% |
16.40 |
3.6% |
|
Streaming Boxes/Set-top boxes |
Consumer Electronics |
Consumer |
4.7% |
1.6% |
0.7% |
20.05 |
3.3% |
|
Smart Cameras |
Consumer Electronics |
Consumer |
12.8% |
10.6% |
8.5% |
25.55 |
15.7% |
|
Automotive ADAS |
Automotive |
Automotive |
10.1% |
9.5% |
10.9% |
38.10 |
17.0% |
|
Automotive Infotainment |
Automotive |
Automotive |
5.8% |
-9.9% |
0.6% |
27.3 |
6.5% |
Source: Company Data, Market Research Reports, Khaveen Investments
Based on the table, the communications, industrial, and automotive markets declined the most in H1 2024. Furthermore, the decline in all end markets is less severe than the overall decline in the FPGA market. Notably, the telecom equipment market had the highest negative growth of -5.0% in 2023, as telecom companies reduced their capex, which we had previously highlighted that “telecom companies’ capex spending declined mainly due to the normalization of 5G buildout” in 2023. Additionally, the telecom equipment market is the largest among the products analyzed. FPGAs are used in base stations and cell towers, whereby on average 8 to 64 FPGAs are used for each base station for faster connectivity, based on Xilinx’s FPGA base station specifications. According to Control Design:
Telecommunications make extensive use of FPGAs in their infrastructure for signal processing and handling network packets, as well as baseband processing in wireless communications.
One of the advantages of FPGA for wireless communications is its reconfiguration capability. Furthermore, based on Xilinx’s previous FY2021 annual report, the ‘Wired and Wireless’ segments accounted for 30% of revenues, and are the second-largest segment, highlighting Xilinx’s (AMD) dependence on the segment.
Moreover, the router market had been sluggish in 2023 with a flattish growth of -0.4%, and while Ethernet switch market growth was strong in 2023, it has had a weak performance with a sharp decline of -27% YoY in Q1 2024. In Data Centers, while server market growth decline by 2.1% in 2023, it is forecasted to rebound strongly by 24.1% in 2024 due to demand for AI infrastructure; thus we believe it is unlikely to be the reason for the FPGA decline in 2024. Additionally, the automotive market also declined, as automotive infotainment declined by -10%, whereby for each automotive infotainment device, there are on average 5 FPGAs used. Moreover, the Industrial market also declined moderately, as the Industrial Automation and Test and Measurement Equipment declined by around 4%.
Notably, the decline in the most significant end markets (communications, industrial, automotive) is significantly less than the decline of the FPGA market (-64%), which, we believe, is likely due to the number of FPGAs used in each device or application. We believe this may be due to a single device that could contain multiple FPGAs, meaning that a decline in unit sales would have a disproportionately larger impact on FPGA companies. For example, as we highlighted above in the communications market, each base station uses on average 8 to 64 FPGAs, and for each less base station sold, this would lead to a larger impact on the FPGA companies, as they could potentially lose the sale of 8 to 64 FPGAs. This is also highlighted in the decline of automotive infotainment, where on average 5 FPGAs are used for each device. Furthermore, we believe the main factor affecting the FPGA market’s weak performance in 2024 is the weakness in the communications end market-related products that feature FPGAs such as telecom equipment and networking products (Ethernet and router), which Xilinx has a large exposure to, based on its revenue breakdown (30%). Despite H1 market declines, forecasts for the full year are better, as most markets are expected to improve during H2, which, we believe, would support a recovery in the FPGA market.
Outlook
Overall, we believe the decline in the company’s Embedded segment is primarily attributable to the FPGA market in H1 2024, due to broader market-specific factors rather than company-specific issues for AMD. This is because there were significant revenue declines among major competitors like Intel and AMD, which saw drops of 57.8% and 67.9% in H1 respectively. According to these companies, the common reason highlighted is due to an industry-wide inventory correction that began in late 2023, resulting in oversupply and decreased demand across various end markets. Specifically, we believe the Communications end market’s weakness, which accounted for 30% of Xilinx revenues, could be a factor for the FPGA market decline, affecting AMD, which has a large exposure to the end market. However, we anticipate the FPGA market to recover in H2 2024, as most markets are expected to improve for 2024F. Additionally, we expect the FPGA market to stabilize going forward with a long-term market growth CAGR which is positive (4.1% for telecom equipment, 5.5% for Ethernet and 3.6% for routers). Additionally, AMD anticipates a gradual recovery in the FPGA market during the second half of 2024. Additionally, the company highlighted strong design wins totaling over $7 bln in H1 2024, which is a 40% increase according to management in its latest earnings briefing.
Profitability Improvement as Amortization Expenses Normalize
In the final section, we examine the growth performance of its other segments in relation to the company’s profitability and determine whether its improvement in profitability margins could have been due to stronger margins of its high-growth segments.
Company Profitability Margins
Company Data, Khaveen Investments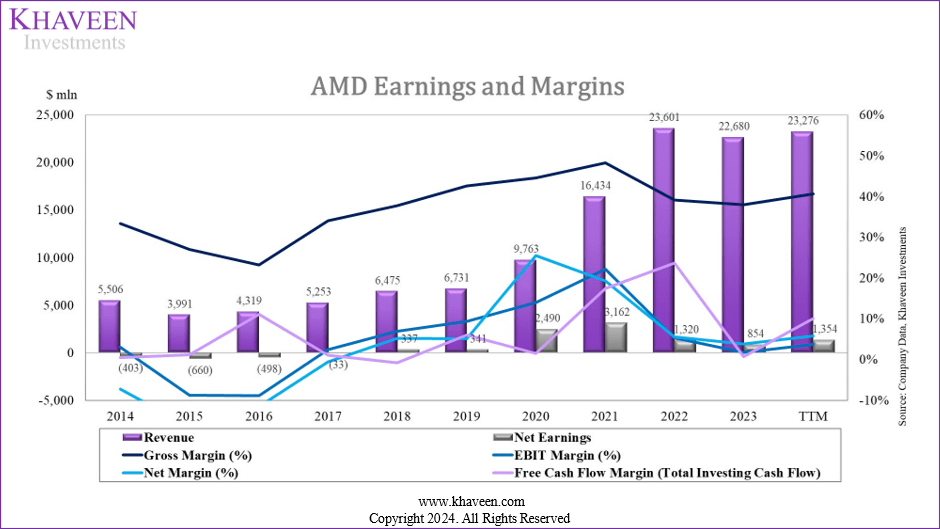
|
Earnings & Margins |
2016 |
2017 |
2018 |
2019 |
2020 |
2021 |
2022 |
2023 |
TTM |
|
Revenue Growth |
8.22% |
21.63% |
23.26% |
3.95% |
45.05% |
68.33% |
43.61% |
-3.90% |
2.63% |
|
Gross Margin |
23.22% |
34.02% |
37.79% |
42.61% |
44.53% |
48.25% |
39.16% |
37.93% |
40.68% |
|
EBIT Margin |
-8.87% |
2.42% |
6.97% |
9.37% |
14.02% |
22.20% |
5.36% |
1.77% |
3.74% |
|
Net Margin |
-11.53% |
-0.63% |
5.20% |
5.07% |
25.50% |
19.24% |
5.59% |
3.77% |
5.82% |
Source: Company Data, Khaveen Investments
In Q2 2024 TTM, AMD’s margins showed a slight improvement compared to the previous year. The company’s gross margin increased slightly, as well as its EBIT and net margins. Notably, the company’s operating and net margins declined sharply following the acquisition of Xilinx in 2022.
Segment Profitability
|
Operating Margin % |
2021 |
2022 |
2023 |
H1 2024 |
|
Data Center Revenue |
3,694 |
6,043 |
6,496 |
5,171 |
|
Growth % |
119.2% |
63.6% |
7.5% |
97.7% |
|
Data Center Operating Margin |
26.8% |
30.6% |
19.5% |
24.8% |
|
Client Revenue |
6,887 |
6,201 |
4,651 |
2,860 |
|
Growth % |
32.7% |
-10.0% |
-25.0% |
64.7% |
|
Client Operating Margin |
30.3% |
19.2% |
-1.0% |
6.1% |
|
Gaming Revenue |
5,607 |
6,805 |
6,212 |
1,570 |
|
Growth % |
104.2% |
21.4% |
-8.7% |
-53.0% |
|
Gaming Operating Margin |
16.7% |
14.0% |
15.6% |
14.5% |
|
Embedded Revenue |
246 |
4,552 |
5,321 |
1,707 |
|
Growth % |
72.0% |
1750.4% |
16.9% |
-43.5% |
|
Embedded Operating Margin |
17.9% |
49.5% |
49.4% |
40.2% |
|
Weighted Average Operating Margin |
24.7% |
26.5% |
21.3% |
21.0% |
|
Unallocated Expenses |
-409 |
-4,979 |
-4,419 |
-2,069 |
|
Company Operating Margin |
22.20% |
5.36% |
1.77% |
2.70% |
Source: Company Data, Khaveen Investments
The Embedded segment is the clear leader in terms of profitability, with an operating margin of 40.2%, making it AMD’s most profitable segment in H1 2024. The Data Center segment follows with a strong operating margin of 24.8, the Gaming segment has a moderate margin of 14.5% while the Client segment shows the weakest performance with an operating margin of 6.1%.
Over the period analyzed, AMD’s weighted average segment operating margin increased in 2022 following the acquisition of Xilinx, as its Embedded segment revenue surged as well as its operating margin for the segment increased. There was also a notable growth in Data Center in 2022, with high operating margins. However, the company’s weighted average operating margins declined in 2023 by 5.2% as its Data Center and Client operating margins fell amid the downturn in the PC and server market which shipments declined by x% and x% respectively. In H1 2024, its weighted average margin further declined by 0.3%, as its Embedded segment, which commands the highest margin contracted sharply despite the improvement in Client and Data Center margins.
Therefore, the improvement in the company’s profitability margins in H1 was not due to stronger margins in higher growth segments, as the Embedded segment continues to have the best operating margins and declined substantially in H1 2024 while its Client and Data Center segments have lower margins than Embedded.
Moreover, the company’s operating margins had been impacted significantly due to the rise in unallocated expenses in 2022 following the acquisition of Xilinx the unallocated operating expenses “includes amortization of acquisition-related intangibles”. In H1 2024, its operating margin improved slightly to 2.7% as its unallocated expenses decreased in the period. Therefore, we further examine the company’s expense analysis below.
Expense Analysis
Company Data, Khaveen Investments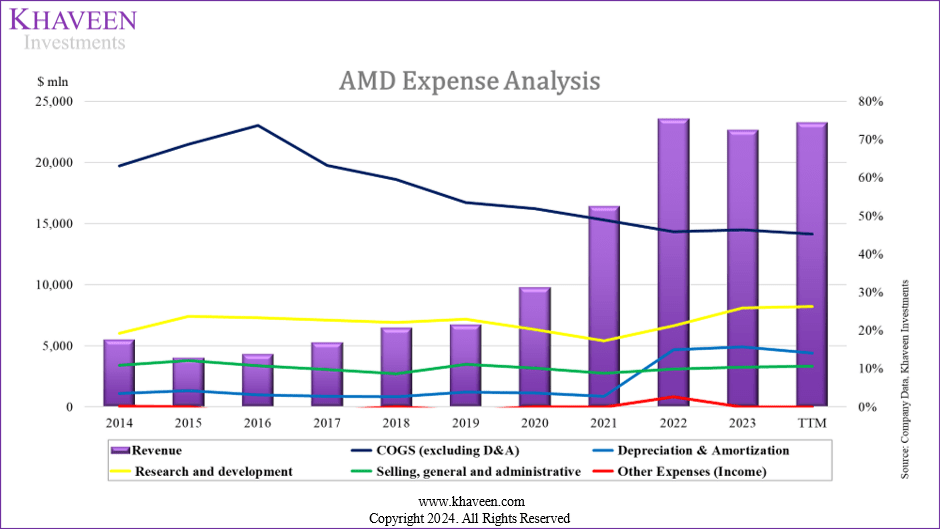
Based on the expense analysis chart of the company, the most significant increase in the company’s expenses following the acquisition of Xilinx in 2022 was the surge in its depreciation & amortization expense in 2022 which rose from 2.8% in 2021 of revenue to 14.9% in 2022. This was following the acquisition of Xilinx. Based on its annual report, the company recorded $3.5 bln of amortization of acquisition-related intangibles in 2022, which declined to $2.8 bln in 2023. On the other hand, R&D expenses % of revenue increased slightly from 17.3% to 21.2% following the Xilinx acquisition but had stabilized in TTM whereas COGS % of revenue continued to trend downwards indicating its improving scale as its revenues grew. Additionally, SG&A % of revenue has been stable over the period with an average of 10.3%. Finally, other expenses increased slightly in 2022 but have moderated beyond that and are insignificant to its expenses.
AMD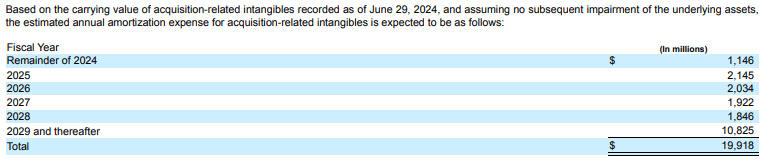
Based on the company’s latest quarterly report, the company provided an estimate of its amortization expenses to decrease through 2028. We updated our projections of the company’s margins from our previous analysis below.
|
Depreciation & Amortization Forecast ($ mln) |
2019 |
2020 |
2021 |
2022 |
2023 |
2024F |
2025F |
2026F |
2027F |
2028F |
|
Depreciation |
258 |
354 |
463 |
714 |
751 |
849 |
1,091 |
1,357 |
1,621 |
1,874 |
|
Amortization |
0 |
0 |
0 |
2,810 |
2,800 |
2,877 |
2,145 |
2,034 |
1,922 |
1,846 |
|
Total Depreciation & Amortization |
258 |
354 |
463 |
3,524 |
3,551 |
3,726 |
3,236 |
3,391 |
3,543 |
3,720 |
|
Revenue |
6,731 |
9,763 |
16,434 |
23,601 |
22,680 |
25,992 |
33,398 |
41,528 |
49,616 |
57,347 |
|
% Revenue |
3.8% |
3.6% |
2.8% |
14.9% |
15.7% |
14.3% |
9.7% |
8.2% |
7.1% |
6.5% |
|
% PPE |
18.0% |
12.6% |
12.1% |
6.7% |
6.9% |
7.6% |
6.8% |
7.4% |
8.1% |
9.1% |
Source: Company Data, Khaveen Investments
For the depreciation and amortization expenses, we forecasted it separately, for the depreciation expenses, we forecasted based on the company’s historical 10-year average depreciation % of revenue of 3.3% as it had been fairly stable over the period. Moreover, for the amortization expenses, in 2024, we calculated it based on its actual H1 amortization of intangible assets of $1.7 bln in addition to the company’s estimate for the remainder year of $1.2 bln based on the diagram mentioned above, as well as the rest of the forecast period through 2028 based on the diagram. In total, we forecasted the company’s depreciation & amortization expenses % of revenue to decrease from 15.7% in 2023 to 6.5% in 2028, which is still above its pre-Xilinx acquisition level of 2.8% in 2022. Nonetheless, our forecasts for depreciation & amortization indicate a 9.2% improvement in the company’s profitability margin.
Company Data, Khaveen Investments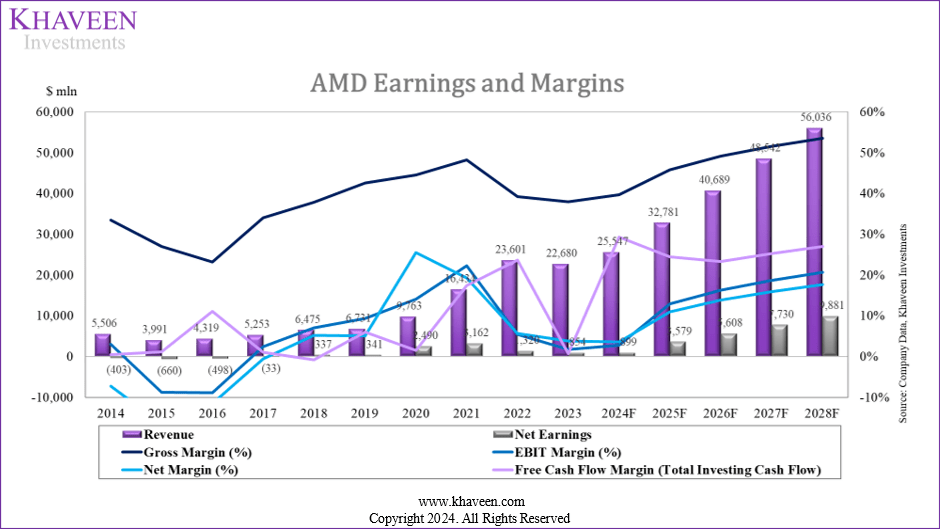
All in all, we expect the company’s margin to continue to recover and improve going forward. We modeled the company’s gross margin to increase to 53.5% by 2028 from 40.68% in 2023 primarily due to the expected moderation in depreciation & amortization expenses % of revenue from 15.7% in 2023 to 6.5% in 2028, an improvement of 9.2% as the company’s amortization expenses decline and its revenues grow each year following the acquisition. Moreover, we also projected the company’s COGS % of revenue to decline slightly from 45.2% to 39.88% in 2028, a 5.2% improvement. Additionally, we expect its SG&A and R&D expenses to remain stable and base these expenses on their 3-year and 5-year average respectively of 10.32% and 22.1% in 2025 onwards with 2024 based on TTM. In total, we forecast the company’s net margin to increase to 3.8% in 2024 and increase to 17.63% in 2028. However, this is still short of the company’s net margin achieved in 2020 of 25.5%. One of the reasons for this is due to the higher R&D % of revenue in our forecast period compared to 20.31% in 2020 following the Xilinx acquisition. Additionally, in 2020, AMD had a tax benefit of $1.2 bln (12% of revenue) which further boosted its net income. In 2023, the company’s FCF margin declined as the company had investments in market securities of $735 mln, as well as lower operating cash flows as net earnings declined by 35%.
Risk: Data Center Competition
One of the key risks we believe for AMD would be increasing data center competition from Nvidia and Intel. Based on our comparative analysis in our previous coverage of Nvidia, we highlighted Nvidia’s H100 NVL is overall better compared to AMD and Intel’s GPU, due to its higher transistors count (160 bln), higher FP16 Peak (3,958 Teraflops), which is almost 3x of AMD (1,307 Teraflops) and 5x of Intel (839 Teraflops) as well as its higher INT 8 (7,916 Teraflops) compare to AMD and Intel. Furthermore, Nvidia announced its B200 GPU back in March 2024 (expected release in H2 2024) and the new GPU is expected to offer “up to 20 petaflops of FP4 horsepower from its 208 billion transistors”, which is 25% higher than AMD’s MI325x transistors. Furthermore, Intel announced its new Gaudi 3 (expected in H2 2024) with 128 GB of HBMe2 memory capacity, 3.7 TB of memory bandwidth, and 96 MB of static random access memory (SRAM). We believe this is a key risk as the data center is the company’s largest segment with the highest growth outlook based on our forecasts.
Valuation
|
AMD Revenue Forecast ($ mln) |
2023 |
2024F |
2025F |
2026F |
|
Client (PC CPU) |
4,651 |
5,747 |
7,266 |
8,131 |
|
Growth % |
-25.0% |
23.6% |
26.4% |
11.9% |
|
Gaming Console Estimate |
5,466 |
2,658 |
3,134 |
3,695 |
|
Growth % |
-1.3% |
-51.4% |
17.9% |
17.9% |
|
Gaming (PC GPU) Estimate |
746 |
1,085 |
1,531 |
1,746 |
|
Growth % |
-41.1% |
45.3% |
41.2% |
14.0% |
|
Data Center CPU Estimate |
3,855 |
5,127 |
6,551 |
8,031 |
|
Growth % |
-6.69% |
32.99% |
27.79% |
22.58% |
|
Data Center GPU Estimate |
1,600 |
4,500 |
6,900 |
10,581 |
|
Growth % |
53.9% |
181.3% |
53.3% |
53.3% |
|
Data Center DPU Estimate |
275 |
344 |
423 |
511 |
|
Growth % |
26.9% |
24.9% |
22.9% |
20.9% |
|
Data Center FPGA Estimate |
766 |
766 |
878 |
1,006 |
|
Growth % |
16.89% |
0.00% |
14.60% |
14.60% |
|
Embedded |
5,321 |
5,321 |
6,098 |
6,988 |
|
Growth % |
16.89% |
0.00% |
14.60% |
14.60% |
|
Total |
22,680 |
25,547 |
32,781 |
40,689 |
|
Growth % |
-3.9% |
12.6% |
28.3% |
24.1% |
Source: Company Data, Khaveen Investments
We updated our revenue projections for the company taking account of our analysis regarding the gaming console market, whereby we applied our projections for its Gaming Console revenue estimates with a decline in 2024 followed by a recovery in 2025. Additionally, we forecast its Data Center GPU to increase at 87.7% CAGR from 2023 to 2026F. Moreover, we assumed its Embedded segment growth based on a flattish assumption as we see its Embedded segment growth recovering in the second half of the year. In total, we forecast the company’s total growth of 14.6% in 2024.
Khaveen Investments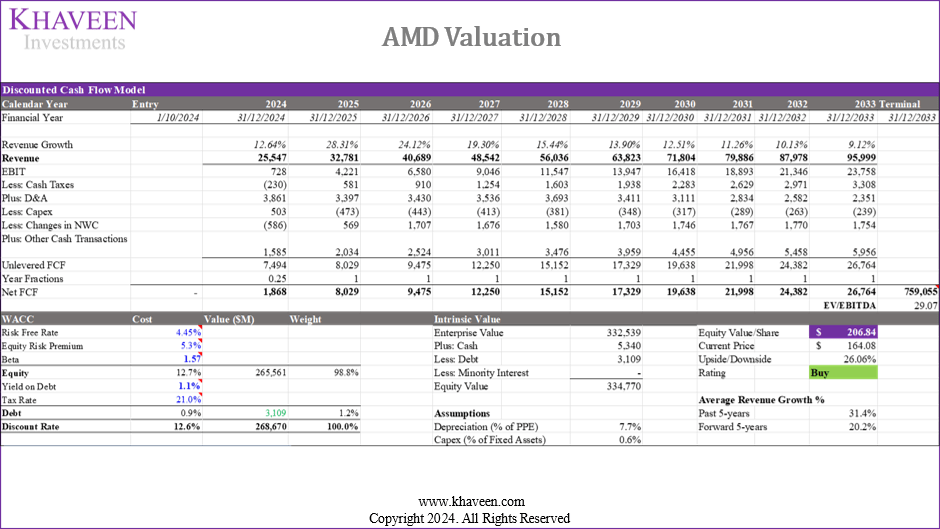
Based on a discount rate of 12.6%, and EV/EBITDA based on US-only chipmakers, we derived an upside of 26%.
Verdict
All in all, we still expect AMD to remain on track for its growth to improve throughout the year and going into 2025 despite its lagging performance in H1 with a 4% YoY revenue growth. We identified the reasons mainly attributed to a weak gaming console market and weakness in the FPGA market, impacting its Gaming and Embedded segment performance. In the gaming console market, despite structural factors we believe are affecting the market sales, we still expect the continued sales of the current generation of consoles which is only around 50% of the previous total cumulative sales of past console generations to bode well for AMD and updated our projections with a 17.9% growth rate in 2025. In Embedded, the company’s performance has been impacted by the overall FPGA market weakness which, we believe, is attributed to weakness, especially within the communications end market which struggled as the rollout of 5G infrastructure matures. Notwithstanding, the long-term growth outlook for industrial, automotive, communications and data center markets remains positive, which we expect to bode well for the FPGA market outlook, in which AMD has continued to maintain its market leadership with Xilinx. Finally, in terms of profitability, we see its net margins gradually rising to a projected 17.6% by 2028 as its scale grows and amortization expenses normalize following its Xilinx deal. Overall, we continue to rate the company as a Buy with a price target of $206.84 which is lower compared to our previous analysis of $228.93, mainly due to a lower growth projection in 2024 of 12.6% vs 26.9% previously.
Analyst’s Disclosure: I/we have a beneficial long position in the shares of AMD either through stock ownership, options, or other derivatives. I wrote this article myself, and it expresses my own opinions. I am not receiving compensation for it (other than from Seeking Alpha). I have no business relationship with any company whose stock is mentioned in this article.
No information in this publication is intended as investment, tax, accounting, or legal advice, or as an offer or solicitation to sell or buy. Material provided in this publication is for educational purposes only and was prepared from sources and data believed to be reliable, but we do not guarantee its accuracy or completeness.
Seeking Alpha’s Disclosure: Past performance is no guarantee of future results. No recommendation or advice is being given as to whether any investment is suitable for a particular investor. Any views or opinions expressed above may not reflect those of Seeking Alpha as a whole. Seeking Alpha is not a licensed securities dealer, broker or US investment adviser or investment bank. Our analysts are third party authors that include both professional investors and individual investors who may not be licensed or certified by any institute or regulatory body.