Summary:
- Advanced Micro Devices, Inc.’s price action shows positive technicals, with a bullish flag pattern having emerged in the last few months.
- Currently, AMD has retraced 39.39%, forming a full bull flag pattern, suggesting a continuation of the previous bullish trend.
- There is a healthy support level below, in case of fundamental changes to the stock that may negatively impact it.
- This article also reviews oscillators and momentum signals for AMD.
SlavkoSereda/iStock via Getty Images
Introduction
Advanced Micro Devices, Inc. (NASDAQ:AMD) is a semiconductor and computer hardware manufacturer in the US. They are the primary competitor with Intel for CPUs and the best contender Nvidia Corporation (NVDA) has in the GPU space.
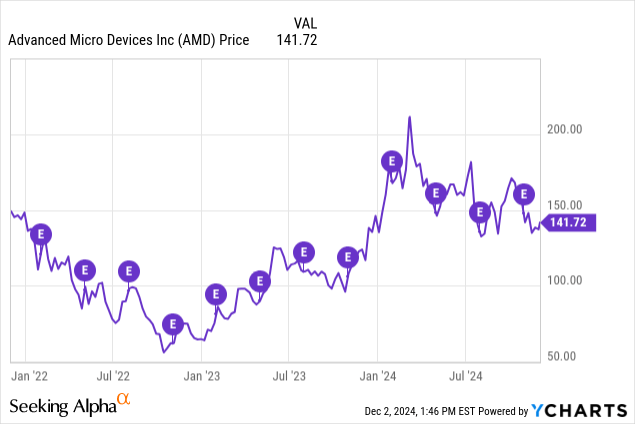
Recently, AMD has taken a tumble along with the rest of the semiconductor industry, now below its former heights even as the broad market presses on.
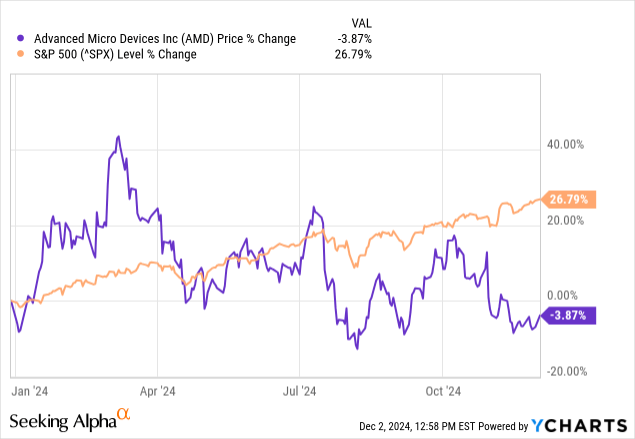
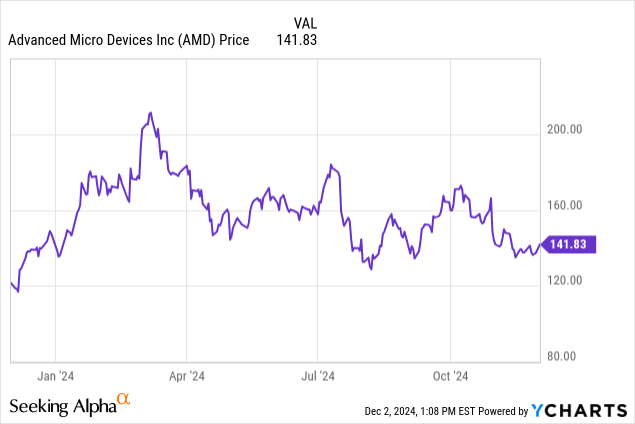
AMD’s chart does paint a rosier picture when you zoom out a bit more, to look at the one-year.
What Does the Chart Say?
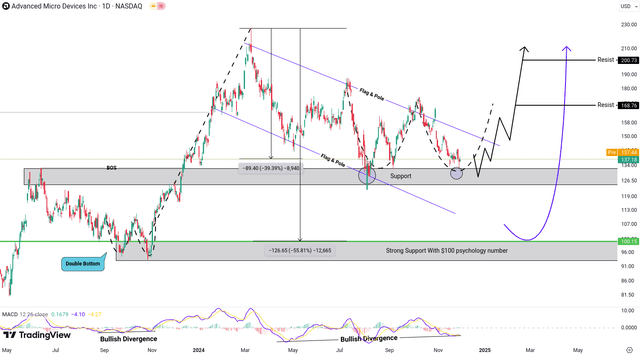
In its previous price action, AMD formed a “double bottom” pattern with bullish divergence, where the middle point was slightly lower than the two outer points, before initiating a bullish move.
This structure is now showing a similar setup, suggesting the potential for another bullish move.
Currently, AMD has retraced 39.39%, creating a bull flag pattern, which is typically considered a continuation pattern after an initial bullish move, with the prior move acting as the “pole.”
Note that this chart shows our pattern emerging over the course of months, making AMD potentially a great trade for the rest of 2024 and through Q1 next year, at the minimum.
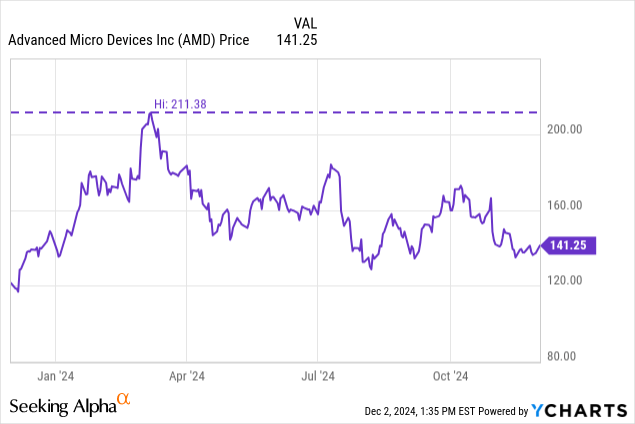
The price is now approaching the support zone of 133–124 again, where we can expect a potential bounce. That, or the formation of another double bottom with the same structure of divergence. If this leads to a repeat of that “W-like” pattern, AMD could target levels of 168 and 200, with 200 being a key psychological level that could act as resistance in the future. That would likely take through Q1 of next year to hit that target, but would be a boon for investors, as it would be close to a new high for AMD.
Solid Support Level
In the event of a negative catalyst that leads to heavy selling, the 100–93 zone presents a strong support area, especially with 100 being a psychological level. This zone also aligns with a 55% retracement, making it an attractive opportunity for long positions.
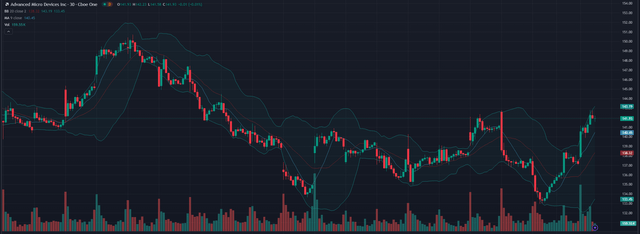
Looking at the one-month chart, we see a solid run-up toward this needed bullish action to finish the flag pattern above.
All we would need to see is a break-out above the resistance levels from 138-141, which we got today (12/2/24). The run may continue quickly from here.
Mixed Oscillators & Momentum
AMD has mixed signals around some prominent trading oscillators, reinforcing that we may see a “pole” emerge from our flag pattern. We’ll touch on the sell oscillators when we get to momentum next.
TradingView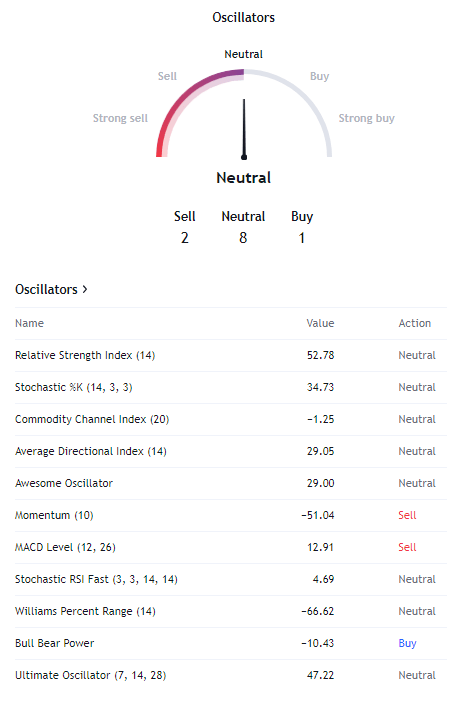
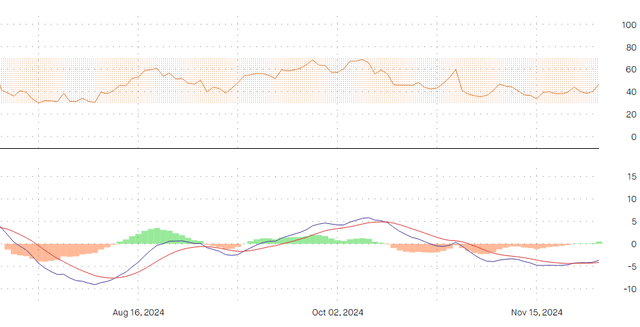
The one I watch the most is RSI and the MACD, which are both mixed for the stock currently. I am relying on momentum to help carry the stock, even if the short-term momentum isn’t there yet. The signal and MACD lines recently crossed us back into a bullish position, but it could end soon as it is very weak.
Below is the RSI, sitting around the mid-40s, and the MACD. This means that the stock is not oversold yet, meaning more selling could come.
This is the biggest boons to the pattern I see emerging, which is that AMD has very strong momentum behind it. While the 10d SMA and EMA are at sell signals, everything over 30 is at a buy. This means that the run-up may take a minute, while we establish enough momentum to break out.
What we do see with moving averages is very bullish, especially long-term, as we established in the first chart — we’re looking at months here, not days. It’s alright for now, in my opinion, if the short-term trading signals are still a sell. That means we may be getting in “early,” so to speak, ahead of the movement taking off.
TradingView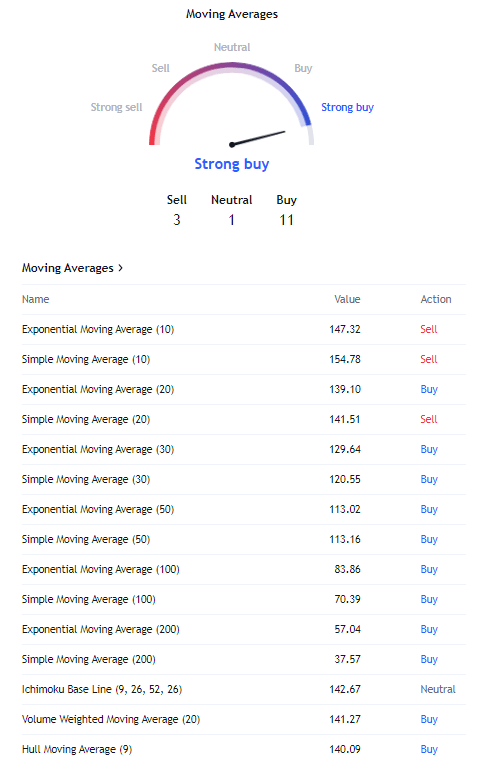
Fundamental Risks
The most major risk to this thesis, and I try to mention this in every TA article I write, is that a fundamental shift, especially an unforeseen one, could be catastrophic to my thesis. Momentum doesn’t matter if the company announces something very negative, as that momentum can stop dead in its tracks.
While I don’t anticipate AMD making any important announcements in the near future, their next earnings date is projected to be in late January, according to Seeking Alpha’s estimates. We should expect movement around then, as is normal for AMD.
Another risk is competition from its peers, as Intel just announced a big shakeup in leadership, and are launching competing GPUs in the coming weeks. This could create fundamental changes in AMD’s competitive landscape that aren’t accounted for in this model.
This is why it’s critical for us to have noted the support levels from earlier, as they can act like a crash pad for stocks experiencing negative catalysts. Currently, AMD’s crash pad is set up and ready if needed, though I don’t expect it to be (nobody ever does).
Suitability
It’s recommended not to place more than 2% of an equity portfolio in AMD, as it is still a highly valued semiconductor company and does have room to fall in its valuation. Conservative investors are recommended to avoid single stock tech exposure if possible.
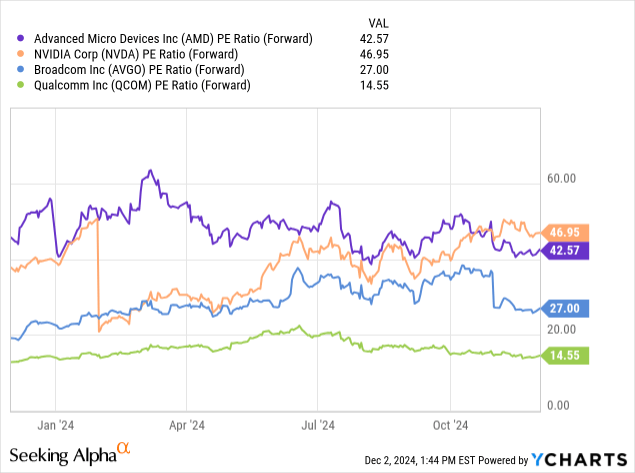
Until very recently, it even carried a higher forward PE than NVDA, but now they are neck-and-neck with NVDA coming out on top.
Conclusion
Currently, AMD stock is sitting at the edge of a bullish flag pattern, and even though it has some fundamental risks abound it, its technicals are aligned for bullish movement over the coming months. I am confident that AMD has a solid set up, but caution investors to keep their position sizing in line with their risk tolerance.
It’s often true that position sizing is more important than security selection.
Thanks for reading.
Analyst’s Disclosure: I/we have no stock, option or similar derivative position in any of the companies mentioned, and no plans to initiate any such positions within the next 72 hours. I wrote this article myself, and it expresses my own opinions. I am not receiving compensation for it (other than from Seeking Alpha). I have no business relationship with any company whose stock is mentioned in this article.
Seeking Alpha’s Disclosure: Past performance is no guarantee of future results. No recommendation or advice is being given as to whether any investment is suitable for a particular investor. Any views or opinions expressed above may not reflect those of Seeking Alpha as a whole. Seeking Alpha is not a licensed securities dealer, broker or US investment adviser or investment bank. Our analysts are third party authors that include both professional investors and individual investors who may not be licensed or certified by any institute or regulatory body.

