Summary:
- American Airlines gets buy rating as continued strong travel demand expected to fuel further revenue growth in near future, helping earnings.
- Although having a negative equity, the firm is showing signs of reducing its debt load, which could help reduce interest expenses in the future.
- The airline is #3 in US market share and has over 900 aircraft as well as many global destinations, fueling its brand presence and reputation.
- With its valuation mixed but trading well below its 1 year highs, it presents an interesting opportunity for upside potential.
- The future impact of a potential recession on travel spending has calmed down since recent analyses point to lower likelihood of a recession.
CHUYN
Thesis: Buy Rating Driven by Travel Demand Outlook and Lower Debt
Today’s investment idea picks up a tailwind as I fly into American Airlines (AA) stock, whose next earnings are out soon on Oct. 24th.
In my thesis today, I argue that this stock deserves a buy as it will continue to be propelled by strong travel demand while its fundamentals are improving as its debt continues declining and it continues to maintain the top 3 spot in US airline market share, while its stock price presents an opportunity as it trades well below its 1 year high and hovering around its moving average.
Over 900+ Aircraft in a Highly Competitive Market
The company has been on a fleet growth trajectory, and here is a closer look at their steady fleet growth since 2021, according to their own website factsheet:
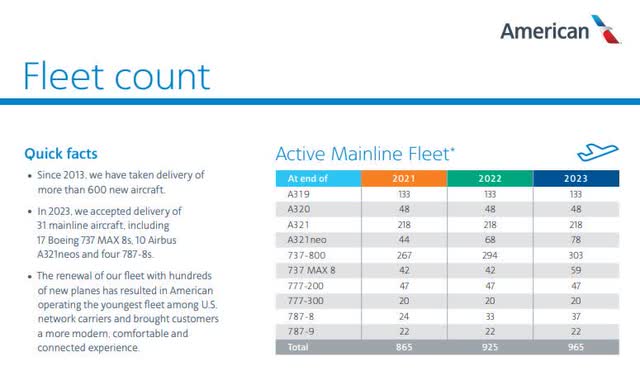
American Airlines – fleet (company website – multimedia section)
What comes to mind for this type of business and sector, who sits on large aircraft fleets it has to finance somehow and keep in the air as much as possible so as to not lose money, when thinking about weighted factors that could impact future share price and therefore my rating today, I considered the following forward-looking factors:
- Whether there is continued strong demand for air travel heading into 2025.
- Recession risk impacting consumer spending on non-essentials.
- Oil prices impacting an airline’s fuel costs.
- Fare competition and market share vs peers on similar routes.
- Business fundamentals like debt risk, profit margin and liquidity.
The 4 peers I picked today for some of my comparison worksheets are major US-based airlines: Delta Air Lines (DAL), Jetblue Airways (JBLU), Southwest Airlines (LUV), and United Airlines (UAL) while others include SkyWest (SKYW) and Alaska Airlines (ALK).
Q2 Results Saw Revenue Growth, but Lukewarm Forward Guidance
To briefly recap some highlights to call out from the Q2 results that came out in late July, according to its quarterly press release, the firm saw “highest ever quarterly revenue of $14.3B”, and ” reduced total debt by approximately $680 million.”
The part about reducing debt is important from a forward-looking view as it could lead to lower interest expenses going forward but also a more attractive balance sheet heading into 2025.
I want to also point out that, according to the income statement, the firm saw a YoY decline in earnings however it’s important to note that earnings trends are lumpy from looking at the data, since this type of business is impacting by seasonal swings in travel demand, which I expect to continue into the future as that is the nature of this business type, an issue also faced by hotels and cruise lines.
Looking ahead, the firm in their Q2 commentary was what I would call lukewarm about Q3 and full-year guidance:
Based on present demand trends, the current fuel price forecast and excluding the impact of special items, the company expects its third-quarter 2024 adjusted earnings per diluted share to be approximately breakeven. The company now expects its full-year 2024 adjusted earnings per diluted share to be between $0.70 and $1.30.
I think this forecast for positive full-year EPS should add further confidence to my buy conviction, and further signs the company is on a turnaround track heading into 2025.
Global Air Travel Demand Rises as Recession Likelihood Drops
Evidence shows that not only has airline travel made a strong recovery since the global pandemic era, but is expected to continue growing, which I think could contribute to future revenue growth at American Airlines.
A study I want to highlight was one done in August by global consulting firm Bain & Co, which argues the following in reference to 2024 (current year) demand, and the year is not over yet, but also forecasting towards 2030:
Annual air travel demand remains on track to surpass the 2019 total this year, as measured by revenue passenger kilometers (RPK).. By 2030, we anticipate global RPK will reach 11.4 trillion in our base scenario, which would be 136% of 2019 volume.
Researching additional data on this topic, I found the following chart from Statista which also shows a significant rebound in the number of flights since 2019 and a 2024 forecast on par with 2019 levels when flights saw a peak.
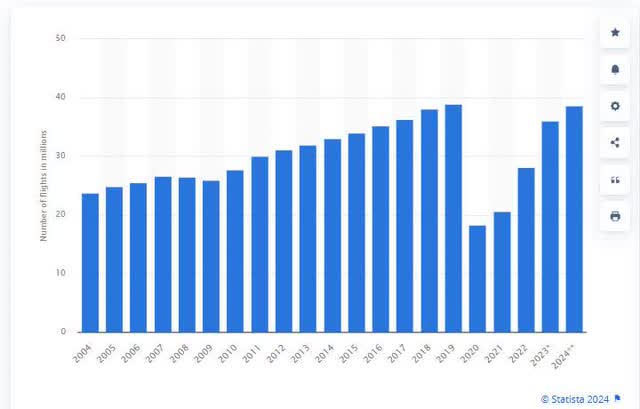
Statista – global airline flights (Statista)
Besides pandemics, the other factor I would mention as a potential future impact to this stock is a recession, which I think could curb consumer spending on non-essential travel, hurting this airline’s sales.
On the bright side, an Oct. 8th research piece from Goldman Sachs actually has called for a lower chance of a recession than previously assumed:
The likelihood of a US recession in the coming year has declined amid signs of a still-solid job market, according to Goldman Sachs Research.
Our economists say there’s a 15% chance of recession in the next 12 months, down from their earlier projection of 20%. That’s in line with the unconditional long-term average probability of 15%.
Here is how that looks in their chart:
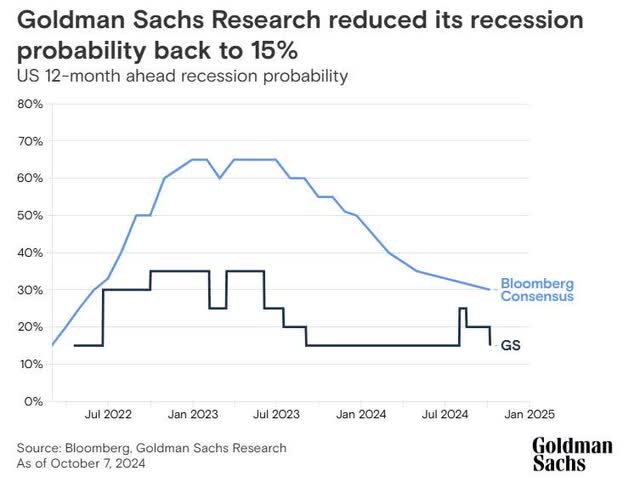
Goldman Sachs – recession likelihood (Goldman Sachs)
So, I think that this decreased likelihood of a recession coming should provide continued revenue tailwind to firms like American Airlines, as both consumers and businesses continue to spend on travel while the economy remains robust and customers continue to be confident.
Clinching Top 3 Spot in Domestic Market Share Among US Airlines
Earlier, I mentioned this firm operates in a highly competitive market, so in rating its stock I am looking at what kind of market share it has compared to peers, and as we head into the last quarter of 2024 and into 2025 I think this is crucial that the American Airlines brand can continue to command strong market share.
The good news to report is that, according to data from the US Bureau of Transportation Statistics, it appears that American is in the top 3 carriers in the US with a 17.4% market share, beaten only slightly by Southwest and Delta.
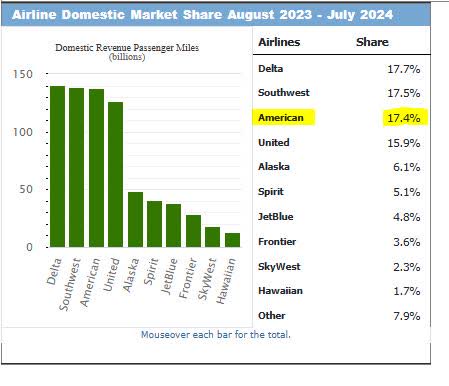
US airlines market share as of Jul 2024 (US Bureau of Transportation Statistics)
I think that this fact, along with its trend of continued fleet growth to over 900 aircraft and operating in multiple hubs / major US cities will continue to fuel future business sustainability and growth at American. Also, it’s worth pointing out that American has a much larger international route network than does Southwest, which largely serves the US market.
I think this also can help out with future international growth of routes for American, or adding capacity to existing global routes it already serves particularly the Asia market.
At the same time, because it is an airline with such a huge network it can also have a negative impact on travel, and therefore hurting its brand reputation, when it faces major delays due to storms or technical outages, as we saw this year.. so being able to quickly adapt and recover is also a sign of business sustainability and brand trust.
For example, I want to highlight a positive remark from the company in its Q2 commentary:
American quickly rebounded from the technology outage that impacted businesses worldwide on July 19. By that evening, its operation had fully recovered, and the airline delivered a 98.9% completion factor the next day — the best operational performance among U.S. network carriers.
This is a sign that this company can fly through the turbulence of these types of issues and come out intact and back in business again, perhaps even stronger. Having so many aircraft, routes, and alliance/codeshare partners in the OneWorld network it shares with brands like British Airways and many others means it has greater flexibility to rebook passengers if needed and have additional aircraft on hand, perhaps even multiple flights to one city in the same day.
I think this is important to the “future think” of an investor in this airline, in terms of thinking about the capacity of this airline to grow globally rather than just in the US market.
Net Income Margin Below Peer Average After Challenging Year for Profitability
As this stock is not a dividend payer like many of the firms I covered recently in banking and insurance, I will skip a dividend discussion and focus not on growing dividend income but growing capital gains with this stock, which depends on the share price appreciating in the future.
One metric I think could impact investors’ decision to own this stock is the company’s profit margin vs its peers.
Here is the chart I created to show that comparison, using peer data.
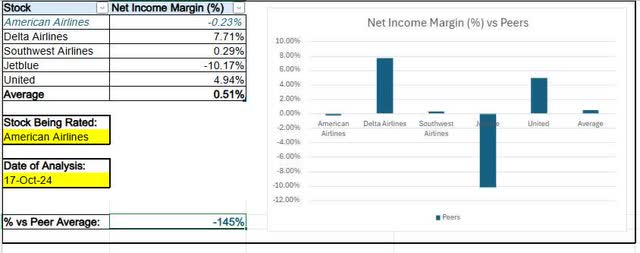
American Airlines – profit margin vs peers (author worksheet)
In my chart, it is evident that American has a negative profit margin of -0.23% and is 145% below the peer average, a negative factor I would consider as an investor.
A key driver of this is obviously the fact that American posted net losses in 2 of the last 4 quarters, and from its income statement we see that some factors impacting the bottom line in unprofitable quarters like March 2024 have been nearly $400MM in net interest expenses and over $2.4B in total “other” operating expenses.
Looking ahead, I expect interest expenses to cool off as the company has already stated it is reducing its debt, so this ought to help net income in subsequent quarters, and more attractive earnings reports can be good news for share prices.
Also, with September’s Fed rate cuts and CME Fedwatch predicting an over 90% chance of another rate cut in November, if we see a longer trend of lower interest rates I think it could benefit airlines looking ahead since they depend so much on debt financing, particularly an airline with over 900 planes!
Cheaper debt or refinancing certainly is a positive factor when looking ahead.
However, I believe the analyst consensus can also impact investor decisions and right now there are 16 downward revisions vs just 2 upward, and the fiscal Dec. 2024 EPS estimate calls for a YoY decline in the EPS, with EPS YoY growth not expected until fiscal year ending Dec. 2025.
Negative Debt to Equity Compared to Key Peers, but Overall Debt Reduction Continues
To get a sense of the debt picture for this firm, let’s look the debt-to-equity ratio vs peers, as shown below:
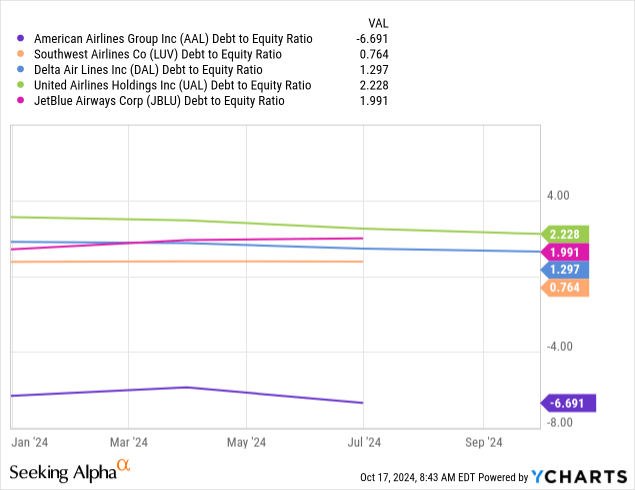
Unfortunately, American comes in last in this peer group with a negative debt-to-equity ratio of -6.69.
Correlating this with balance sheet data, we can see that the company continues to have negative equity in all of the last 8 quarters, and at the end of Q2 had $68.8B in total liabilities vs $64.1B in total assets.
At first glance, this fact could scare away many investors I think, but many companies actually have been able to operate with negative equity and in the case of American they saw positive free cashflow per share in Q2 in addition to “approximately $11.7B of total available liquidity, comprised of cash and short-term investments plus undrawn capacity under revolving credit facilities,” as they stated in their press release.
The future upside potential I see with this scenario is that they have already committed to paying down their debt, and in the same statement mentioned the firm is at “approximately 87% toward its goal of reducing total debt by $15B by the end of 2025.”
If that positive trend of debt paydown continues, I think it will benefit share prices in the future as more investors flock to a more attractive balance sheet. In addition, heading into the last quarter of 2024 with such strong liquidity should add confidence to the forward-thinking investors about the financial viability of this company.
Trading Near Moving Average as Valuation Picture is Mixed
Now that we have a better idea of some of the forward-relevant factors impacting this stock, let’s talk about what type of share price would be fair by looking at the current price chart and market valuation.
From the ychart below, you can see that the current share price has rebounded nicely from its summer lows and is hugging its 200-day SMA, but still far below its early spring highs reaching well past $14.
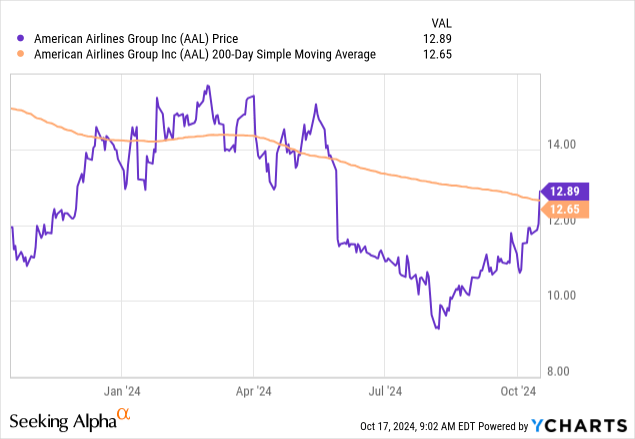
I think this chart presents plenty of upside potential for further price gains at this point, driven by the factors I mentioned earlier.
In terms of market valuation, using peer data I created the following worksheet which compares forward P/E ratios of this stock to its peer average:
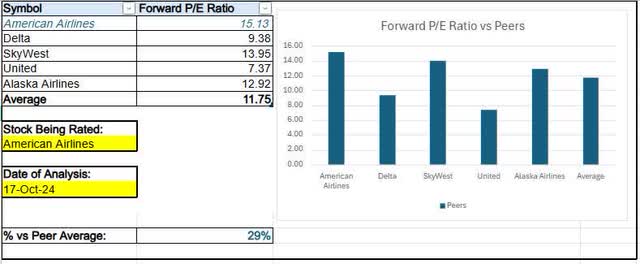
American Airlines – fwd PE ratio vs peers (author worksheet)
In this chart, we can see that American is 29% overvalued to this peer group average, in terms of the forward earnings multiple. Note: I used Skywest (SKYW) and Alaska Airlines (ALK) multiples in this peer group since Jetblue and Southwest either didn’t show forward P/E data or had a number that was too high of an outlier and would have skewed the average poorly.
I think this bullishness of the market on American is justified as continued travel demand should continue helping revenues while debt reductions should decrease interest expenses, potentially setting the stage for an extended period of improved earnings results.
In terms of comparing the forward EV/EBITDA to peers, take a look at this worksheet, using peer data again:
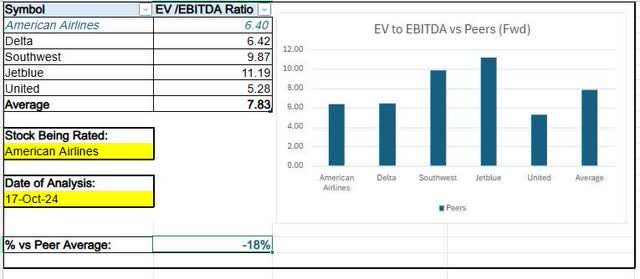
American Airlines – EV to EBITDA (author worksheet)
What this chart tells us is that compared to this peer group average of 7.83, American is 18% below the average and so therefore modestly undervalued on forward EV/EBITDA.
I think a combination of these two valuation metrics points to this stock having a mixed valuation picture.
Risk Chart: Key Downside Risk Driven by Seasonality of Travel Industry
To simplify thinking about upside and downside risks, I created the following risk chart which assigns weights to 4 different risks investors should think about, all of which I touched on in today’s article.

Risk chart – updated (author worksheet)
In this risk scenario, I gave the greatest risk weight to demand for air travel as that is what will drive future revenues, and since demand is shown to be strong I consider it an “upside” risk.
At the same time, the 2nd biggest risk to think about is the seasonal swings in this industry (holidays travel, summer travel, etc.) and how it can impact profitability in those quarters, so I called it a downside risk to consider.
Overall, it appears there is more weight coming from upside potential on this stock, than downside.
Wrap Up: Positive Factors Driving Bullish Conviction
To wrap up today’s article and summarize what I presented, the positives of American Airlines include strong travel demand expected to fuel future revenues, a trajectory of declining debt which should decrease future interest expenses, and strong liquidity which should provide confidence in the business viability of the company. In addition, the stock price is far below highs and trading near its moving average, having a mixed valuation picture, and despite not being a dividend payer I would consider this for a portfolio whose goal is longer-term capital gains.
Analyst’s Disclosure: I/we have no stock, option or similar derivative position in any of the companies mentioned, and no plans to initiate any such positions within the next 72 hours. I wrote this article myself, and it expresses my own opinions. I am not receiving compensation for it (other than from Seeking Alpha). I have no business relationship with any company whose stock is mentioned in this article.
Seeking Alpha’s Disclosure: Past performance is no guarantee of future results. No recommendation or advice is being given as to whether any investment is suitable for a particular investor. Any views or opinions expressed above may not reflect those of Seeking Alpha as a whole. Seeking Alpha is not a licensed securities dealer, broker or US investment adviser or investment bank. Our analysts are third party authors that include both professional investors and individual investors who may not be licensed or certified by any institute or regulatory body.
