Summary:
- American Airlines reported strong quarterly earnings but forecasted a significant decline in profitability for the next quarter.
- The stock price is currently pulling back from the resistance of a symmetrical triangle, potentially leading to further consolidation before an anticipated upward movement.
- Investors may consider acquiring the stock during the dip as a strategic long-term investment opportunity.
miglagoa
In the turbulent aviation sector, American Airlines Group Inc. (NASDAQ:AAL) managed to stride forward from a demanding period, boasting notable quarterly earnings. However, this triumph was fleeting as the company forecasted a significant decline in profitability for the subsequent quarter, instigating a drop in stock prices after the announcement. This article delivers a detailed technical evaluation of American Airlines’ stock price, identifying crucial points of interest for long-term investors. The observed trend indicates that the price appears to be pulling back from the resistance of the symmetrical triangle, potentially leading to further consolidation before an anticipated upward movement. Therefore, it could be prudent for investors to contemplate acquiring the stock during the ensuing dip as a strategic long-term investment.
The Uncertain Trajectory of American Airlines
The most recent quarterly earnings report showcases robust fiscal outcomes, as depicted in the following chart. The revenue for American Airlines during the second quarter surged to $14.05 billion, showing an improvement from the first quarter of 2023 which stood at $12.19 billion. The company’s quarterly revenue has reached all-time highs, and net income is following suit, currently standing at $1.338 billion. The chart below visualizes this upward trajectory. This uptick in American Airlines’ profitability provides an optimistic outlook for potential profitability in the future.
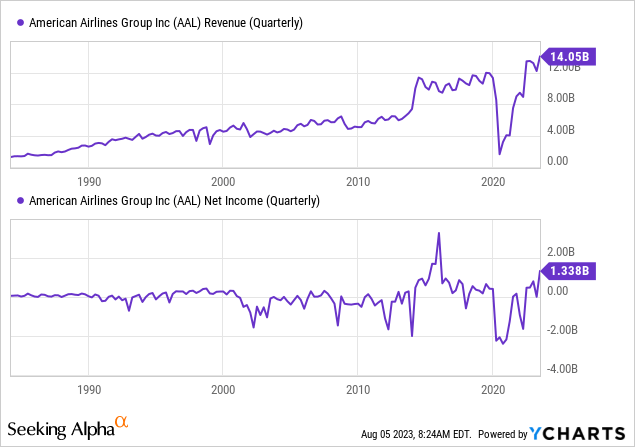
However, despite promising second-quarter results, the company expects a drop in unit revenue of 6.5% in the third quarter. This anticipated drop is attributed to the challenge of comparing against a strong performance from the same period in the previous year. Even though American Airlines’ management projected an optimistic outlook during the earnings call and emphasized increased earnings predictions for the full year, the updated projections did not match the scale of the company’s recent overperformance. This discrepancy indicates a somewhat less confident perspective regarding the company’s financial performance for the latter half of the year.
American Airlines, with the highest debt load in the U.S. airline industry, doesn’t have a lot of wiggle room. Even though the company has made headway in strengthening its balance sheet over the past two years, it still carries nearly $43 billion of debt and lease liabilities. Furthermore, several factors such as the resurgence of lower-fare airlines, rising fuel prices, and the costs associated with significant pilot salary raises could exert additional pressure on unit revenues and costs. These trends could further squeeze American Airlines’ margins, which historically have been less profitable than most of its competitors, as seen in the chart below.
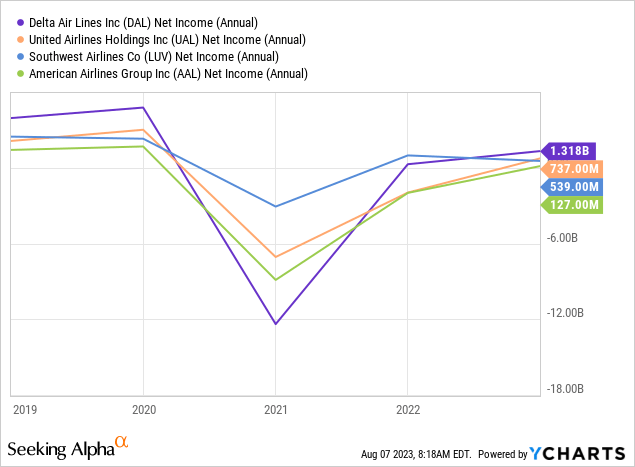
American Airlines currently stands on uncertain ground due to potential pressures on its profit margins. While the unsettled third-quarter projections could be a transient hurdle, they might also hint at more profound challenges within the company. Nevertheless, any such difficulties should ideally be ephemeral, given the positive long-term prospects for American Airlines. Any decline in the company’s stock value could thus present a golden opportunity for long-term investors to capitalize on.
A Closer Look at Market Trends and Investment Considerations
The chart below provides a long-term technical perspective on American Airlines, showcasing significant fluctuations within a specified range. In 2018, the stock reached an all-time high at $57.58, after which a steady decline set in. This downturn could be attributed to the formation of a double top at $53.25 and $57.58, which was decisively breached in 2019. This double top’s neckline could be viewed as a long-term inflection point, representing a crucial market level after the pattern was broken.
American Airlines Monthly Chart (stockcharts.com)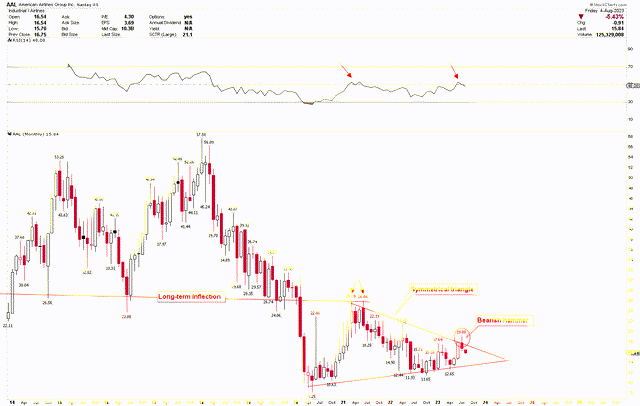
The dip in the stock value in 2018 was a result of a multitude of challenges that adversely affected American Airlines’ operations and financial standing. Factors like soaring fuel prices and heightened competition resulted in reduced fares and slimmer profit margins. Concurrent operational impediments such as disagreements with labor and numerous flight cancellations gradually eroded investor trust. These circumstances led to a steady decrease in the stock price throughout 2018, as investors grew increasingly concerned about the company’s ability to sustain profits in a challenging business climate.
The further drop in the stock price in 2020 was mainly attributable to the global COVID-19 pandemic. Travel restrictions, both domestic and international, significantly curtailed air travel demand, ravaging the entire airline industry. For American Airlines, this translated into a substantial revenue shortfall and hefty losses, causing a further dip in the stock price. The situation was compounded by the company’s substantial debt burden, which amplified its financial struggles during this challenging period.
During the last quarter of 2020, the stock witnessed a solid rebound, carrying its price back to the long-term inflection point, forming a double top at $26.29 and $26.04, as indicated by the red arrows. This price action resulted in another depreciation in the stock value, giving rise to a symmetrical triangle with the price currently hovering at its edge. The July 2023 monthly candle recorded a bearish hammer, achieving a high of $19.08. The price is now heading towards the symmetrical triangle’s support line, considered a promising buying zone for long-term investors. Additionally, with the RSI peaking at the mid-level 50, a market decline seems imminent.
The weekly chart below provides a clearer picture of American Airlines’ recent downward trend. It shows that the price has been dropping following the establishment of a resistance line. An impending support level between $9 and $14 coincides with the symmetrical triangle’s support, indicating a potentially profitable entry point for investors. The price action post-COVID-19 is represented by the red arc, signifying a bullish trend, and the price is currently in the process of stabilization.
American Airlines Weekly Chart (stockcharts.com)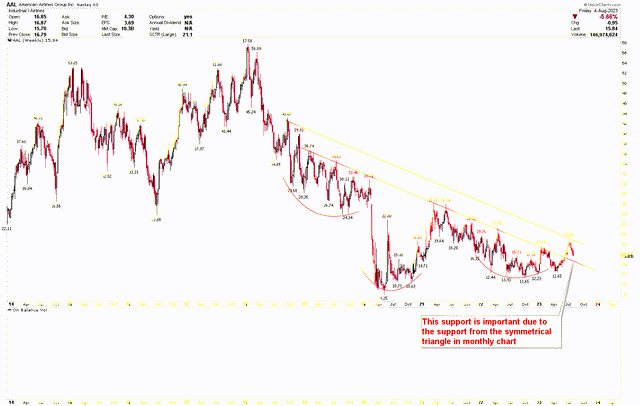
For a more granular understanding, the short-term daily chart highlights the current level as a robust support line, with the price persistently testing this level. Investors can monitor this market dip further to identify ideal entry points for long positions. The price range of $9 to $14 serves as a support zone for American Airlines. Investors could view this range as a viable consideration for potential long-term investments.
American Airlines Daily (stockcharts.com)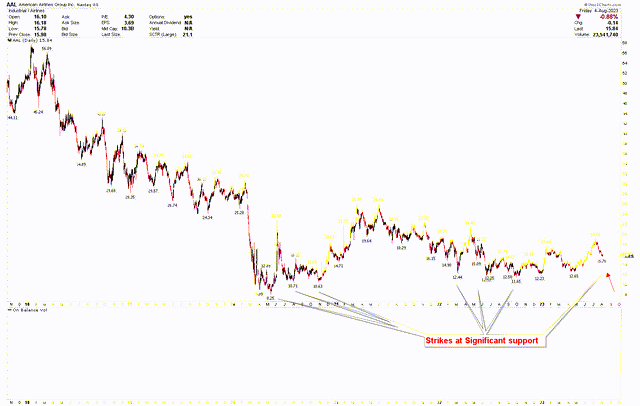
Market Risk
With the burden of an industry-leading debt load approximating $43 billion in debt and lease liabilities, American Airlines faces a precarious financial situation. This level of indebtedness can potentially stymie their capacity to procure additional financing, limiting their ability to seize future business opportunities or maintain smooth operations. The company’s financial health is further threatened by market dynamics such as the rise of lower-fare competitors, escalating fuel costs, and the heightened expenses linked to significant pilot salary increments. These factors could exert increased pressure on unit revenues and costs, thereby squeezing margins further.
The recovery that American Airlines has made from the widespread disruptions caused by the COVID-19 pandemic also stands on shaky ground. A resurgence of the virus or reintroduction of travel restrictions could plunge air travel demand once again, exerting further strain on the company’s revenue generation and overall financial performance.
From a technical perspective, the stock price continues to struggle within a downtrend. A decisive break above the long-term inflection point of $26 would be needed to trigger a bullish reversal. Conversely, a break below $10 could signal that the stock price is poised for further declines, adding to the bearish sentiment.
Conclusion
In conclusion, a blend of operational triumphs and looming financial uncertainties paint a complex picture. The company demonstrated commendable resilience by achieving record quarterly earnings. However, with a slight decline in profitability on the horizon, a significant debt load, and growing pressures in the market, its future trajectory appears uncertain.
The technical analysis reveals a stock price caught in a downward trend, with critical inflection points set to determine the company’s financial fate. Notably, investors are advised to be cautious, given that both market dynamics and internal factors could potentially squeeze American Airlines’ margins further. The stock price is displaying a bearish hammer pattern within the symmetrical triangle, suggesting potential further consolidation at this triangle’s boundary. However, any coming downturn in the stock price could lead it to the support level of the symmetrical triangle, ranging between $9 and $14. At this point, investors may buy the stock for a long-term outlook.
Analyst’s Disclosure: I/we have no stock, option or similar derivative position in any of the companies mentioned, and no plans to initiate any such positions within the next 72 hours. I wrote this article myself, and it expresses my own opinions. I am not receiving compensation for it (other than from Seeking Alpha). I have no business relationship with any company whose stock is mentioned in this article.
Seeking Alpha’s Disclosure: Past performance is no guarantee of future results. No recommendation or advice is being given as to whether any investment is suitable for a particular investor. Any views or opinions expressed above may not reflect those of Seeking Alpha as a whole. Seeking Alpha is not a licensed securities dealer, broker or US investment adviser or investment bank. Our analysts are third party authors that include both professional investors and individual investors who may not be licensed or certified by any institute or regulatory body.
