Summary:
- American Airlines has faced financial challenges since its merger with USAirways, resulting in low earnings and a tattered balance sheet.
- AAL’s net income was the lowest among the big three airlines, and its international system is the least profitable.
- The company is implementing strategies to improve its finances, including reducing sales costs and shifting bookings to lower-cost channels.
- American has just placed an order for new Airbus and Boeing narrowbody domestic jets as well as Embraer regional jets.
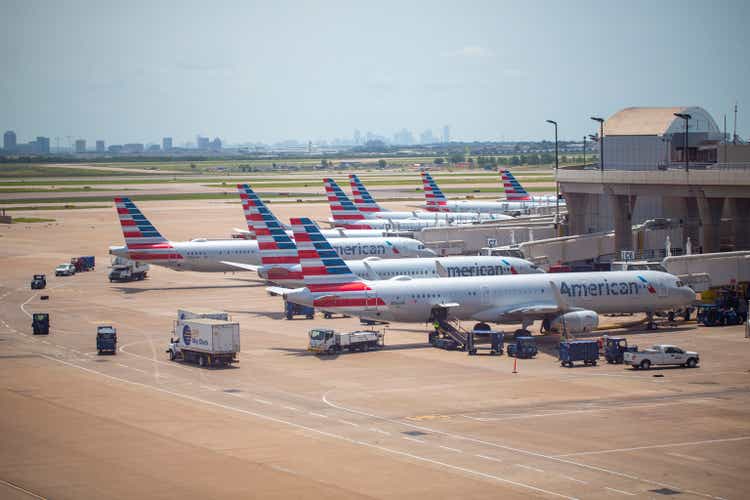
American Airlines operates its largest hub at DFW Airport
kameraworld
American Airlines (NASDAQ:AAL) has faced a difficult decade since its merger with USAirways. While airline mergers often do not produce the results that were intended and many of the objectives that were used to justify the merger – including being able to compete well with Delta and United which had already completed their mergers – have not materialized. AAL has been weighed down by low earnings and a tattered balance sheet driven by high fleet spending and stock buybacks prior to the pandemic, accentuated by the need to take on substantial debt during the pandemic. Nevertheless, AAL stock has shown very promising improvements particularly year to date. A look at the reasons for AAL’s financial underperformance especially before the Covid pandemic and strategies the company is taking to improve its finances are warranted to determine if there is reason for hope that AAL could see a continued uptick. First, let’s look at some key metrics for the industry and American’s competitors now that 2023 financials are available for all of the industry.
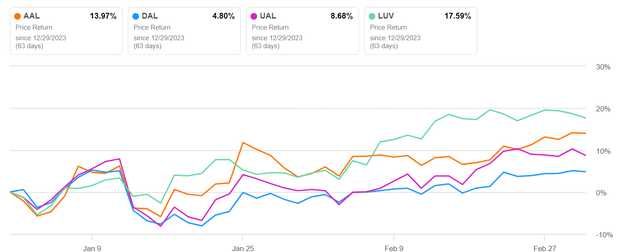
big 4 2024 YTD chart (Seeking Alpha)
An Industry Comparison by the Numbers
AAL’s net income was the lowest of the big 3 and they had a similar net income margin to Southwest (LUV) with both under 2% for 2023.
Delta’s (DAL) GAAP net income for 2023 was $4.609 billion compared to United’s (UAL) $2.618B, AAL’s $822 million and Southwest’s $498M.
DAL’s operating revenues totaled $58.048 billion compared to UAL’s $53.717B, AAL’s $52.788, and LUV’s $26.091B. A large part of the difference in operating revenues is DAL’s higher revenues from “other” revenue including its loyalty program, credit card partnership, and its aircraft maintenance services for other airlines.
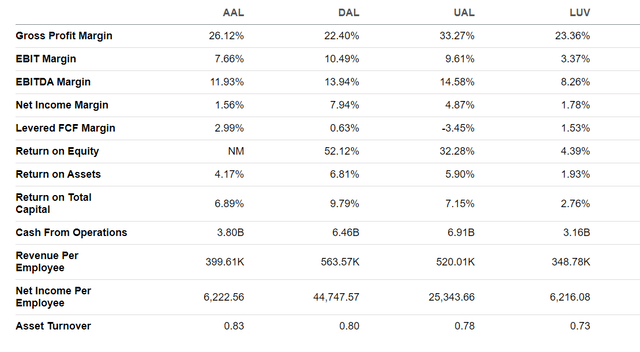
big 4 profitability 3mar2024 (Seeking Alpha)
Each of the big 3 get nearly identical amounts of passenger revenue with Delta just nudging American out for the most domestic passenger revenue, but both generated over $1 billion more domestic passenger revenue in Q4 2023 than United; United’s network is much more heavily skewed toward international travel. American nudges out Delta in cargo revenue but United generated twice as much cargo revenue as Delta – or $750 million more for the year.
Capacity in the airline industry is measured in available seat miles; one ASM is one seat flown for one mile. In 2023, United flew 291 billion ASMs, AAL flew 278 B, DAL flew 272 B, LUV flew 170 B ASMs. The big 3 all had load factors in the low 80s and within 2 points of each other.
Revenues and costs per seat mile provide insights into how each airline makes its money. One word of caution is necessary, though. Costs and revenues are dependent on the length of flight. The amount of revenue and costs per seat mile decrease with longer stage lengths. AAL operates the shortest average stage lengths of the big 3. In 2023, Delta led the industry in total revenue per seat miles (TRASM) at $0.1931 while American generated $0.1901 and UAL chalked up $0.1844. If we look solely at passenger revenues, Delta still led with $0.1798/mile, UAL recorded $0.1747 and AAL logged in at $0.1684. LUV was at the bottom of the big 4 with $0.1532 which reflects not only its low-cost model but its larger average aircraft size which is more efficient from a cost standpoint, but it also means they carry more passengers per flight and thus have less opportunity for higher revenue than the big 3.
On the cost side, each of the big 3 spent very similar amounts on salary and benefits for their employees as well as those of their wholly owned subsidiaries in 2023.
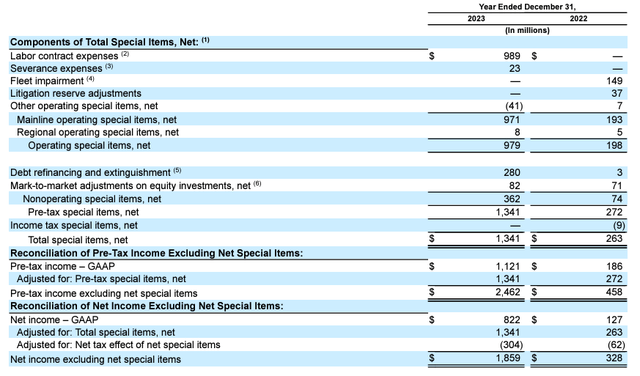
AAL special items YE2023 (aa.com)
In 2023, United burned 4.2 billion gallons of jet fuel, American burned 4.1B gallons, and Delta burned 3.9B gallons of jet fuel.
In 2023, Delta paid an average of $2.82/gallon of jet fuel, net of its refinery benefit. Southwest hedges fuel and paid $2.89/gallon. Neither American or United hedge or have a refinery benefit; American paid $2.96/gallon and United paid the highest of the big 4 at $3.01/gallon. In total fuel cost, AAL paid $12.251 billion, DAL paid $11.069B, and UAL paid $12.651 billion.
American’s capex in 2023 was below both Delta and United. UAL spent just under $8 billion on capex in 2023, DAL spent $5.3B, LUV spent $3.5B (a significant portion of which was for IT systems), and AAL spent $2.6 billion.
In 2023, DAL spent $834 million on interest expense. American spent a net of $1.5 B on interest expense. AAL’s fleet spending is expected to be lower than DAL, UAL or LUV over the next few years as AAL continues to pay down debt and also generates free cash. LUV is unique among U.S. airlines in having no net debt so it made $324 million from its cash on hand in 2023. UAL was the outlier among the big 4 in burning cash through its aggressive fleet spending which was by far the largest among U.S. airlines.
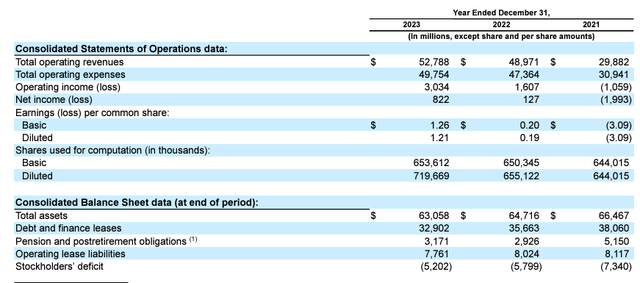
AAL summary financial data YE 2023 (AA.com)
Identification of AAL’s problems
American has struggled to generate industry-comparable levels of profitability for almost two decades. American (under AMR) was the last of the big 3 (or their legacy predecessors) to file for Chapter 11 bankruptcy restructuring post 9/11 which led to high costs after its largely unsuccessful out-of-court restructuring in the early years after 9/11. With its 2013 merger with USAirways which resulted in the formation of AAL, American spent years integrating the two airlines’ networks, assets and workforces, a process that was really only completed during the pandemic. AAL’s stock languished and the company bought back billions of dollars of stock despite little positive movement. The combination of fleet spending and stock buybacks left AAL poorly positioned to face the cash-sapping pandemic which resulted in even more debt.
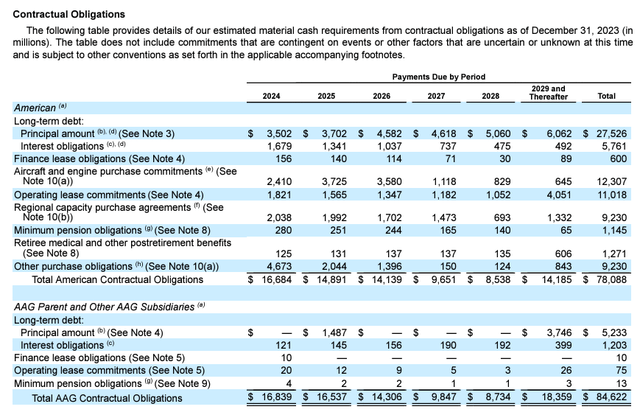
AAL contractual obligations 31Dec2023 (aa.com)
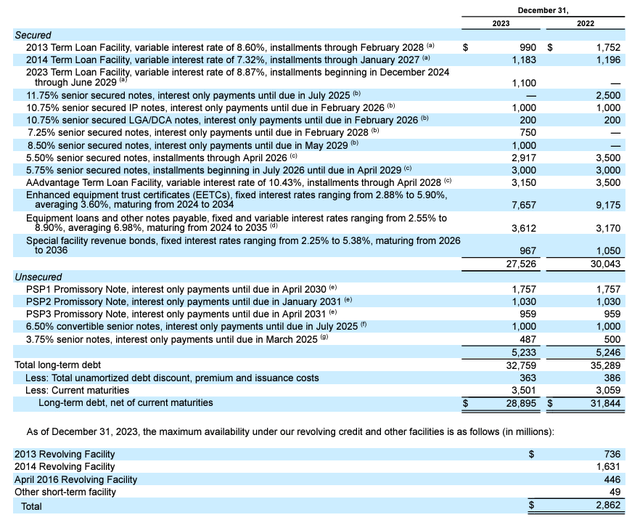
AAL debt breakdown YE2023 (aa.com)
During the Covid era, AAL grounded a number of its older widebodies leaving its long haul international fleet of just Boeing (BA) 787s and 777s. AAL’s international widebody fleet is about two-thirds the size of DAL’s and half the size of UAL’s. As international travel rebounded, American has had a limited number of widebodies for deployment although it still has not turned its international network back to levels of profitability comparable to its domestic system according to DOT data. For the first three quarters of 2023, AAL lost money flying both the Atlantic and Pacific, offset by profits on its network in Latin America, the largest of the big 3. AAL’s international system is the least profitable of the big 3 while DAL’s is the most profitable.
AAL shifted a considerable amount of capacity during the pandemic to its southern U.S. hubs, reflecting demographic and economic changes in the U.S. Of the big 3, American’s route system is the most “southern” with its largest hub at Dallas/Ft. Worth airport, its second largest at Charlotte (one of the top 5 largest hubs in the U.S. in terms of flights even though Charlotte is a medium-sized city), a predominantly domestic hub in Phoenix, and its large Latin American hub at Miami. AAL also has a hub at Washington National Airport and hubs at both New York’s LaGuardia and JFK airports, the latter two of which are competitive with and smaller than Delta’s hubs at those same two airports. AAL also has a hub at Los Angeles, as do each of the big 4 as well as Philadelphia and Chicago O’Hare, each of which were significantly downsized during the pandemic and the amount of pre-Covid capacity there has not been restored.
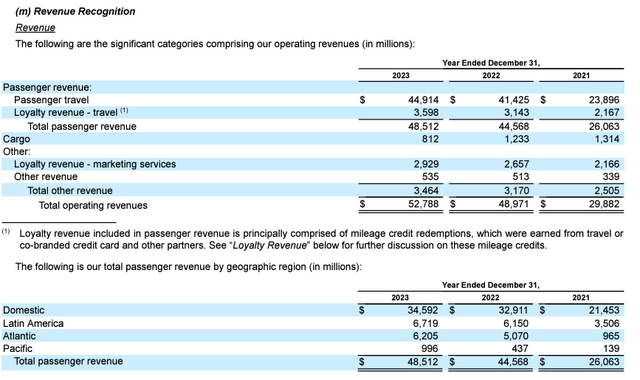
AAL revenue recognition YE2023 (AA.com)
American’s revenue strategies reflect the reality that it does not get the amount of revenue that Delta and United do per seat mile. It has largely shifted large parts of its network to hubs where it is the dominant carrier and where it has stronger control of pricing and can win customers. DOT data shows that AA is about mid-pack among the big 4 carriers in operational performance metrics. Its on-time performance significantly improved in 2023, as did most of the industry.
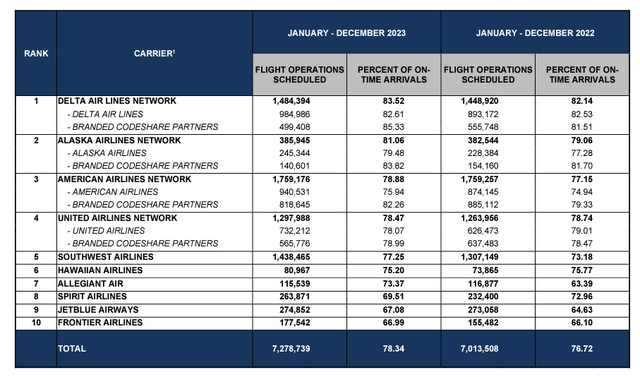
US airline on-time 2023 (U.S. DOT Air Travel Consumer Report)
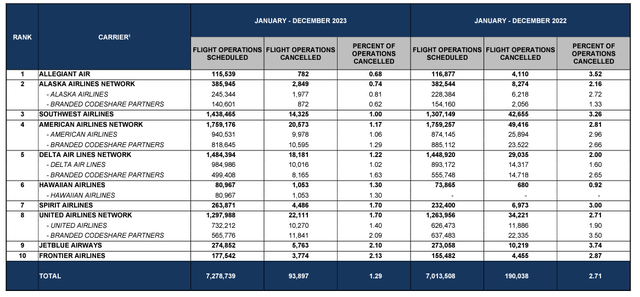
US airline cancellations 2023 (U.S. DOT ATCR)
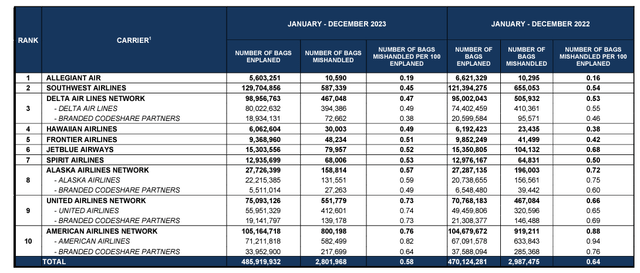
U.S. airline baggage mishandling (U.S. DOT ATCR)
Shifting to Lower Cost Sales Channels
American’s revenue challenge and the resulting network strategies have resulted in a series of moves by the company to reduce its sales costs. First, AAL significantly reduced the number of its sales personnel in a departure from practices by its legacy carrier peers. The legacy carriers have long generated corporate revenue as a result of winning corporate contracts which are themselves most often tied to the level of service a carrier offers in a market. American execs have said frequently over the past few years that their network and schedule is their product – in essence saying that when they are able to have the largest schedule in a market, they are able to carry a disproportionate share of traffic. History would show that is true; airlines have long received disproportionate market shares in their hub markets since the “excess” number of flights that exist above what would be needed to serve the local market provides a revenue advantage which is larger than any product-specific advantage. The fact that Southwest, a low-cost carrier, successfully uses the same strategy in its “hubs” is proof that airline service is in many ways more like a commodity than a differentiated product.
The problem for AAL’s schedule-focused strategy is that no airline has hubs in every market that matters and by focusing on a schedule-focused sales strategy, an airline is certain to cede certain markets to other carriers and that is what has happened to American in New York City, Boston, Chicago and Los Angeles. In addition, many large markets, like New York City and Los Angeles are and always will be highly competitive. Because many corporate contracts cover multiple locations for companies, and that is magnified by the number of employees that work from home even partially, legacy carriers have to compete with each other for corporate revenue in areas where each carrier is not as strong. While some carriers have focused on product differentiation as a means to win corporate business, AAL is focusing on a schedule-driven commodity focused strategy which requires fewer sales people.
In addition, AAL is leading the U.S. airline in pushing the booking process through new technology systems which are essentially lower cost channels through which it has greater control over the booking process including the ability to maximize revenue. Low-cost carriers such as Southwest have long championed booking directly on their own website, one of the most cost-efficient sales systems for most companies. The modern airline industry is built around computerized reservations systems and American was one of the pioneers in that field. Those systems serve as intermediaries and basically distribute and then process sales for an airline. With the new systems that American is pushing, the airline essentially controls the process and other parts of the system are essentially “pipes” through which the process is channeled between the customer and the airline.
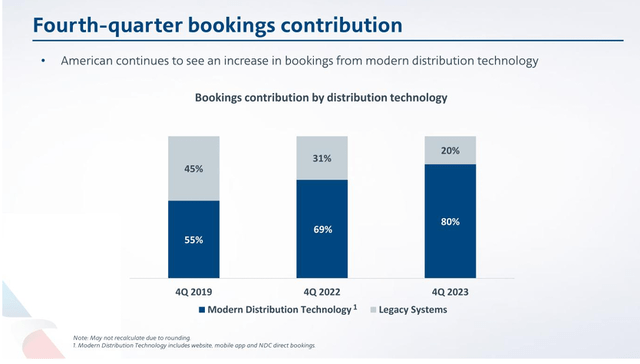
AAL new distribution technology (AA.com)
AAL has made a corporate strategy to increase its share of bookings through new distribution channels. While all of the major U.S. airlines have created a process to incentivize bookings directly through their own websites, especially for small and medium sized businesses, American is most aggressively embracing new distribution technology of the legacy airlines that primarily sell seats through legacy electronic systems. Recently, AAL has announced that certain low fares will not be distributed via legacy methods while also only providing loyalty program credits if bookings are made through AAL’s website or new technology systems. Shifting bookings to new systems has moved from being an incentive for the use of more efficient technology to blocking bookings and benefits that don’t comply with American’s preferred channels. While American has not said how these changes will improve its bottom line, it is certain to reduce its selling expenses which checked in for 2023 at just under $1.8 billion or about 3% of its total revenues. Given that AAL’s net profit for 2023 was half that amount, any cost reductions should drop directly to the bottom line.
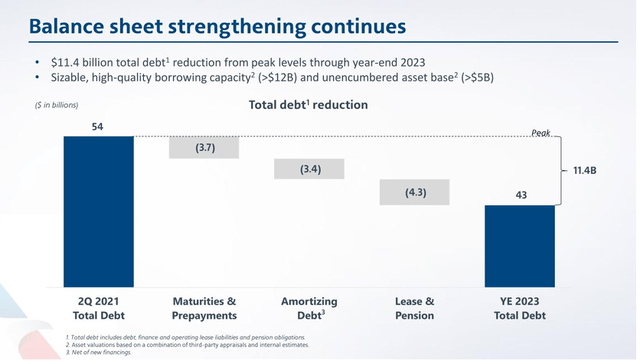
AAL balance sheet improvements YE2023 (aa.com)
A Relatively Young Fleet
American spent tens of billions of dollars on new aircraft between the late 2010s and the Covid pandemic. Prior to its Chapter 11 filing in 2011, American’s fleet was old and inefficient because it spent very little on fleet replacement in the decade after 9/11. It swung in the complete opposite direction and has acquired over 600 mainline aircraft in the past decade. While a great deal of its fleet replacement came before the most fuel efficient narrowbodies (the A320NEO and Boeing 737MAX families), AAL has a young and modern fleet which has allowed it to reduce its fleet spending from Covid through at least 2026.
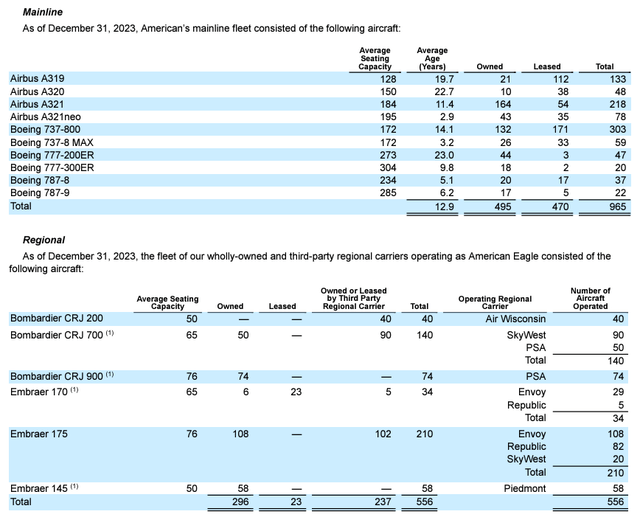
AAL fleet 31Dec2023 (AA.com)
American execs have said for several years that AAL needed to get in line for new narrowbody (single aisle domestic) aircraft because the demand for new aircraft has made delivery slots scarce at both Airbus and Boeing. AAL’s mainline order book consisted of 180 aircraft at December 31, 2023 and will largely be delivered by 2026. Its current domestic fleet is a mix of Airbus and Boeing aircraft while its widebody international fleet is entirely composed of Boeing models. Its aircraft spend (CAPEX) is under $4 billion over the next three years, in line with Delta and Southwest, but one-third of what United plans to spend in some years. AAL has the capacity to grow at a sustainable rate while replacing its oldest aircraft.
American just announced an order for 85 A321NEO and 85 B737 MAX 10 aircraft, joining Delta and United as customers for Boeing’s largest 737.
American also announced an order for 90 Embraer E175 large regional jets as part of its restructuring of its regional jet business which will involve ending 50 passenger regional jet service by the end of the decade.
The order includes additional options and conversions of some existing MAX orders to the larger – 10 model.

AAL aircraft commitments 31Dec2023 (aa.com)

AAL FCF YE 2023 (aa.com)
An Improving Balance Sheet
AAL’s balance sheet has long been its Achilles’ heel; low profitability has made it impossible for the company to address its balance sheet especially as long as fleet spending remained high. Former AAL execs spent billions of dollars on stock buybacks which did nothing to stop the drop in AAL stock. AAL stock has begun to tick up over the past three months, reversing an almost ten year long decline. The company’s ability to improve its balance sheet addresses one of the biggest concerns among airline investors.
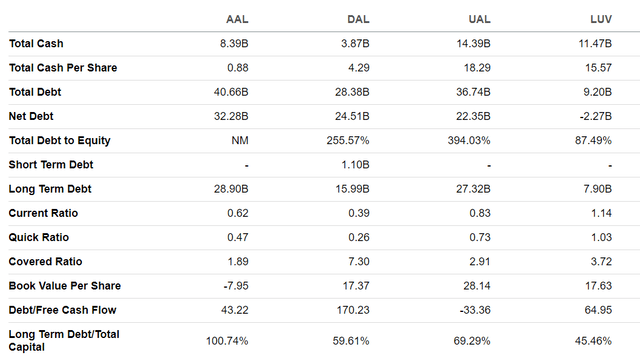
big 4 balance sheet 3Mar2024 (Seeking Alpha)
And the weak balance sheet and earnings leave AAL as one of the few airlines with no stockholder equity; in fact, AAL ended 2023 with a stockholder deficit of $5.2 billion in 2023. The good news is that number is being whittled down despite AAL’s low earnings in 2023.

big 4 cash flow 3mar2024 (Seeking Alpha)
The midpoint of AAL’s operating margin guidance for 2024 is in line with what it reported for 2023 excluding specials. Therefore, AAL is likely to be a lower margin airline relative to DAL and UAL but likely above the low-cost carrier sector including perhaps Southwest which has significant overlap with American in many of its major southern markets. AAL stock price improvement is likely to be driven by macroeconomic factors and by improvements in its balance sheet rather than by growth in earnings.

big 4 ratings 3Mar2024 (Seeking Alpha)
AAL is addressing its revenue and cost performance which will bear fruit in 2025 and beyond while continuing to currently address its balance sheet and work down its stockholder deficit. All of these actions combined warrant a buy rating for AAL.
Analyst’s Disclosure: I/we have no stock, option or similar derivative position in any of the companies mentioned, and no plans to initiate any such positions within the next 72 hours. I wrote this article myself, and it expresses my own opinions. I am not receiving compensation for it (other than from Seeking Alpha). I have no business relationship with any company whose stock is mentioned in this article.
Seeking Alpha’s Disclosure: Past performance is no guarantee of future results. No recommendation or advice is being given as to whether any investment is suitable for a particular investor. Any views or opinions expressed above may not reflect those of Seeking Alpha as a whole. Seeking Alpha is not a licensed securities dealer, broker or US investment adviser or investment bank. Our analysts are third party authors that include both professional investors and individual investors who may not be licensed or certified by any institute or regulatory body.
