Summary:
- Why I decided to revisit the Apple-as-a-semiconductor-company calculations.
- Estimating equivalent chip prices for the A series and M series chips.
- Estimating unit volumes for Apple hardware products post fiscal 2018.
- Combining the unit volume estimates with chip cost and some parametric excursions.
- Investor takeaways: Apple’s new semiconductor paradigm is the quiet revolution.
Shahid Jamil
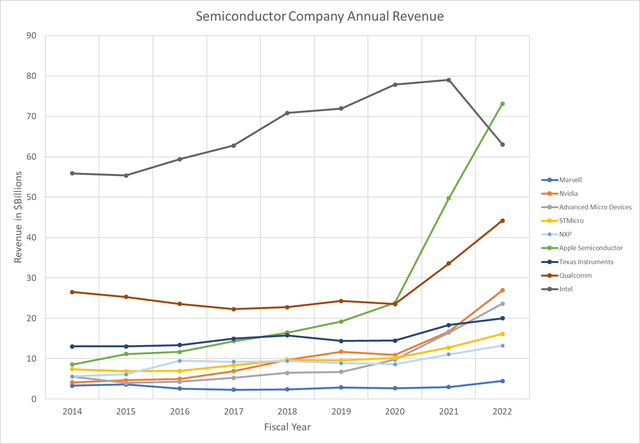
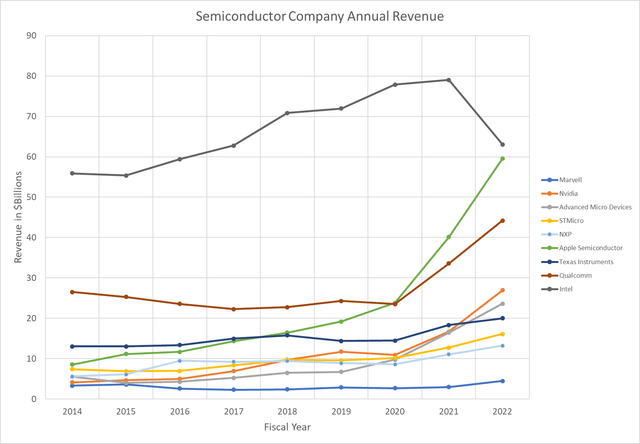
In 2015 I wrote an article titled Apple: Becoming A Semiconductor Powerhouse. In the article, I pointed out that Apple’s (NASDAQ:AAPL) product volumes for iOS devices were large enough that the value of Apple’s custom processors inside them made the company one of the largest of the “fabless” semiconductor companies. In this article, I offer a new set of calculations that include Apple A and M series systems on chip (SOCs) through fiscal 2022. A conservative estimate of the value of Apple semiconductors for its fiscal 2022 puts it on par with Intel’s (INTC) fiscal 2022 company revenue.
Why I decided to revisit the Apple-as-a-semiconductor company calculations
Since 2015, I had revised and refined my model of Apple’s semiconductor value based on Apple’s reported unit volumes for its major product categories such as iPhone, iPad, Mac, and Watch. Multiplying the unit volumes by an estimated SOC unit cost gave a reasonable estimate of the value of Apple semiconductors.
For this estimate, I ignored smaller Apple semiconductors in products like AirPods, as well as low volume products such as Apple TV. I felt that focusing on Apple’s custom SOCs for major products would capture most of the value of Apple semiconductors.
But I stopped after Apple’s fiscal 2018 when it stopped reporting sales unit volumes. Without the unit volume data from Apple, I felt it was just too hard to estimate the number of SOCs Apple was producing through foundry partners such as TSMC (TSM).
The recent news, from no less a personage than Qualcomm (QCOM) CEO Cristiano Amon that Apple would begin building its own modems in 2024 got me thinking about revisiting the Apple semiconductor calculations.
Qualcomm CEO Amon interview with Joanna Stern at 2023 Mobile World Congress. Source: Twitter.
The Apple 5G modem is likely to be incorporated directly into the SOC, as other manufacturers such as Samsung (OTCPK:SSNLF) already do. This will likely lower Apple’s total chip cost, since they will no longer be buying modems from Qualcomm. And it will be a stepwise increase in the value of Apple semiconductors.
Also, as I began reviewing Apple A series developments since the A7 released in September 2013 with the iPhone 5s, it was apparent that the value of Apple SOCs has increased dramatically. The A7 was fabricated on Samsung’s 28 nm process and had one billion transistors in a die of 102 sq. mm. The A15 that equipped the iPhone 13 series was fabricated on TSMC’s 5 nm process and has 15 billion transistors in a die of 107 sq. mm.
The complexity of the A15 certainly scales with the transistor count, but does that mean that it’s 15 times more expensive than the A7? Probably not. The main reason is that as manufacturers like TSMC have introduced new process nodes, the cost per transistor has generally come down.
But it was clear that Apple’s latest A series SOCs, along with the larger and even more complex M series SOCs for Mac had to be much higher value than what was typically assumed for the A7 back in 2013. So I decided to try to fill in the many gaps in our knowledge of Apple unit sales and semiconductor costs to arrive at a new model of Apple semiconductors value.
Estimating equivalent chip prices for the A series and M series chips
With each node, wafer costs get higher. But as long as the increase in number of transistors per wafer (or transistor density) is greater than the wafer cost increase, the cost per transistor declines.
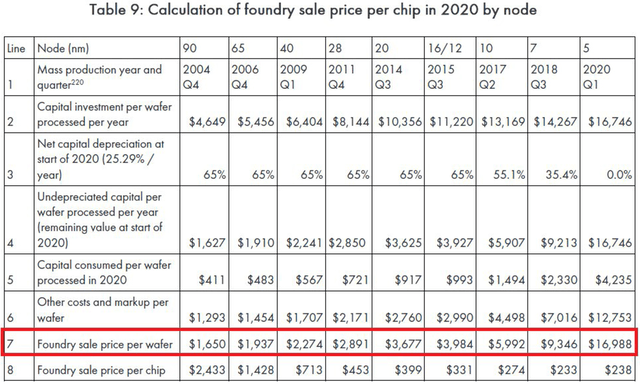
This was true up until TSMC’s N5 (5 nm) node, which began production in 2020, and which Apple uses extensively for its current SOCs. According to Anton Shilov writing in Tom’s Hardware, the wafer cost for N5 jumped dramatically:
Shilov was writing in the first year of the N5 node, and I expect that N5 wafer costs did decline in subsequent years. But it does appear that at least for 2020, cost per transistor actually increased for N5 wafers compared to N7. This is likely due to the more extensive use of Extreme UV lithography for N5.
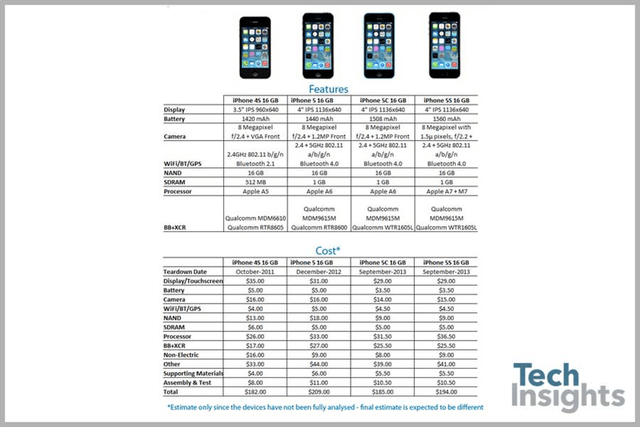
Using transistor increases combined with cost per transistor based on Shilov’s wafer price data, I arrived at scaled prices for Apple A and M series SOC using the A7 as a point of departure. The price for the A7 is taken from a Bill of Materials estimate supplied by Tech Insights:
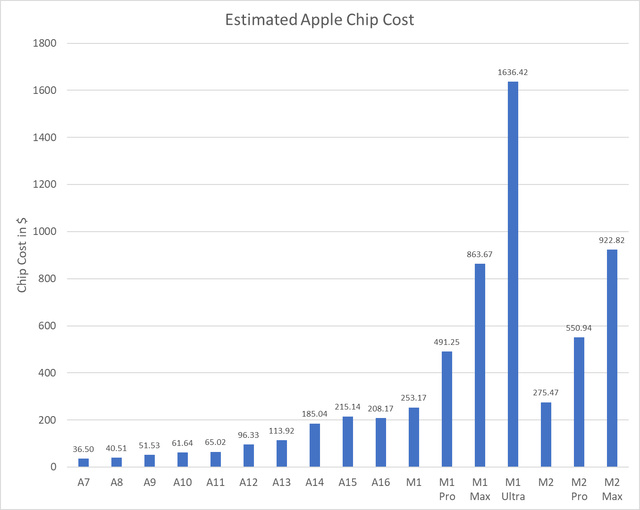
The chart below shows estimated costs for A series and M series chips:
The above prices are meant to be equivalent to what Apple would pay if purchasing them from an outside supplier or what Apple would charge if selling them to other companies. Note that the price increase in going from A7 to A15 is nowhere near a factor of 15, but it’s still substantial, and, I believe, unavoidable.
Given the increase in complexity and computational power, I consider the estimated price of the A15 to be very reasonable. Also note that the big price jump in A series SOCs occurs at the A14, which happens to have been the first to use the 5 nm process.
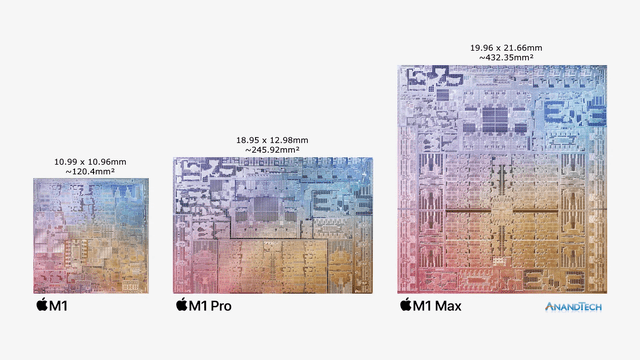
I applied the same estimation process to the M series Mac processors and found their prices to be considerably higher than for the A series. This was mainly due to the size of the Pro and Max chips.
An article in AnandTech pointed out that the M1 Max has more transistors than Nvidia’s (NVDA) GA100 Ampere data accelerator chip at 57 billion to the GA100’s 54 billion. Fabricated on the TSMC 7 nm process, the GA100 pushed the size limits of what TSMC could fabricate in a single chip (its reticle limit). Using N5, the M1 Max is physically smaller but comparable in complexity, and Nvidia charged many thousands of dollars for their chip.
The cost estimates for the M1 Pro and Max are generally lower than their x86 counterparts, and this suggests that my cost estimation for Apple SOCs is conservative and probably a little low.
There’s an added complication in using the SOC cost estimates above and that has to do with the time phasing of the processors in the product mix. In any given year, the iPhone, Mac, Watch, and iPad models use a variety of processors. Apple, of course, provides no information about product mix.
For iPhone, it’s generally assumed that about 60% of Apple’s unit sales come from the new model lineup. Apple generally sells the two previous iPhone generations at a discount. In my cost model, I assume that one-year-old models constitute about 30% of unit sales, while the two-year-old models, about 10%.
The effect of this is to smear out the unit sales of a given SOC over multiple years. For instance, although the A13 in iPhone 11 was the newest processor that Apple offered for most of fiscal 2020 (up to September) it shared unit sales with the A12 in the iPhone XR, and the A11 in iPhone 8.
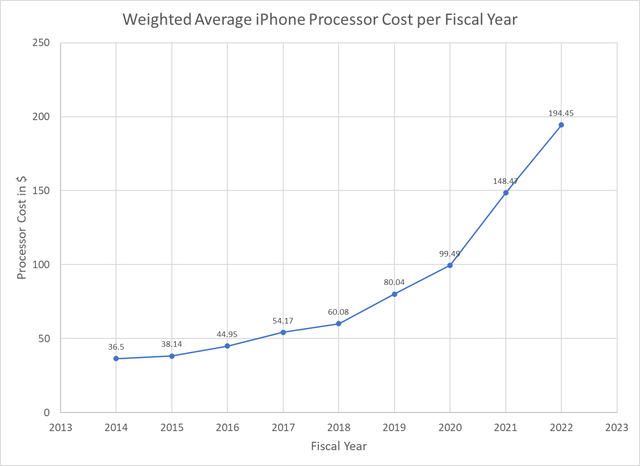
Using the assumed 60/30/10 unit sales split for every fiscal year since 2015, the weighted average iPhone processor cost is lower than just the new processor cost for that year as shown below:
Thus the $99.49 weighted average processor cost in fiscal 2020 represents the weighted average of the costs of the A11, A12, and A13. Weighted average costs are used to multiply by estimated unit volumes in order to calculate total semiconductor value generated by a given product lineup, such as iPhone. In this way, I try to take into account product mix over the years for iPhone, iPad, Watch, and Apple Silicon Macs without performing a detailed estimate of unit volumes for various models within the individual product lineups.
Estimating unit volumes for Apple hardware products post fiscal 2018
Average selling price provides a way of relating total product revenue to unit volume since:
ASP = (Product Revenue) / (Unit volume)
Thus if the ASP is known or can be estimated, then the unit volume can be derived from Apple’s reported product revenue. For this analysis, estimates are based on scaling product ASPs from the last reliable data of 2018. ASPs are scaled from US inflation data supplied by MacroTrends. The following ASPs shown in the table are the result of the inflation scaling, except for 2018 which is based on Apple reported unit shipments:
|
Fiscal Year |
2018 |
2019 |
2020 |
2021 |
2022 |
|
iPhone ASP |
761.31 |
779.89 |
794.00 |
803.77 |
841.55 |
|
Mac ASP |
1387.78 |
1421.64 |
1447.37 |
1465.17 |
1534.03 |
|
iPad ASP |
427.08 |
437.50 |
445.42 |
450.90 |
472.09 |
|
Watch ASP |
579.97 |
594.12 |
604.87 |
612.31 |
641.09 |
Apple never reported Watch unit shipments, and the starting 2018 value is based on a unit shipment estimate from Statista. Unit shipment estimates are derived from dividing Apple’s reported product revenue by the scaled ASPs in the table above. For the case of Watch, revenue is assumed to be 75% of Wearables, Home, and Accessories revenue.
In the case of the Mac, Apple Silicon Macs are assumed to be 60% of fiscal 2021 unit sales and 80% of fiscal 2022 unit sales. By the way, the ASP division method of estimating total Mac sales is not in bad agreement with IDC for fiscal 2021 and fiscal 2022.
For fiscal 2021 I estimate Mac unit sales at 24.018 million, and for fiscal 2022, 26.190 million. For calendar 2021, IDC estimates Mac unit sales at 27.775 million, and for calendar 2022, 28.6 million.
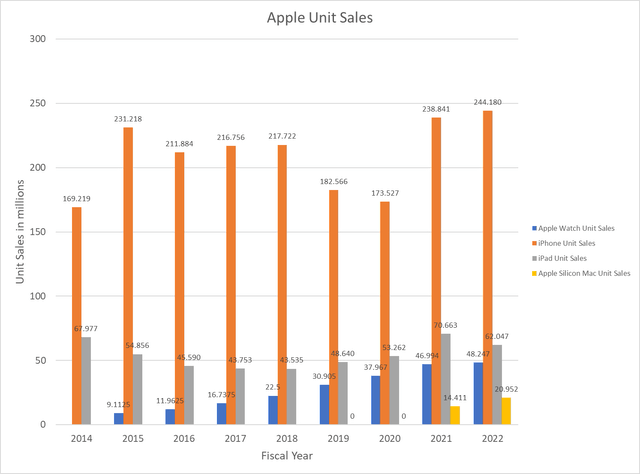
The chart below shows my estimated unit shipments starting in 2019 with Apple data used for 2014-2018:
Combining the unit volume estimates with chip cost, and some parametric excursions
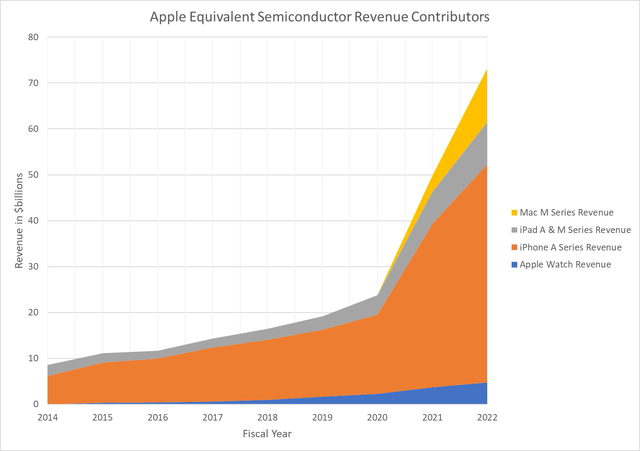
Calculating the total value of Apple semiconductors for a given fiscal year is now just a matter of multiplying unit volumes for a given product by the weighted average semiconductor cost for the product. This yields the results shown in the chart below:
It’s interesting to compare Apple’s equivalent semiconductor revenue with other traditional semiconductor companies, as shown in the chart below:
The surge in Apple’s semiconductor value starting in fiscal 2021 is due to a number of factors, including the apparent surge in iPhone unit sales, the adoption of TSMC’s N5 process for new A series and M series SOCs, and the introduction of new Apple Silicon Macs. I say apparent surge in iPhone unit sales because it could certainly be argued that perhaps what really happened was just a surge in ASPs for 2021 and 2022.
So let’s look at that parametrically. Let’s assume that ASPs rose to the point where unit sales were just at the fiscal 2020 level of about 174 million. This requires an assumed ASP for 2021 of $1100 and for 2022 of $1180.
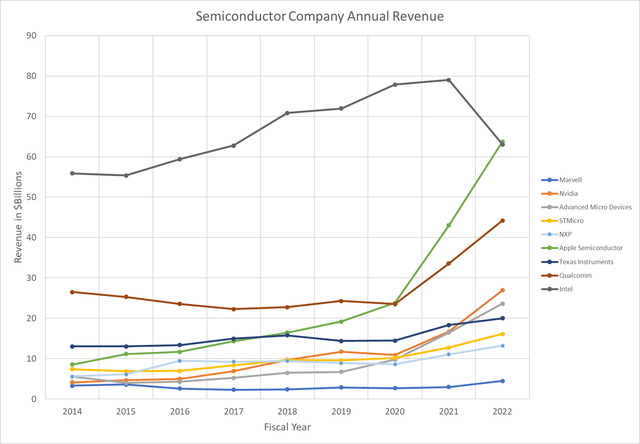
Apple’s equivalent semiconductor revenue does drop quite a bit, but it’s still challenging Intel:
Also, I haven’t corrected for mix shift. The high ASPs would indicate that 40% of Apple’s sales were not coming from previous one or two-year-old models. If I assume a 75% new, 20% one-year-old, and 5% two-year-old mix, then the revenues for 2021 and 2022 are bumped higher:
Actually, I don’t consider it particularly plausible that iPhone ASPs went up to $1100+ in fiscal 2021 and 2022. There was an across the board surge in buying of personal electronics due to COVID and the surge in iPhone sales was part of that.
But I thought it was worth looking at some parametric excursions simply because even in the worst case, the model shows how dominant Apple’s semiconductor business has become.
Investor takeaways: Apple’s new paradigm is the quiet revolution
If the reader is surprised or even shocked by the results of this analysis, perhaps it’s because Apple’s new semiconductor paradigm has been largely ignored by technology analysts and many tech investors. Even now many analysts continue to champion traditional semiconductor companies such as Intel and AMD (AMD).
The Apple business model is the new paradigm. Apple designs its semiconductors but relies on TSMC to fabricate them. Apple maintains no fabrication capability whatsoever.
But this is only part of the new paradigm. Apple doesn’t sell its semiconductors to others, as a merchant semiconductor vendor in the classic Intel mold. More to the point, Apple’s semiconductor design is tightly integrated with its overall product design, including software and operating systems.
This tight integration of hardware and software design has yielded personal computing devices that are usually easier to use, more energy efficient, and more powerful than competing systems. In addition to increasing the appeal of its products, Apple’s vertical integration reserves profit to the company that would otherwise go to outside vendors.
While one might dispute the particulars of this analysis, I don’t think there’s any disputing the general result. Apple has become a semiconductor colossus rivaling the largest in the industry. I remain long Apple and rate it a Buy.
Disclosure: I/we have a beneficial long position in the shares of AAPL, NVDA, TSM either through stock ownership, options, or other derivatives. I wrote this article myself, and it expresses my own opinions. I am not receiving compensation for it (other than from Seeking Alpha). I have no business relationship with any company whose stock is mentioned in this article.
Consider joining Rethink Technology for in depth coverage of technology companies such as Apple.


