Summary:
- Q2 2024 earnings report slightly beat expectations, prompting a re-evaluation. Revised fair price estimate is $221.04, suggesting a 20.5% undervaluation.
- Apple focuses on innovation and cost-cutting, exemplified by Apple Silicon CPUs. Net income and operating income have been growing faster than revenue.
- Smartphone and consumer electronics markets show steady growth, along with potential in accessories and cloud gaming.
- Near-term catalyst is device replacement cycles. Despite risks like geopolitical tensions, undervaluation and strong services growth justify a “strong-buy” rating.
ozgurdonmaz
Thesis
In my previous article on Apple Inc. (NASDAQ:AAPL), I re-evaluated Apple following its Q1 2024 earnings (which were released on February 1, 2024). The fair price estimate in that article was $276.29, and the future price estimate was $403.14. This prompted an upgrade from “buy” to “strong buy”.
The company released Q2 2024 earnings on May 2. The company beat EPS and revenue estimates by a slim margin of 0.02% and 2.09% respectively. The company also increased the dividend to $0.25 per share (which is a 4% increase), as well as announced a $110B stock buyback program.
After re-evaluating Apple with the newly available data from the Q2 2024 earnings report, I arrived at a fair price estimate of $221.04, meaning that the stock is undervalued by around 20.5%. Then the future stock price for 2029 came out at $413.18, which translates into annual returns of 20.9% throughout 2029. The main drivers were the services segment and the iPhones that will need to be replaced in 2024. Because of these factors, I decided to maintain my “strong-buy” rating on Apple.
Overview
Growth Plan
Apple’s top-line growth strategy focuses on developing new products (such as when it released the Apple Watch, the AirPods, and recently, the Vision Pro) to enhance the Apple ecosystem further. It has recently announced plans to create a custom AI chip that will be set for mass production in 2025.
Meanwhile, its bottom-line growth strategy is cutting costs to enhance profitability. One of these examples is the introduction of the Apple Silicon CPUs for MAC and iPad, which helped Apple to cut costs since it would not need to pay for another company’s profit.
For instance, Apple’s revenue has been growing by 7.3% since 2018, but operating income and net income have been growing by 11.1% and 11.4% respectively.
| operating margin % | Net income margin % | |
| 2018 | 26.69% | 22.41% |
| 2019 | 24.57% | 21.24% |
| 2020 | 24.15% | 20.91% |
| 2021 | 29.78% | 25.88% |
| 2022 | 30.29% | 25.31% |
| 2023 | 29.82% | 25.31% |
| 2024 TTM | 30.98% | 26.31% |
| Avg | 28.04% | 23.91% |
How Does Apple Compare Against Peers?
Apple is in a privileged position in my opinion, because it has a 20.1% market share, which means that the company has plenty of growth to unlock. This market share puts Apple in second place behind the 31% market share held by other small cellphone vendors.
Statista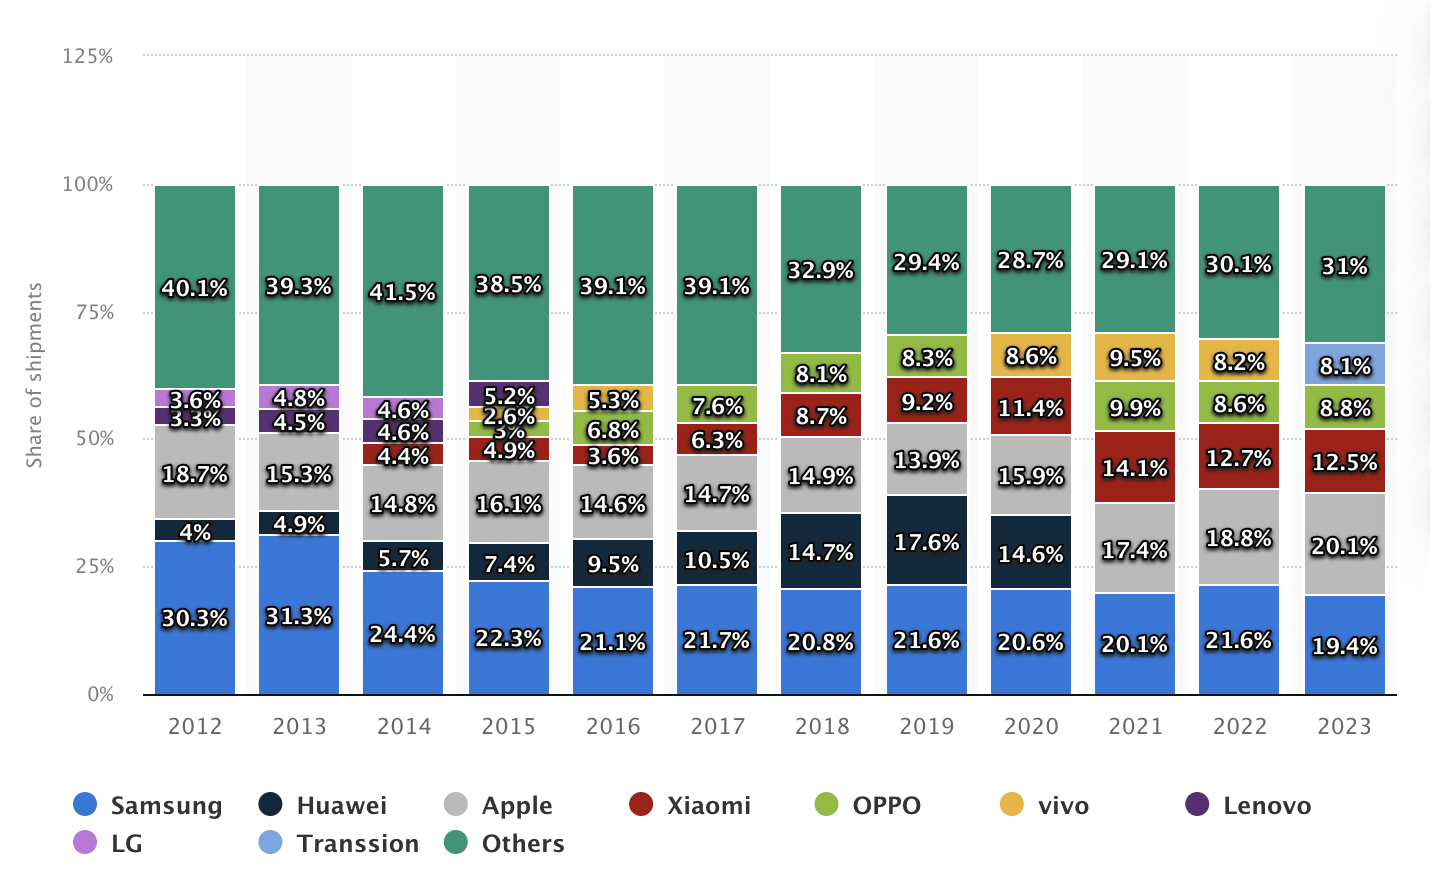
Then, concerning its macOS market share, it currently stands at 14.7%, which represents an overall decrease from April 2023’s 17.79%. This is behind Windows’ 73.5% market share, which has increased from April 2023’s 62.65%.
Industry Outlook and Addressable Market
Devices
The worldwide smartphone market is expected to reach a market volume of $500B by 2024 and grow at a CAGR of 3.53% throughout 2028 when it should reach a market volume of $574.42B.
On the other hand, the consumer electronics market is expected to grow at a CAGR of 2.99% throughout 2028. The total market volume as of 2023 stands at $1.04T, and that number is expected to climb up to $1.21T for 2028.
Accessories
The global consumer electronics accessories are expected to grow from 2023’s $51.22B to $82.65B in 2029, reflecting an 8.3% annual CAGR. However, in my opinion, Apple would not display this growth rate because their accessories are specifically for their devices. Plus, the only way to attain that growth rate is if Apple customers buy several accessories in a year, or if Apple increases pricing.
Apple Music
The worldwide music streaming market is expected to grow at a 13% CAGR. At the end of 2023, this market was valued at $39.5B, and by growing at that 13% rate, it means that by 2029 the market will be valued at $81.25B.
Apple News
Apple News is a subscription that enables users to access several subscription magazines and newspapers. It’s one subscription for many products. The digital newspapers & magazines market is expected to grow at a 2.06% CAGR throughout 2029. This means that its total market volume will grow from the expected $40.23B for 2024, to $44.54B by 2029.
Apple TV+
Apple TV is something similar to Apple News, here you can connect several streaming services into one platform, and at the same time, users will have access to original Apple programs.
The worldwide OTT video market witnessed a total market volume of $316.4B in 2023 and is expected to grow that number up to $429.4B in 2029. Thus, displaying a 6.3% CAGR throughout 2029.
Apple Arcade
Apple Arcade is a subscription service that enables access to a library of around 200 games that are only available on Apple Arcade. This is a similar service when compared to XBOX Live or PlayStation Plus.
The worldwide cloud gaming market generated revenue of $4.34B for 2023, and for 2029 it’s expected to generate $25.30B, implying an 80.49% throughout that period.
Apple iCloud
Apple iCloud is the default cloud storage service for Apple devices, and it has around 850M users.
The global cloud storage market was valued at $108.69B as of 2023, and it’s expected to grow at a 22.4% CAGR until it reaches a 366.2B valuation in 2029.
App Store
The App Store needs no description: it’s where iPhone, iPad, and Mac users download apps. It has a near duopoly dominance with the Google Play Store.
The worldwide apps market witnessed a collective revenue of $457.9B for 2023 and that number is expected to increase to $673.80B for 2027. Protecting an 8.83% CAGR throughout the forecasted period.
Repairs
The consumer electronics repairs market was valued at $16.42B in 2023 and it’s expected to grow by a 3.6% annual CAGR, thus, achieving a $20.3B valuation for 2029.
Payment Services
Apple offers payment services through Apple Pay, a digital wallet that you can use to make contactless purchases with your iPhone in payment terminals. Additionally, Apple offers a savings account and a credit card, which are only available for US users.
The US neobanking market registered a total transaction value of $1.43T for 2023, and it’s expected to reach $2.8T by 2028, displaying a 19.16% CAGR throughout 2023-2028.
Most banks charge a 1.7% commission on vendors who accept the card payment, therefore, the revenue that can be generated by these companies stands at $24.310B (as of 2023) and $47.6B (for 2023).
Then, when multiplying that by 20.10% (which is the market share of the iPhone), we will see that the truly addressable market in payment services is $4.88B (as of 2023) and that number will almost double by 2029 when it’s expected to reach $9.56B.
Total current TAM and future TAM
In the table below, you can observe the current and future addressable market by segment. For devices, the addressable market was the entire consumer electronics market, however, for the other segments, this was not the case. This is because services such as Apple TV, Apple Pay, Repairs, etc, are only for Apple device users. For that reason, I multiplied the current and future market sizes by the iPhone’s market share of 20.1%.
The results were a current addressable market of $1.25T and a future addressable market of $1.56T. This reflects a 4.13% annual growth in the addressable market. Nevertheless, Apple’s 2024 TTM revenue of $381.62B is just 30.3% of its current addressable market of $1.25T.
| Apple’s Current TAM | Apple’s TAM for 2029 | Market Volume as of 2023 | Market Volume for 2029 | |
| Devices | 1,046,000.0 | 1,212,000.0 | 1,046,000.0 | 1,212,000.0 |
| Accessories | 10,296.2 | 16,613.3 | 51,225.0 | 82,653.0 |
| App Store | 92,048.0 | 135,433.8 | 457,950.0 | 673,800.0 |
| Apple Music | 7,939.5 | 16,328.2 | 39,500.0 | 81,235.0 |
| Apple News | 8,086.2 | 8,952.5 | 40,230.0 | 44,540.0 |
| Apple TV | 63,596.4 | 86,309.4 | 316,400.0 | 429,400.0 |
| Apple Arcade | 1,388.9 | 5,085.3 | 6,910.0 | 25,300.0 |
| Apple iCloud | 21,846.7 | 73,606.2 | 108,690.0 | 366,200.0 |
| Repairs | 3,300.6 | 4,080.7 | 16,421.0 | 20,302.0 |
| Payment Services | 4,886.3 | 9,567.6 | 24,310.0 | 47,600.0 |
| Total | 1,259,388.8 | 1,567,977.0 |
Which is Apple’s catalyst in the near term?
Apple’s near-term catalyst is the users who will need to replace their devices. In the case of the iPhone, the average user sticks to it for 3 years. In the case of Macs, it’s longer since Apple has supported them through updates for around 8 years.
Around 30% of users iPhone purchasers in 2021 said that they replaced their iPhones every 3 years. In 2021, Apple sold 241M iPhones, which means that 72.3M iPhones will be replaced in 2024. In the Valuation section, I will go deeper into this subject.
Statista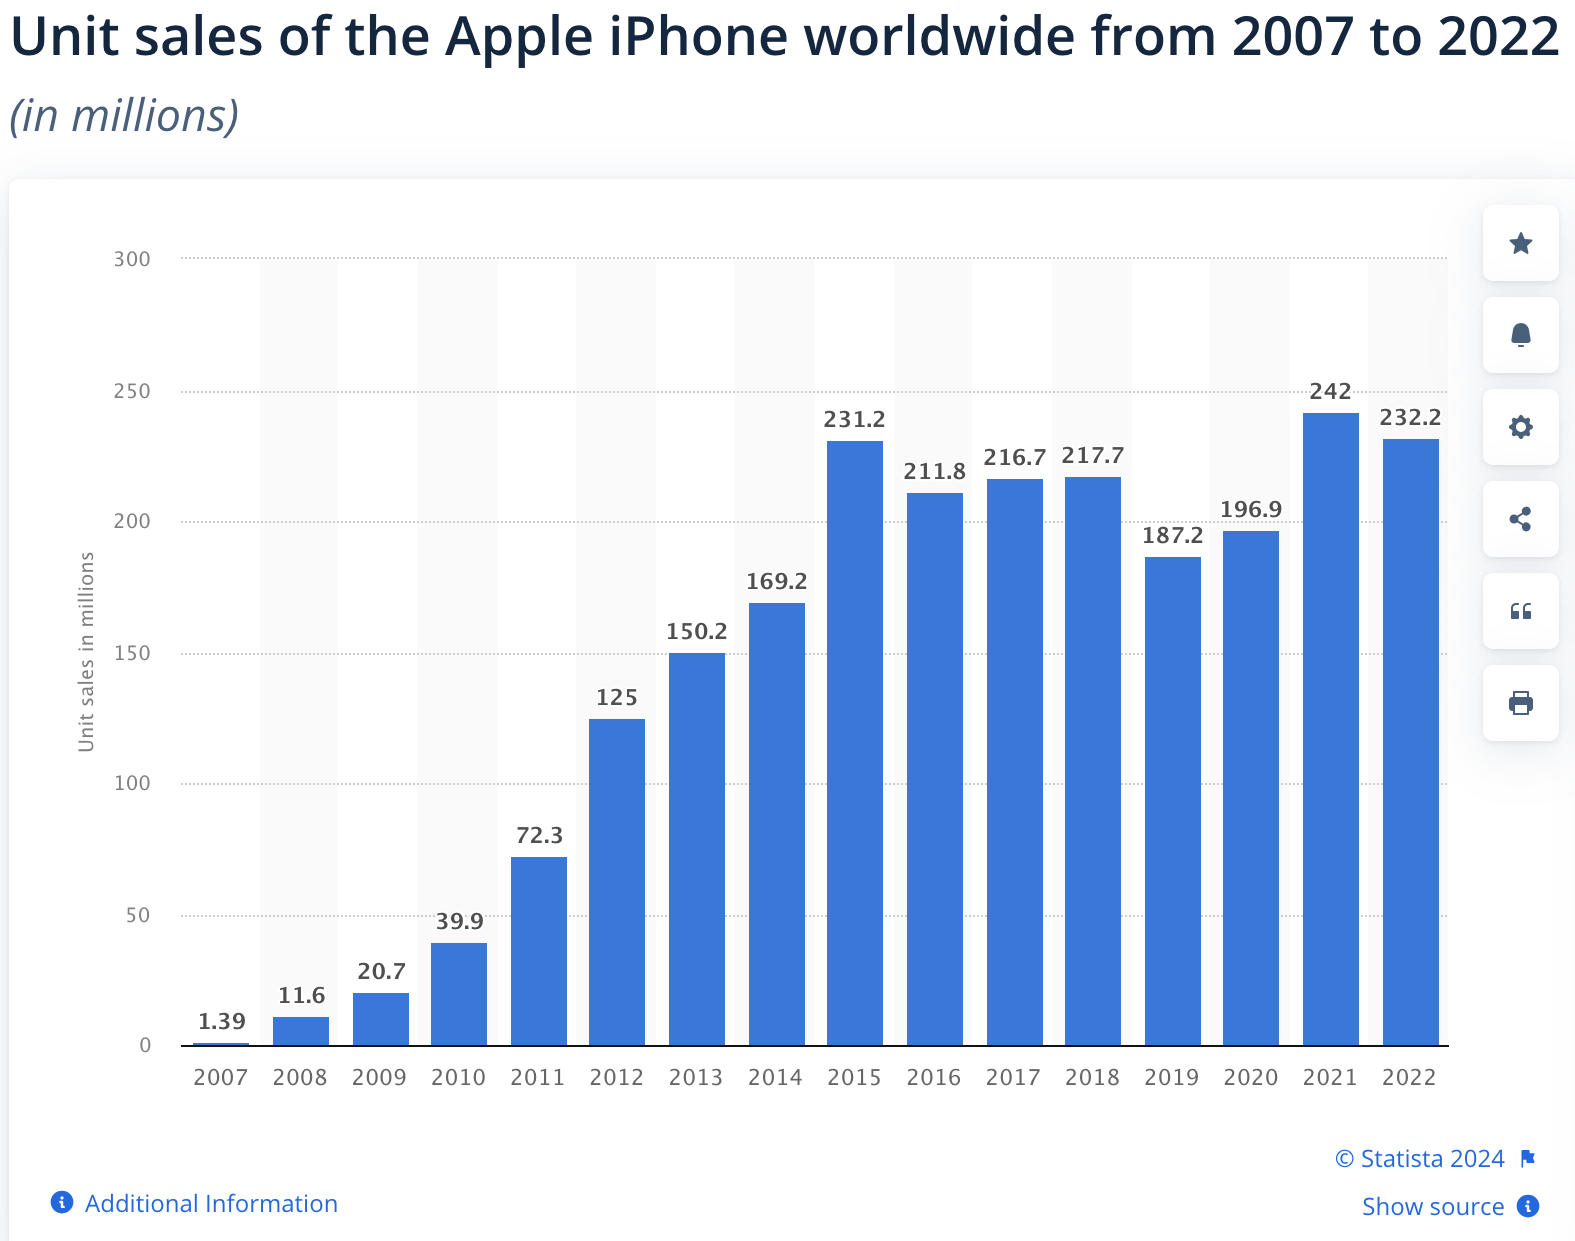
Valuation
I will value Apple with a DCF model. In the table below, you can find all the current financial information necessary to calculate some aspects of the DCF. The first of those aspects is the WACC, which I calculated with the already-known formula. The result came out at 11.41%. The calculation process is in the DCF under the section labeled “WACC Calculation”.
Then, it’s D&A and R&D. D&A will be calculated with a margin tied to revenue which came out at 2.98%. Then, for R&D, the margin will be tied to gross profit. The margin came out at 17.44%.
| TABLE OF ASSUMPTIONS | |
| (Current data) | |
| Assumptions Part 1 | |
| Equity Market Price | 2,810,000.00 |
| Debt Value | 104,590.00 |
| Cost of Debt | 3.76% |
| Tax Rate | 15.42% |
| 10y Treasury | 4.497% |
| Beta | 1.2 |
| Market Return | 10.50% |
| Cost of Equity | 11.70% |
| Assumptions Part 2 | |
| CapEx | 8,644.00 |
| Capex Margin | 2.27% |
| Net Income | 100,389.00 |
| Interest | 3,933.00 |
| Tax | 17,723.00 |
| D&A | 11,389.00 |
| Ebitda | 133,434.00 |
| D&A Margin | 2.98% |
| Revenue | 381,623.0 |
| R&D Expense Margin | 17.44% |
The first step is to calculate revenue, and I will start with Apple’s most important segment: device sales. As previously said, 30% of people who bought an iPhone in 2021 said that they replaced their phones every 3 years. Furthermore, the worldwide smartphone market is expected to grow at a CAGR of 3.53%, which will be used to calculate the new first-time iPhone users. With this in mind, I made the following table:
| iPhone Units Purchased | 30% of People will keep their phones for 3 years | |
| 2015 | 231.2 | 69.36 |
| 2016 | 211.8 | 63.54 |
| 2017 | 216.7 | 65.01 |
| 2018 | 217.7 | 65.31 |
| 2019 | 187.2 | 56.16 |
| 2020 | 196.9 | 59.07 |
| 2021 | 241 | 72.3 |
| 2022 | 232.2 | 69.66 |
| 2023 | 231.8 | 69.54 |
| 2024 | 253.2 | 75.96 |
| 2025 | 259.5 | 77.85 |
| 2026 | 268.6 | 80.57 |
| 2027 | 284.5 | 85.34 |
| 2028 | 296.4 | 88.92 |
| 2029 | 309.6 | 92.87 |
Then, the average iPhone was sold at $865.32 in 2023. This was calculated by dividing the 2023 iPhone revenue of $200.58B by the total units shipped of 231.8M. If someone has any complaint about this result, and says that the number is too low since Apple sells its phones for over $1K: keep in mind that telecom companies can bulk purchase them and therefore obtain a cheaper per unit price. Then, with that $865.32 results, I multiply it by the total shipments I am producing for each year throughout 2029. Then, the Mac and iPad will grow at a 2.99% rate, in line with the consumer electronics market.
| iPhone | Mac | iPad | |
| 2023 | 200,583.0 | 29,357.0 | 28,300.0 |
| 2024 | 219,111.9 | 30,234.8 | 29,146.2 |
| 2025 | 224,562.1 | 31,138.8 | 30,017.6 |
| 2026 | 232,385.3 | 32,069.8 | 30,915.2 |
| 2027 | 246,147.1 | 33,028.7 | 31,839.5 |
| 2028 | 256,471.2 | 34,016.3 | 32,791.5 |
| 2029 | 267,871.6 | 35,033.4 | 33,772.0 |
| Growth Rate % | 3.53% | 2.99% | 2.99% |
Then, it’s time to calculate the revenue of Apple’s fastest-growing segment: services. This segment is very diversified since it includes apps (App Store, Apple Music, Apple TV, etc), apple care, repair services, and payment services.
For the first segment (apps), I first multiplied the amount of subscribers of each service by the price per month of the service.
Apple News with its 125M subscribers, and its $9.99/month price, means that the company generated $1.24B in 2023. It will grow at the 2.09% rate of the global digital newspaper & magazine market.
On the other hand, Apple TV with its 75M subscribers and its $10/month price, could’ve generated around $750M in 2023. Apple Arcade has around 100M subscribers, multiplied by its $4.99 price, which means that the company generated around $499M from it. This service will grow at 6.30% of the worldwide OTT video market.
On the other hand, I was able to find the revenue for Apple Music, which stood at $9.2B for 2023. This segment will grow at the 14.40% rate of the worldwide music streaming market.
Meanwhile, iCloud generated around. This division will grow at 22.40% of the worldwide cloud storage market.
Meanwhile, the App Store‘s revenue was calculated by multiplying the 30% Apple charges for apps and in-app purchases, by the $86.8B spent in the App Store in 2022. Then, increased that number by 8.58%, which is the estimated app market growth rate.
Below you can see the results of these calculations, plus the growth rates that correspond to the market in which each of these segments operates.
| Apple Music | Apple News | Apple TV+ | Apple Arcade | Apple iCloud | App Store | |
| 2023 | 9,200.0 | 1,248.8 | 750.0 | 499.0 | 17,020.0 | 28,200.0 |
| 2024 | 10,524.8 | 1,274.8 | 797.3 | 898.2 | 20,832.5 | 30,619.6 |
| 2025 | 12,040.4 | 1,301.5 | 847.5 | 1,616.8 | 25,499.0 | 33,246.7 |
| 2026 | 13,774.2 | 1,328.7 | 900.9 | 2,910.2 | 31,210.7 | 36,099.3 |
| 2027 | 15,757.7 | 1,356.5 | 957.6 | 5,238.3 | 38,201.9 | 39,196.6 |
| 2028 | 18,026.8 | 1,384.8 | 1,018.0 | 9,428.9 | 46,759.2 | 42,559.7 |
| 2029 | 20,622.6 | 1,413.8 | 1,082.1 | 16,972.1 | 57,233.2 | 46,211.3 |
| Growth Rate % | 14.40% | 2.09% | 6.30% | 80.00% | 22.40% | 8.58% |
Then I need to project the revenue of the other divisions of the services segments. Starting with Payment services, it’s estimated that in 2022, it earned around $1.9B. If we increase that number by the 16.46% growth rate of the fintech market, we get that in 2023, Apple’s payment operations could’ve generated around $2.2B. Nevertheless, the market forecast got upgraded and now it’s expected to grow at a 19.16% rate, which is the one I will use.
Then, AppleCare is estimated to have generated around $8.5B in revenues for 2021. Therefore, if we apply the 2.5% growth rate of the consumer electronics repair market, we can speculate that in 2023 this product generated $8.93B in revenues for 2023.
Lastly, if we subtract the service revenues that I have until this step of the calculation (which is $ B) from the total service revenue of 2023 of $85.2B, we can say that repairs generated $12B in revenue for Apple. The segment will continue to grow at that rate.
The complete revenue results per segment are the following:
| Sale of Devices | Apps (Services) | Apple Care (Services) | Repair (Services) | Payment Services (Services) | Wearables, Home and Accessories | |
| 2023 | 258,240.0 | 62,048.2 | 8,930.3 | 12,009.7 | 2,212.7 | 39,845.0 |
| 2024 | 278,492.8 | 64,947.1 | 9,245.5 | 12,309.9 | 2,636.7 | 41,259.5 |
| 2025 | 285,718.5 | 74,551.8 | 9,571.9 | 12,617.7 | 3,141.8 | 42,724.2 |
| 2026 | 295,370.3 | 86,223.9 | 9,909.8 | 12,933.1 | 3,743.8 | 44,240.9 |
| 2027 | 311,015.4 | 100,708.6 | 10,259.6 | 13,256.5 | 4,461.1 | 45,811.5 |
| 2028 | 323,279.0 | 119,177.3 | 10,621.8 | 13,587.9 | 5,315.9 | 47,437.8 |
| 2029 | 336,676.9 | 143,535.1 | 10,996.7 | 13,927.6 | 6,334.4 | 49,121.8 |
| Growth Rate % | 3.53% | 2.50% | 19.16% | 3.55% |
Now, it’s time to predict net income. To do this, I made a table with all the variables that influence net income going back to revenue.
Starting with operating expenses, I decided to maintain the gross margin constant because it’s in line with Apple’s history. Furthermore, the service segment is contributing more and more to Apple’s revenue, which also helps increase the gross margin.
For general & administrative expenses, I decided to tie it up with full-time employees. I found that in 2023, this ratio was $160K per each of the 161K employees Apple had in 2023. Then, I will limply that Apple will hire 3.5k new employees each year, as it did in 2021-2023
Then, R&D expenses are tied to gross profit. For 2023, I found that Apple spent 17.44% of its gross profit on R&D. This rate will be maintained throughout the projection.
Now, it’s time to calculate interest expense and interest income. The first step is to predict total debt. For this, I will assume that it will continue to decrease at the 7.6% rate displayed during 2021-2024 TTM. For marketable securities, I will assume the 2.4% annual growth in cash reserves displayed in 2021-2024TM.
Then, I found that in 2019 (when interest rates were low) Apple paid a 3.31% interest on its debt and received 9.59% in returns from its marketable securities. In 2023 (when interest rates were high), Apple paid 3.76% in debt interest, but it gained 11.87% from its marketable securities. Then, I will assume that for 2025 and 2026, interest rates will be low, as well as for 2028 and 2029. However, for 2027, I will assume high-interest rates again. My explanation for this can be found in the valuation section of my article on Bank of America Corporation (BAC).
| During High Interest Rates | During Low Interest Rates | |
| Marketable Securities | 31,590.00 | 51,713.00 |
| Interest Income | 3,750.00 | 4,961.00 |
| Return % | 11.87% | 9.59% |
| Total Debt | 104,590.00 | 108,047.00 |
| Interest Payment | 3,933.00 | 3,576.00 |
| Cost % | 3.76% | 3.31% |
Lastly, I calculate income tax expenses based on the current effective tax rate of 15.42%. The net income results are the following:
Author’s Calculations
Now, before going to the results of the DCF model, I would like to obtain the stock price for the year 2029. To do this, I will use the undiscounted cash flows that are highlighted in green in the DCF model. Then, I will try to predict the value of each of the elements that conform to equity.
For this last thing, I will take the pace displayed in 2021-2024TM. This means that short-term debt will decrease by 17.2% annually, long-term debt by 5.3% annually, and current assets by 4.76% annually. Marketable securities will be taken from the net income protection chart above.
Author’s Calculations
As you can see, the DCF suggests a present fair stock price of $221.04, which is 20.5% above the current stock price of $183.38. The resulting future stock price is $413.18, which implies annual returns of 20.9% throughout 2029.
Risks to Thesis
The main risk with my thesis is that Apple loses its “status” appeal, or that a government organization tries to “break down” its monopoly. In my assessment, the iPhone has a wide advantage compared to others since even though it’s more expensive, it’s a good quality phone and its competition (mainly the Galaxy S24) is not precisely a cheap phone either. This means that consumers may be inclined more toward Apple’s status, and the fact that iPhones hold better resale value than the competition.
However, this can’t be said about Macs, which are expensive and are behind similarly-priced Windows laptops in terms of performance and power. Particularly in gaming.
The other risk I see is geopolitical, such as what China recently did when it banned iPhones for employees of state-owned enterprises. China is an important market for Apple, however, Apple can survive without it, as other regions such as Latin America and Southeast Asia can replace its market. I explored this scenario in my article “Apple Doesn’t Need China“. However, that China does this, sets a precedent, which means that in the future if countries such as India, Indonesia, or European countries get into a trade war with the US, Apple could be affected.
Conclusion
In conclusion, despite the overall bearish sentiment on Apple, this tech giant is, according to my estimates, undervalued by 20.5%, which means that the stock price should be $221.04. Furthermore, for 2029, the stock should be priced at $413.18, which translates into a 20.9% annual return throughout 2024-2029.
This growth is mainly thanks to the performance of the services segment which can grow an average of 12.80% annually throughout the project, and to the iPhones that will need to be replaced in 2024, which I estimated at 72.3M, which brings the potential 2024 iPhone sales to 253.2M units.
For these reasons, I reiterate my “strong-buy” rating on Apple. For the upcoming quarters, I would focus on service performance and iPhone sales. This last one has been struggling to grow since 2023’s 231.8 units sold is near the 231.2 units sold in 2015.
Analyst’s Disclosure: I/we have no stock, option or similar derivative position in any of the companies mentioned, and no plans to initiate any such positions within the next 72 hours. I wrote this article myself, and it expresses my own opinions. I am not receiving compensation for it (other than from Seeking Alpha). I have no business relationship with any company whose stock is mentioned in this article.
Seeking Alpha’s Disclosure: Past performance is no guarantee of future results. No recommendation or advice is being given as to whether any investment is suitable for a particular investor. Any views or opinions expressed above may not reflect those of Seeking Alpha as a whole. Seeking Alpha is not a licensed securities dealer, broker or US investment adviser or investment bank. Our analysts are third party authors that include both professional investors and individual investors who may not be licensed or certified by any institute or regulatory body.