Summary:
- Apple’s H1 FY2024 performance was muted with negative growth in iPhone, iPad, and Wearables segments.
- Supply chain disruptions in China and fewer product launches impacted Apple’s performance in 2023.
- Legal challenges, including patent infringement and antimonopoly lawsuits, are expected to have minimal impact on Apple.
ozgurdonmaz
In our previous analysis of Apple Inc. (NASDAQ:AAPL), we highlighted the company’s commitment to AI with several anticipated generative AI developments and the launch of the Vision Pro, which we projected to reach a $5.7 bln revenue opportunity for the company by 2027. Furthermore, we believed the company could leverage its advantages with its massive installed base, robust ecosystem and loyal customer base.
In this analysis, we examined the company again following as its H1 FY2024 performance had been muted with a flattish growth rate of -0.8% YoY, falling short of our previous full year forecasts for the company at 8.6%. To identify the reason, we examined the company’s H1 performance by segment in comparison with our previous full year forecasts.
|
Apple Revenue Comparison ($ bln) |
Our Previous Forecast (2024) |
Actual H1 FY2024 |
Difference |
|
iPhone |
213.38 |
115.67 |
|
|
Growth % |
6.4% |
-1.2% |
-7.6% |
|
Mac |
34.50 |
15.23 |
|
|
Growth % |
17.5% |
2.2% |
-15.3% |
|
iPad |
27.20 |
12.58 |
|
|
Growth % |
-3.9% |
-21.7% |
-17.8% |
|
Wearables, home and accessories |
45.56 |
19.87 |
|
|
Growth % |
14.3% |
-10.7% |
-25.0% |
|
Services |
95.57 |
46.98 |
|
|
Growth % |
12.20% |
12.7% |
0.5% |
|
Total |
416.20 |
210.33 |
|
|
Total Growth % |
8.60% |
-0.8% |
-9.4% |
Source: Company Data, Khaveen Investments
Based on the table above, the company’s growth performance was weighed down by iPhone, iPad as well as Wearables, home and accessories segments which had negative growth in the period. On the other hand, its Services segment growth is in line with our forecasts while its Mac segment is showing signs of recovery with positive growth in the period (2.2%). Thus, we examined the factors for weak performances of its iPhone, iPad as well as Wearables, home and accessories segments. Furthermore, we then examined the company’s competitiveness in terms of AI features for its iPhone and iPad segments. Finally, we discussed the latest legal developments in the company such as the anti-monopoly lawsuit on its iPhone business, smartwatch patent infringement and opposition to Australia’s proposed CSAM-related law on the company’s products.
Supply Chain Disruptions and Timing of Product Launches Impacted Growth
Based on its Q2 earnings briefings, management highlighted that its iPhone, iPad as well as Wearables, home and accessories segments “faced a difficult compare over the previous year”. For the iPhone, the company highlighted that in 2022, the company experienced supply chain disruptions following the launch of its new iPhone, which led to delays for its orders to be fulfilled. Whereas for its iPad and Wearables segment, the company highlighted “difficult compare” due to the timing of its product launches. We compiled a timeline of its product launches for the iPhone, iPad and Wearables segment below since March 2022.
iPhone
|
iPhone (FY) |
Q1’2023 |
Q2’2023 |
Q3’2023 |
Q4’2023 |
Q1’2024 |
Q2’2024 |
Q4’2024 (Expected) |
|
Revenue |
65.775 |
51.334 |
39.669 |
43.805 |
69.702 |
45.963 |
|
|
Growth QoQ |
54.3% |
-22.0% |
-22.7% |
10.4% |
59.1% |
-34.1% |
|
|
Growth YoY |
-8.2% |
1.5% |
-2.5% |
2.8% |
6.0% |
-10.5% |
|
|
Products Launched |
iPhone 14 Pro (Sept) iPhone 14 (Sept) iPhone 14 Pro Max (Sept) iPhone 14 Plus (Oct) |
iPhone 15 (Sept) iPhone 15 Plus (Sept) iPhone 15 Pro (Sept) iPhone 15 Pro Max (Sept) |
iPhone 16 iPhone 16 Plus iPhone 16 Pro iPhone 16 Pro Max |
Source: Company Data, Khaveen Investments
From the table, its Q2 FY2023 QoQ was negative as well as in Q2 FY2024, indicating a seasonality pattern post-launch of the iPhone in the previous quarter. However, Q2 FY2023 QoQ growth of -22% was better than Q2 FY2024 of -34%, which we believe is due to the impact of the supply chain disruption delaying some sales to Q2 FY2023. Also, its YoY growth in Q2 FY2023 was slightly positive which indicated the quarter’s sales increased compared to the previous year while Q2 FY2024 YoY growth was negative at -10.5% which we believe indicates sales normalized.
Based on the table, in 2023, Apple launched all 4 of its latest iPhone 15 models in September 2023 (Q1 FY2024). In contrast, Apple launched its 3 iPhone 14 model variants in September 2022 (Q1 FY2024) but only launched the iPhone 14 Plus model one month later in October 2022 as the company reportedly faced supply shortages of its screens which were different from the other iPhone 14 models. Additionally, Apple’s iPhone 14 Pro models were faced with reported shortages of “15-20 million units” and their order lead time was over 13x higher than its iPhone 14 model according to JP Morgan, as Covid lockdowns were imposed on China (Zhengzhou) manufacturing facilities since October 2022 until November 2022. Previously, we highlighted that China represents the largest country in its supplier base. Additionally, 95% of its iPhones are estimated to be produced in China with Zhengzhou facilities producing 80% of iPhones. Following the lifting of the lockdowns, its iPhone 14 Pro models’ lead time improved through January 2023, indicating improvements in supply for its iPhones.
Therefore, we believe this supports management’s claim of a difficult comparison in Q2 FY2024 with the same quarter a year ago where it had to “fulfill significant pent-up demand from the December quarter COVID-related supply disruptions on the iPhone 14 Pro and 14 Pro Max”.
|
Apple iPhone Revenue (Q2 2023) ($ bln) |
51.33 |
|
Supply Chain Impact Based on Management ($ bln) |
5 |
|
Apple iPhone Revenue (Q2 2023) (Adjusted for Supply Chain Impact) ($ bln) |
46.33 |
|
Apple iPhone Revenue (Q2 2024) ($ bln) |
45.96 |
|
Growth YoY% |
-0.8% |
Source: Company Data, Khaveen Investments
However, based on management estimates of a $5 bln revenue impact in the quarter due to the fulfillment of iPhone 14 demand, we calculated its iPhone revenue growth would be flat (-0.8% YoY), indicating other possible factors for its iPhone weakness. Furthermore, Apple’s market share in Q1 2024 was 17.3%, lower than previously expected (20.7%) but also lower than the year prior in Q1 2022 (18%), further supporting Apple’s underperformance in the smartphone market.
iPad
|
iPad (FY) |
Q2’2022 |
Q3’2022 |
Q4’2022 |
Q1’2023 |
Q2’2023 |
Q3’2023 |
Q4’2023 |
Q1’2024 |
Q2’2024 |
Q3’2024 |
|
Revenue |
7.65 |
7.22 |
7.17 |
9.40 |
6.67 |
5.79 |
6.44 |
7.02 |
5.56 |
|
|
Growth QoQ |
5.5% |
-5.6% |
-0.7% |
31.0% |
-29.0% |
-13.2% |
11.3% |
9.0% |
-20.8% |
|
|
Growth YoY |
-2.0% |
-2.0% |
-13.1% |
29.6% |
-12.8% |
-19.8% |
-10.1% |
-25.3% |
-16.7% |
|
|
Products Launched |
iPad Air (5th Gen) (Mar) |
iPad Pro (6th Gen) (Oct) iPad (10th Gen) (Oct) |
iPad Pro (7th Gen) (May) iPad Air (6th Gen) (May) |
|||||||
|
Total Market Shipments |
40.5 |
42.3 |
46 |
45.7 |
30.7 |
28.3 |
33.2 |
36.8 |
30.8 |
|
|
Growth YoY |
1.5% |
4.4% |
8.7% |
-0.7% |
-20.1% |
-30.1% |
-14.0% |
-19.5% |
0.3% |
|
|
Apple Shipments |
4.1% |
-9.4% |
-11.9% |
22.5 |
10.8 |
10.5 |
12.5 |
14.9 |
9.9 |
|
|
Growth YoY |
12.9 |
14.7 |
17.5 |
28.6% |
-10.7% |
-16.7% |
-13.8% |
-33.8% |
-8.3% |
Source: Company Data, Khaveen Investments
Based on the table above, Apple’s iPad revenue growth had been poor with only 1 quarter out of the 9 quarters with positive YoY growth, which was in Q1 FY2023 which also had the highest growth QoQ, in the following quarters its growth worsened with double-digit growth each quarter. In 2022, Apple launched 3 iPad models in the year, with the 5th gen iPad Air in March 2022 followed by the iPad Pro (6th Gen) and iPad (10th Gen) in October 2022. On the other hand, Apple did not launch any new products for its iPad in 2023. According to Spiceworks, “it is only the second time since the iPad’s launch in 2010 that Apple has gone an entire calendar year without releasing a new iPad”. Therefore, this indicates Apple’s lack of new iPad launches in 2023 as an outlier year. In 2024, Apple highlighted its commitment to its iPad with 2 new product launches recently for its iPad Pro and iPad Air which feature its new M4 chips as well as improved display and camera capabilities.
According to the IDC, while Apple remained the market leader, its tablet shipments declined by 22.3% YoY in Apple’s H1 FY2024 as IDC also highlighted “absence of new models” for Apple’s performance, lower compared to the overall tablet market which also declined by 10% as the tablet market remained weak with negative growth of -19.5% YoY in Q1 FY2024 but showed signs of recovery as its shipments had positive growth of 0.5% YoY in Q2 FY2024.
Wearables, home and accessories
|
Wearables Segment (FY) |
Q4’2022 |
Q1’2023 |
Q2’2023 |
Q3’2023 |
Q4’2023 |
Q1’2024 |
Q2’2024 |
Q4’2024 |
|
Revenue ($ bln) |
9.65 |
13.482 |
8.757 |
8.284 |
9.322 |
11.953 |
7.913 |
|
|
Growth QoQ |
19.4% |
39.7% |
-35.0% |
-5.4% |
12.5% |
28.2% |
-33.8% |
|
|
Growth YoY |
9.8% |
-8.3% |
-0.5% |
2.5% |
-3.4% |
-11.3% |
-9.6% |
|
|
Products Launched |
Apple Watch Series 8 (Sept) Apple Watch SE (2nd Gen) (Sept) Apple Watch Ultra (Sept) Updated AirPods Pro (2nd Gen) (Sept) |
Apple Watch Series 9 (Sept) Apple Watch Ultra (2nd Gen) (Sept) |
Vision Pro (Feb) |
Apple Watch SE (3rd Gen) (Sept) Airpods (4th Gen) (Sept) |
Source: Company Data, Khaveen Investments
For Wearables, we compiled its Apple Watch and AirPods (which we estimated represented 85.6% of its Wearables segment revenue) as management highlighted in its earnings briefing that its performance weakness was due to “a difficult launch compare on Watch and AirPods”. From the table, in Q4 FY2022, its Wearables revenue had the strongest growth (9.8% YoY and 19.4% QoQ). In the following periods, its growth had been negative YoY in each period.
For its smartwatch, the company launched 3 Watch models which include the Apple Watch Series 8, Apple Watch SE (2nd Gen) and Apple Watch Ultra in September 2022. In September 2023, however, the company only released 2 new models which are the Apple Watch Series 9 and Apple Watch Ultra (2nd Gen). Therefore, the company did not release a new Apple Watch SE model in 2023. Instead, the company is expected to release its Apple Watch SE (3rd Gen) this year in September 2024 based on a “two-yearly update cycle”.
|
Wearables Segment Shipment (FY) |
Q4’2022 |
Q1’2023 |
Q2’2023 |
Q3’2023 |
Q4’2023 |
Q1’2024 |
|
Apple AirPods Shipments |
23.8 |
28.4 |
17.9 |
17.7 |
19.1 |
21.4 |
|
Growth % |
33.8% |
-29.7% |
-17.7% |
1.3% |
-19.5% |
-24.8% |
|
TWS Market Shipments |
76.9 |
80.5 |
61.6 |
68.2 |
70.8 |
73.7 |
|
Growth % |
6.5% |
-22.3% |
-9.8% |
8.4% |
-7.9% |
-8.5% |
|
Apple AirPods Share |
31% |
35% |
29% |
26% |
27% |
29% |
|
Apple Smartwatch Share |
22% |
37% |
26% |
22% |
22% |
31% |
Source: Company Data, Khaveen Investments
According to Counterpoint Research, the smartwatch market shipments grew by 6% YoY in Q4 2023 (Apple’s Q1 FY2024), however, Apple’s shipments declined as its market share was 6% lower at 31% in Q4 2023 compared to 37% in the same period in the previous year. Thus, we believe the company’s performance was mainly attributed to the lower launches of new smartwatch models.
Whereas for its AirPods, Apple launched its AirPods Pro (2nd gen) in September 2022. In 2023, the company did not release a new product generation for its AirPods Pro but only updated its features to include a USB-C charging case. However, the company is expected to introduce its 4th gen AirPods in 2024 followed by its 3rd gen AirPods Pro in 2025 following a 3-year launch cycle. Based on Canalys, Apple’s market share in the True Wireless Stereo (TWS) market fell to 29% compared to 35% in the same period last year, remaining the market leader, while the market shipments grew by 4% and was the only company in the top 5 to witness negative growth (-13%) as Canalys highlighted the new features of the AirPods in 2023 were unable to spur demand. Thus, we believe its performance weakness could be attributable to its lack of product launches of new next-gen AirPods in 2023. Overall, we believe the company’s performance has been affected by company and market-specific factors due to the lower number of product launches and market weakness in TWS and smartwatches.
Conclusion
Therefore, we determined management’s claims of a “difficult compare” cited for weak performances across iPhone, iPad and Wearables segments to be likely true as one of the factors for its performance as the company previously experienced supply chain disruptions in China which had affected its sales in 2023 as well as lower product launches for its Watch and AirPods in 2023. We believe iPad revenues were impacted by the lack of new models in 2023 but also affected by the weak tablet market though it is showing signs of a positive recovery. Notwithstanding, going forward, we believe the new recent launches of iPad models as well as expected upcoming product launches for its Watch and AirPods could support a better growth outlook for the rest of FY2024. In relation, management guided its next quarter growth to grow positively at “low-single-digits year-over-year” and “iPad revenue to grow double-digits”. Additionally, however, we believe there are other factors for Apple’s iPhone underperformance, thus we examine them further in the following point.
AI Competitiveness of iPhone and iPad
IDC, Counterpoint Research, Khaveen Investments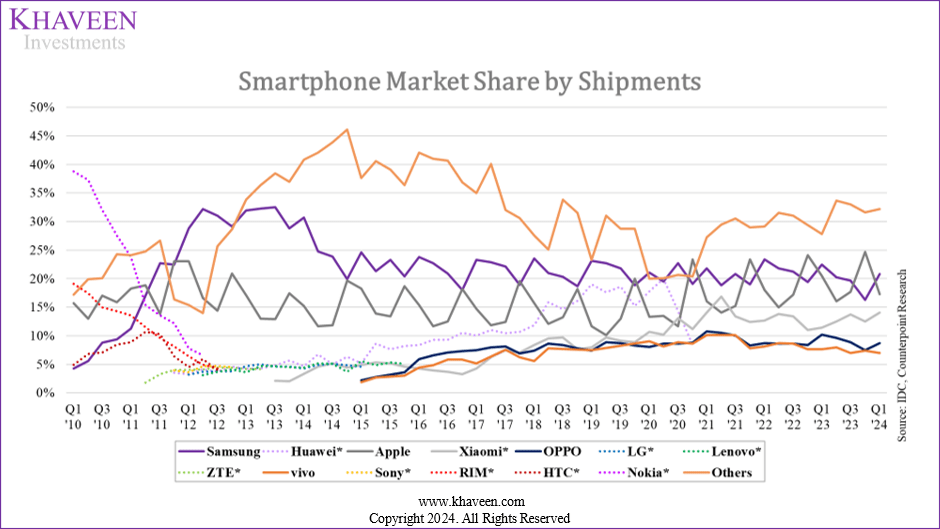
Based on the updated market share of the smartphone market, Apple’s market share had fallen in Q1 2024, which tends to be the case every year as its market share spiked in the previous quarter (Q4) following the yearly launch of Apple’s iPhone which is generally at the end of September. However, Apple’s market share had fallen to 17.3% in Q1 2024, 21% in the prior year (which we believed was buoyed up by the supply chain disruptions and delays in Q3) but also in Q1 2022 (18%), thus indicating Apple had lost some market share in Q1 2024 which could indicate lower competitiveness.
In our previous analysis, we compared leading premium smartphone makers in terms of criteria such as Branding, Features, Performance, and Product Range. We determined Apple leads overall with the top position in terms of Branding and trailing in second place in Features and Product Breadth comparison. For this section, we first examined Apple’s competitiveness in the smartphone market in terms of its AI capabilities. We also previously highlighted that we believed Apple has been using AI features to enhance its existing products but also highlighted upcoming AI developments. Recently, Apple announced that it is partnering with OpenAI to integrate ChatGPT with Siri on Apple’s iOS, iPadOS, and MacOS later this year, allowing Siri to access ChatGPT’s image recognition and document reading capabilities to enhance Generative AI content for users.
On the other hand, competitors have already introduced several AI features such as Samsung’s (OTCPK:SSNLF) latest S24 model which utilizes Gen AI applications to enrich user experience.
Company Data, Khaveen Investments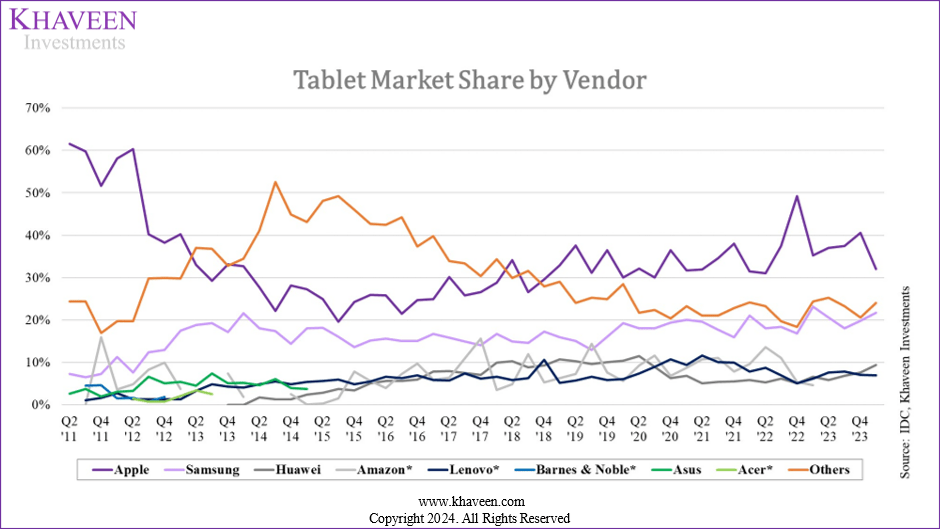
In the table market, Apple’s market share declined from 35.2% in Q1 2023 to 32% in Q1 2024 but remained the clear market leader. On the other hand, some competitors including Huawei and Lenovo gained some market share over the period, 2.8% and 0.8% respectively. This is as Huawei and Lenovo implemented AI features into their respective tablet devices, which include Huawei’s AI photo retouching function as well as Lenovo’s Toga Creator Zone.
Comparison of Smartphone Generative AI Features
|
Category |
Samsung |
Apple |
Xiaomi (OTCPK:XIACF) |
Huawei |
Google (GOOG) |
|
Search Features |
Circle to Search |
Apple Intelligence |
AI Album Search |
– |
SGE |
|
Image Editing |
Generative Edit |
Image Playground |
Hyper OS |
Huawei AI photo retouching function |
DeepDream |
|
Chat Assistance |
Chat Assist |
Apple Intelligence (Siri) |
XiaoAI |
Xiaoyi Assistant |
Gemini |
|
Translation |
Live Translate |
– |
XiaoAI Translation |
– |
Neural Machine Translation |
|
Note Taking |
Note Assist |
Writing Tools |
– |
Smart Vision |
– |
|
Wallpapers |
Generative Wallpapers |
– |
AI Surprise Wallpaper |
– |
– |
Source: Company Data, Khaveen Investments
Based on the table, Samsung’s Generative Edit feature offers users the ability to optimize scenes with intelligent adjustments, while Apple’s Image Playground enhances image editing with deep learning algorithms. Xiaomi’s Hyper OS system provides tools for real-time image enhancement, and Huawei introduces its AI photo retouching function for automated editing, including natural background removal. Google’s DeepDream stands out as a feature that allows users to generate abstract images with unique patterns. In terms of search features, Apple introduced Apple Intelligence, responding to competitors Samsung which has Circle to Search, Huawei offers AI Album Search, and Google presents SGE for enhanced search capabilities. Xiaomi’s XiaoAI and Xiaoyi Assistant provide chat assistance, while Huawei’s XiaoAI Translation aids in real-time translation. For notetaking, Apple recently introduced Writing Tools while Samsung has Note Assist and Huawei has Smart Vision. Lastly, Samsung’s Generative Wallpapers add creativity to device customization as well as Xiaomi’s AI Surprise Wallpaper.
|
Category |
Samsung |
Apple |
Xiaomi |
Huawei |
|
|
Search Features |
Yes |
Yes |
Yes |
– |
Yes |
|
Image Editing |
Yes |
Yes |
Yes |
Yes |
Yes |
|
Chat Assistance |
Yes |
Yes |
Yes |
Yes |
Yes |
|
Translation |
Yes |
– |
Yes |
– |
Yes |
|
Note Taking |
Yes |
Yes |
– |
Yes |
– |
|
Wallpapers |
Yes |
– |
Yes |
– |
– |
|
Total AI Features |
6 |
4 |
5 |
3 |
4 |
|
Ranking |
1 |
3 |
2 |
5 |
3 |
Source: Company Data, Khaveen Investments
Overall, we ranked Samsung as the first in terms of smartphone generative AI features as it has the most (6) followed by Xiaomi at second place with 5 features then Google and Apple tied with 4 features.
Comparison of Tablet Generative AI Applications
|
Category |
Samsung |
Apple |
Lenovo |
Huawei |
|
Image Editing |
Generative Edit |
Image Playground |
Lenovo Yoga Creator Zone |
Huawei AI photo retouching function |
|
Search Features |
Circle to Search |
Apple Intelligence |
– |
– |
|
Chat Assistance |
Chat Assist |
Apple Intelligence (Siri) |
Copilot Key |
Xiaoyi Assistant |
|
Note Taking |
Note Assist |
Apple Intelligence |
– |
Smart Vision |
|
Wallpapers |
Generative Wallpapers |
– |
– |
– |
Source: Company Data, Khaveen Investments
Moreover, in tablets, we compared Apple with Samsung, Lenovo and Huawei to compare their generative AI features. Similar to smartphones with Galaxy AI, Samsung in image editing provides Generative Edit, offers Circle to Search for convenient search interactions, provides Chat Assist for chat assistance, introduces Note Assist for note-taking, and offers Generative Wallpapers for personalized device customization. Apple has MGIE for image editing and its new Apple Intelligence introduces AI search features, chat assistance and note taking. Lenovo features the Lenovo Yoga Creator Zone for specialized editing and Smart Vision for notetaking. Huawei stands out with its AI photo retouching function for image editing and Xiaoyi Assistant for chat assistance.
|
Category |
Samsung |
Apple |
Lenovo |
Huawei |
|
Image Editing |
Yes |
Yes |
Yes |
Yes |
|
Search Features |
Yes |
Yes |
– |
– |
|
Chat Assistance |
Yes |
Yes |
Yes |
Yes |
|
Note Taking |
Yes |
Yes |
– |
Yes |
|
Wallpapers |
Yes |
– |
– |
– |
|
Total |
5 |
4 |
2 |
3 |
|
Ranking |
1 |
2 |
4 |
3 |
Source: Company Data, Khaveen Investments
For tablets, we ranked Samsung as first with the most features in generative AI (5) followed by Apple in second place following the introduction of new Apple Intelligence features, whereas Huawei and Lenovo in third and fourth place respectively.
Outlook
Overall, while we previously determined Apple to have an advantage in terms of its strong branding as well as having a strong position in terms of overall Product Features and Product Breadth, we believe Apple is still catching up with competitors in terms of generative AI features, lagging behind competitors notably Samsung which introduced Galaxy AI ahead of Apple. Notwithstanding, we believe the announcement of Apple Intelligence could improve its competitiveness, and from its earnings briefing, management highlighted its commitment towards generative AI developments. Thus, we anticipate future introductions that could further bolster its AI capabilities.
Minimal Impact from Legal Developments
In this section, we examined recent legal developments that Apple has been faced with such as its patent infringement related to its smartwatches as well as opposition to proposed CSAM-related rules and an antimonopoly lawsuit on its smartphone business.
Patent Infringement (Smartwatch)
In 2023, Masimo alleged Apple of patent infringement regarding its blood-oxygen tracking technology. “The International Trade Commission (ITC) ruled that the blood oxygen sensors in both devices infringed on patents from Masimo”, including the Apple Watch Series 9 and Apple Watch Ultra 21 and banned Apple from selling these models in the US from December 2023.
|
Wearables (FY) |
Q1’2023 |
Q2’2023 |
Q3’2023 |
Q4’2023 |
Q1’2024 |
|
Apple Smartwatch Share |
37% |
26% |
22% |
22% |
31% |
Source: Counterpoint Research, Khaveen Investments
Based on the latest available data on the market share of smartwatches, Apple’s market share decreased in Q1 FY2024 (Dec quarter) to 31% from 37% following the imposition of the ban in the US, which could indicate the company’s impact from the ban. However, as mentioned in the first point, we highlighted the lower smartwatch model launches in the previous year which could have also affected Apple’s market share. Therefore, we believe the impact on Apple from the ban may be minimal currently.
|
Americas Geographic Segment Revenue Breakdown (2022) |
42.41% |
|
Smartwatch Revenue (2023) ($ mln) |
16,883 |
|
Apple Total Revenue (2023) ($ mln) |
383,285 |
|
Smartwatch % of Revenue |
4.40% |
|
Estimated Smartwatch Revenue Impact % |
1.87% |
|
Estimated Smartwatch Revenue Impact ($ mln) |
315 |
|
Wearables Segment Revenue (2023) ($ mln) |
39,845 |
|
Estimated Smartwatch Revenue Impact as % of Wearables Segment |
0.79% |
|
Estimated Smartwatch Revenue Impact as % of Total Apple Revenue |
0.08% |
Source: Counterpoint Research, Khaveen Investments
To assess the impact of Apple’s smartwatch revenue, we first compiled data on its US revenue breakdown in 2022, total revenue, and smartwatch revenue for 2023. We then calculated the smartwatch’s contribution to Apple’s total revenue by dividing the smartwatch revenue by the overall revenue. Next, we estimated the potential impact of smartwatch revenue growth by multiplying the Americas revenue breakdown by the smartwatch percentage of revenue. This percentage impact was then converted into dollar value by multiplying it by the total smartwatch revenue. Finally, we calculated the impact of smartwatch revenue as a percentage of both the wearables segment and Apple’s total revenue, using the estimated smartwatch revenue dollar impact at 0.79% and 0.08% respectively, thus we expect a minimal impact regardless of the smartwatch ban.
Additionally, Apple has reportedly filed an appeal with the U.S. Court of Appeals for the Federal Circuit. Previously, we noted that Apple recently had a favorable outcome related to its patent infringement lawsuit by VirnetX. This is as “the U.S. Court of Appeals for the Federal Circuit affirmed a decision from the U.S. Patent and Trademark Office that invalidated the two patents VirnetX had accused Apple of infringing”, reversing the verdict against Apple. Therefore, we believe Apple may have a chance to succeed in its appeal for its smartwatch infringement lawsuit too and reverse the ban.
CSAM Regulation (Smartphone)
In Australia, Apple has opposed a proposed law (Online Safety Bill) that requires tech companies to scan cloud services for illegal content like child sexual abuse material. However, Apple opposes the proposed rules which could undermine user privacy and security, which we believe Apple has been firm about. Apple halted its plans to implement a CSAM scanning tool in iCloud and on its devices, following widespread privacy concerns in December 2022. Instead of the scanning tool, Apple intends to enhance its communication safety features to prevent the spread of CSAM. Nonetheless, based on our research, we believe Apple would not be at a disadvantage compared to its major competitors such as Samsung, Xiaomi, Huawei, and Google, which we could not identify any CSAM tool utilized in their smartphones.
Smartphone Monopoly Lawsuit
According to the U.S. Office of Public Affairs, Apple is currently facing significant legal pressure from the U.S. Department of Justice, stating that “the complaint, filed in the U.S. District Court for the District of New Jersy, alleges that Apple illegally maintains a monopoly over smartphones by selectively imposing contractual restrictions on, and withholding critical access points from, developers”. In other words, the lawsuit claims that Apple is tightly controlling users with iPhones. For example, the company is accused of undermining the ability of iPhone users to directly send messages to non-iPhone users, as well as difficulties for iPhone to work with non-Apple devices such as smartwatches, which could result in higher prices and anticompetitive practices.
We examined the HHI index which we previously highlighted as “a measure of market competitiveness commonly used by governmental bodies such as the FTC and the Department of Justice in M&A deals. It serves as guidance whether a deal would go through, or antitrust action would be taken depending on the concentration level.”.
|
Global Share |
s (Market Share) |
s^2 |
US Share |
s (Market Share) |
s^2 |
|
Apple |
20.1 |
404 |
Apple |
62 |
3844 |
|
Samsung |
19.4 |
376 |
Samsung |
17 |
289 |
|
Xiaomi |
12.5 |
156 |
Lenovo (OTCPK:LNVGY) |
9 |
81 |
|
Oppo |
8.8 |
77 |
|
3 |
9 |
|
Transsion |
8.1 |
66 |
Other |
9 |
81 |
|
Others |
31 |
961 |
|||
|
Total |
2041 |
Total |
4304 |
Source: Khaveen Investments
Based on the table above, we derived a total score of 2,041 for the global smartphone market and a higher score of 4,304 for the US smartphone market. Given the HHI is above 1,800, this indicates the market is highly concentrated. Moreover, Apple has a stronger and significant lead in the US with a 62% market share. Therefore, our findings indicate that we believe US regulators could block Apple from pursuing acquisitions. Thus, we believe there is a likelihood that US regulators intervene against Apple regarding its practices, such as turning over the current contracts and forcing Apple to open up the unique Apple ecosystem by allowing third-party integration to its tech applications, further requiring the company to make its devices compatible with its key rivals. For instance, Apple in early 2024 was also accused of preventing “rival companies from promoting alternative and cheaper products that could be found outside of Apple’s App Store”, which resulted in Apple being fined approximately $2 bln by the European Union, however, this amounts to just 1.8% of its 2023 net profit.
Outlook
Overall, despite the legal challenges that Apple faces in terms of mounting sales restrictions due to patent infringement, tightening of CSAM regulations and antimonopoly lawsuits, we believe these to only lead to a minimal impact on Apple. For the smartwatch ban, we estimated a low impact of smartwatch revenue as a percentage of both the wearables segment and Apple’s total revenue at 0.79% and 0.08% respectively and a favorable verdict on Apple’s attempts to appeal the ruling may minimize the impact further. Furthermore, we believe the proposed CSAM ruling to have a minimal impact on the company’s business as most of its competitors also do not utilize such tools which may complicate efforts by the government to implement the proposed rules on tech companies. Additionally, we expect the US regulators to pursue cases against Apple’s alleged monopolistic practices, such as requiring Apple to open its ecosystem by integrating third-party applications and making its devices compatible with competitors. This follows regulator crackdowns on large Tech companies such as Google and Facebook. However, we believe Apple’s advantage of its massive loyal customer base may minimize this impact.
Risk: Dependence on OpenAI
We previously highlighted Apple’s own LLM development known as Apple GPT, however, following the recently announced partnership with OpenAI, to leverage ChatGPT powered by OpenAI’s LLMs, we believe Apple has decided to choose to use OpenAI models rather than leverage its own internal developments, which could lead to risks for the company being dependent on OpenAI for its generative AI features as mentioned in the second point.
Valuation
We updated our revenue projections maintaining our previous forecast for the 2nd half of 2024 as we expect the company’s performance to improve compared to the first half amid market recovery in smartphones, tablets and PCs and the expected announcements of its anticipated generative AI features, while accounting for its H1 actual performance for a full year forecast of 3.9%.
Khaveen Investments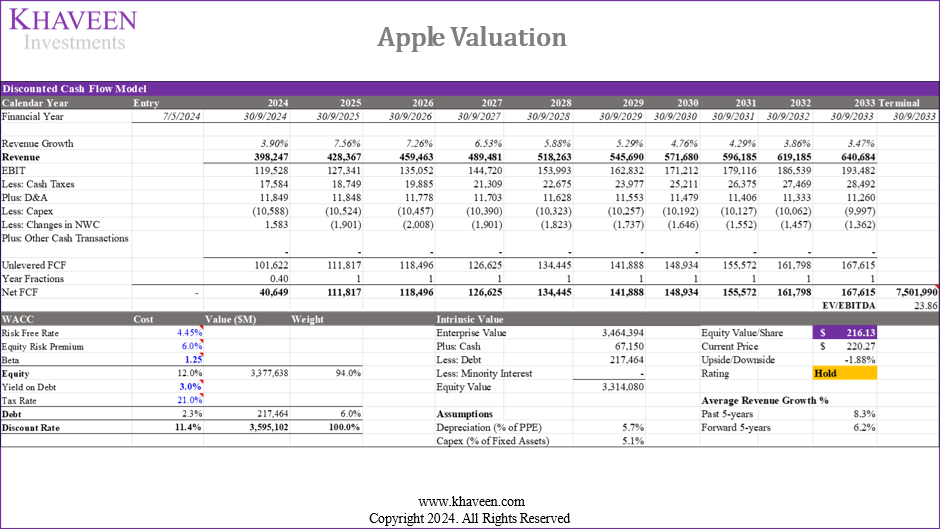
Based on a discount rate of 11.4% and terminal value based on a weighted average EV/EBITDA of 23.86x, our model shows its shares are fairly valued.
|
DCF Valuation Upside |
-1.88% |
|
Stock Buyback Adjustment |
4.3% |
|
Total Upside |
2.43% |
|
Price Target |
$225.63 |
|
Current Price |
$220.27 |
Source: Khaveen Investments
Additionally, we accounted for the company’s stock-buyback impact on our price target upside based on its 10-year average stock buyback % of the market cap of 4.3% from our previous analysis to our revised DCF model, indicating a total upside of 2.43%.
Verdict
In summary, we determined Apple’s weak H1 performance in the iPhone, iPad, and Wearables segments is influenced by 2023’s supply chain disruptions in China and fewer product launches for the Watch and AirPods. While the iPad segment suffered from a lack of new models and a weak tablet market. However, we believe the recent and upcoming product launches for iPad, Watch, and AirPods could support better growth for the remainder of FY2024. Furthermore, we believe the announcement of Apple Intelligence indicates improvements in AI capabilities which could bode well for its competitiveness. Finally, we believe that despite legal challenges, including patent infringement, CSAM regulations, and antimonopoly lawsuits, we expect to have minimal impact on Apple, with the smartwatch ban affecting only 0.08% of total revenue. Apple’s loyal customer base may mitigate the impact of regulatory actions. Overall, we rate the company as a Hold from a Buy rating previously, despite a slightly higher price target of $225.63 ($209.95 previously) which is an upside of only 2.43%, as the company’s stock had rallied by almost 30% since our previous coverage.
Analyst’s Disclosure: I/we have a beneficial long position in the shares of AAPL either through stock ownership, options, or other derivatives. I wrote this article myself, and it expresses my own opinions. I am not receiving compensation for it (other than from Seeking Alpha). I have no business relationship with any company whose stock is mentioned in this article.
No information in this publication is intended as investment, tax, accounting, or legal advice, or as an offer/solicitation to sell or buy. Material provided in this publication is for educational purposes only, and was prepared from sources and data believed to be reliable, but we do not guarantee its accuracy or completeness. This fundamental research and analysis represent one of many investments that we cover.
Seeking Alpha’s Disclosure: Past performance is no guarantee of future results. No recommendation or advice is being given as to whether any investment is suitable for a particular investor. Any views or opinions expressed above may not reflect those of Seeking Alpha as a whole. Seeking Alpha is not a licensed securities dealer, broker or US investment adviser or investment bank. Our analysts are third party authors that include both professional investors and individual investors who may not be licensed or certified by any institute or regulatory body.