Summary:
- Apple has been buying back shares at a record clip regardless of the price of the stock.
- Retained earnings went negative TTM on the Apple Balance sheet.
- The financial engineering extravaganza is helping to shore up earnings per share.
- Apple is a hold at this price until the buyback program is tamped down and the price comes down to meet its Nasdaq brethren.
grinvalds
Apple’s financial engineering
In previous articles I mention the anti-bubble tech portfolio I’m currently going after, but one prominent name is left off the list. Apple (NASDAQ:AAPL), is in all honestly not terribly overvalued compared to the others on my list, but their chart is still defying the gravity that the rest of the Nasdaq has crumbled under. The other item that I am not liking is the balance sheet and buyback program. Buybacks at any price and this excessive rate tell me Apple is out of future growth prospects and ideas. It seems they are prepping to preserve their ROE and EPS guidance by reducing the float. The excessive buybacks at this price have also created a retained earnings accumulated deficit. With Berkshire Hathaway (BRK.A)(BRK.B) being a huge shareholder combined with Warren Buffett’s affinity for retained earnings, the question now is how do they see the future value? Could they consider reducing their position?
My thesis is Apple is a hold. I own some by self-indexing the DJIA but have not recently bought it in any other capacity. Apple needs to reduce its debt and put together a better-looking balance sheet before I’m in for oversized bets. Either that or the price point needs to become more attractive.
The Story up until now
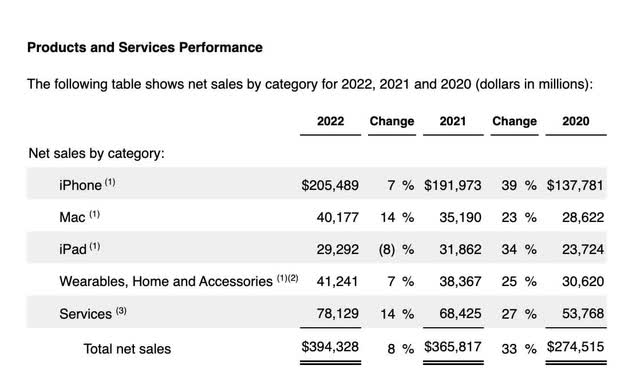
From the most recent 2022 10K, we can see that Apple’s revenues remain grounded in the iPhone, Mac, and iPad, with the iPhone bearing the lion’s share of the burden. The iPad is seeing a decline in sales and all the major products are now seeing much lower yoy revenue increases versus the ultra-hot stay-at-home Covid years. The growth rate was on the order of 4 X larger between 2020-2021 versus 2021-2022.
The story has been, over the last year, one of decreasing growth rates in sales combined with huge share buybacks to possibly compensate for the anticipated difficulty in meeting EPS expectations.
Accumulated deficits
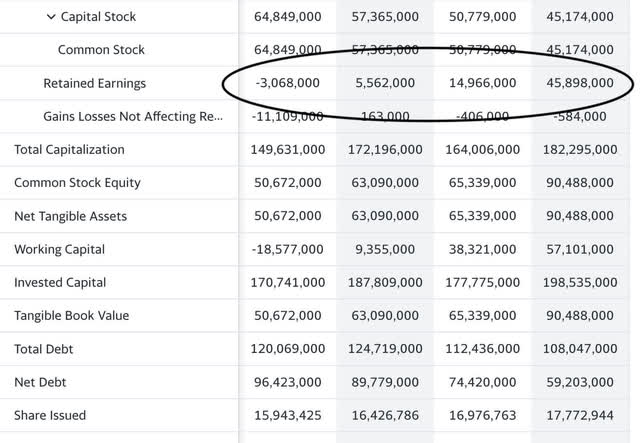
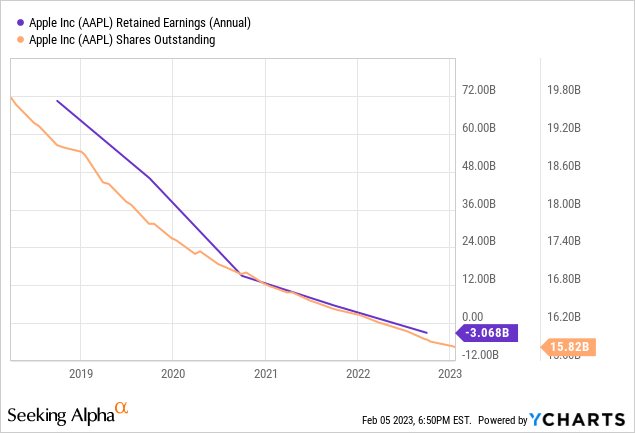
The chart above is the retained earnings line for Apple with 2019 on the far right at $45.898 Billion and 9/30/22 on the left ending at -$3.068 Billion. In this same time frame, nearly 2 Billion shares have been bought back as well. Let’s explore this accounting anomaly and weigh its indications.
A study of accumulated deficits on the balance sheet can be seen here with an example from a University of Oklahoma white paper:
Anecdotally, The Home Depot, Inc., which accounts for stock repurchases as treasury stock repurchases, reported a retained earnings balance of $39.9 billion at the end of its 2017 fiscal year. However, we estimate that it would have reported a retained deficit of $4.6 billion if it had accounted for its stock repurchases as retirement repurchases. In addition, Dell, Inc. reported over $3 billion of repurchases recorded as retirements in 2000 and 2001 and then switched in 2002 to the treasury stock method to account for over $2 billion of repurchases. Dell’s 2002 retained earnings balance of $1.3 billion would have been negative without this change in method.
Furthermore:
Under current financial reporting standards, there are two financial reporting alternatives for stock repurchases: (1) “treasury stock repurchases” and (2) “retirement repurchases”. The primary difference between these two alternatives is that retirement repurchases may reduce reported retained earnings, whereas treasury stock repurchases do not.
Comparative buyback analysis
Below are comparative examples of 3 major tech companies that have all been engaging in buybacks. The statistics are through February 5th, 2023. These charts compare the most recent 5-year trends of retained earnings to shares outstanding. The charts are for Apple, Google (GOOG)(GOOGL) and Meta(META):
By comparison:
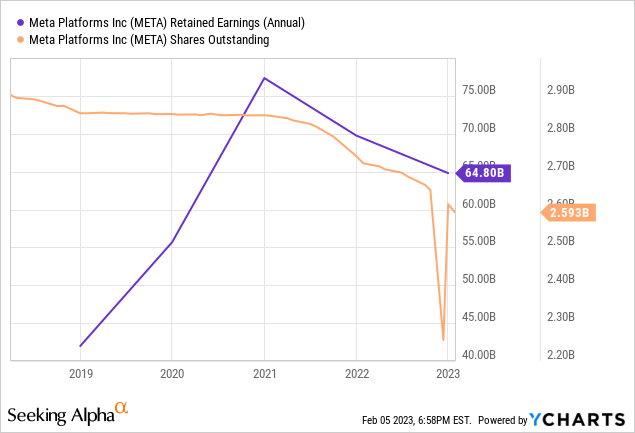
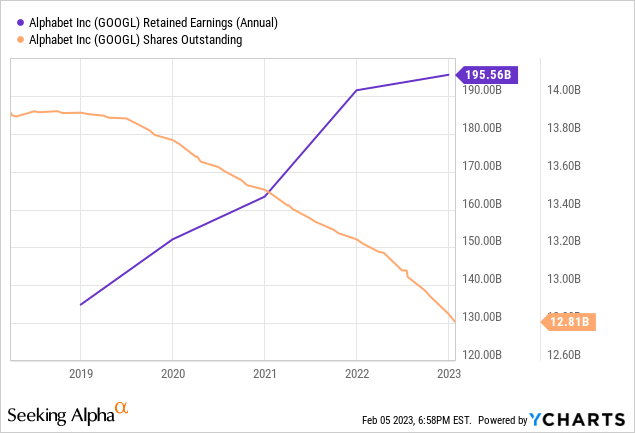
Only Apple dips into an accumulated deficit versus maintaining a positive retained earnings. Some of the above comparative anomalies have to do with the treasury versus retirement method as the hyperlinked white paper lays out. Some also have to do with the purchase price versus the issuance price of the shares with Apple comparatively overpaying. Either way, this retirement buyback program does not seem judicious at a time when Apple could be focusing on diversifying its manufacturing locations to hedge bets against any global turmoil. While Apple is defined as “tech”, it is certainly more sensitive to supply chains than more software-heavy Nasdaq components. The most attractive of the charts is Alphabet, with retained earnings rocketing upwards and share count decreasing.
Apple should be selling stock
One of my favorite back-of-the-napkin cost-of-capital visualization methods I like to use comes from Ken Fisher’s The Only Three Questions That Count. Looking at a stock’s earnings yield as its basic cost of capital for selling stock and then comparing that to the current cost of capital for their bonds using the bond rate X 1-tax rate to get the after tax cost of capital. According to my brokerage, the current bond yield for AAA rated corporates averages 4.44% for maturities between 1-5 years. Apple has an effective tax rate of 16% according to Seeking Alpha. 4.44%X1-.16 = 3.73% would be the rough estimate cost of capital for debt. Apple currently has a forward equity earnings yield of 3.88% which would be a rough estimate of the cost of selling shares.
The cost of capital for both equity and debt is comparable. However, Apple is already overloaded with debt from its financial engineering extravaganza these past 5 years and will need to consider reducing some of that if its credit rating slips or the corporate bond rates continue to float upward. I would rather see them selling shares at high prices than buying them back.
In short, Apple might be borrowing some of the money for buybacks at a 3.73% rate to retire shares with a 3.88% yield. That’s a pretty paltry spread.
Cost of goods sold to revenue ratio
These are direct “hard” costs comparing revenue as a multiple of COGS, associated more so positively with manufacturing than IP-related companies:
Apple is 1.76X
Google is 2.23 X
Meta is 4.64 X
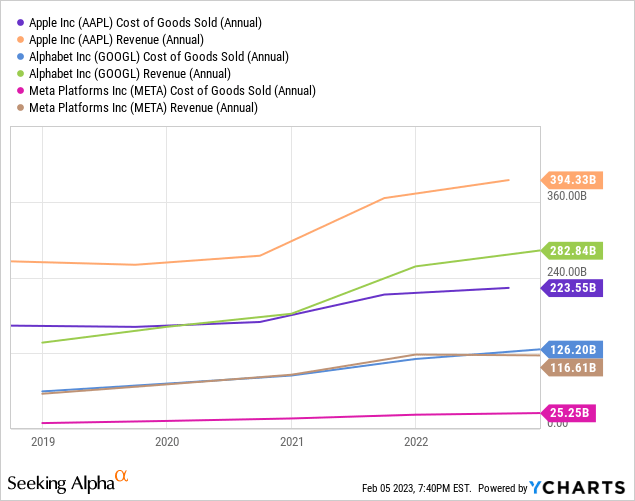
What I am trying to demonstrate here is Apple’s sensitivity to manufacturing as a part of its revenue. Many have argued that Apple should be diversifying as much of its manufacturing as possible with nearly 100% of its products coming from one country. Although Apple has not been an innovator as of late, just retooling their existing products versus trying to come out with new ones, they shouldn’t be underestimating de-globalization. Capital spending on new plants outside of China and possibly dividend increases would be a better use of capital than buybacks at the moment in my opinion. This is especially prevalent when you consider the current equity yield is 3.8%. Their return on invested capital internally could beat that yield with certainty. Heck, even short term cash equivalents will get a higher return than 3.8%.
Valuation
Apple Valuations (SeekingAlpha)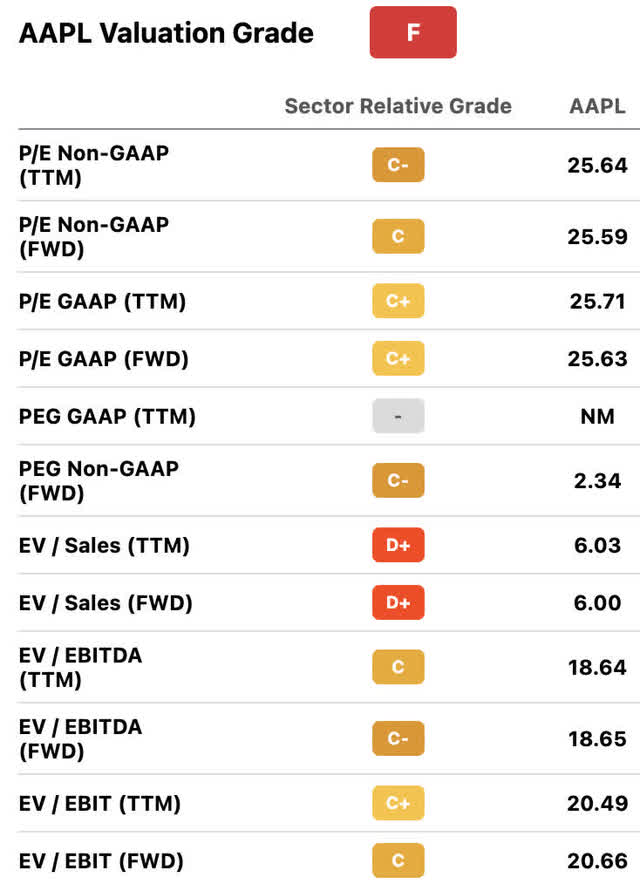
A basic high-level look at their GAAP and Non-GAAP ratios would show a current overvaluation. When it comes to tech, I like to use a PEG ratio incorporating trailing 5-year GAAP or Non-GAAP numbers a ‘la Peter Lynch bumped up by the dividend yield. However, the excessive buybacks at any price tell me that Apple has no good alternatives for its capital. Let’s still take a look at the growth rate and see how the PEG ratio pencils out.
Considering $3.00 per share in 2018 as our beginning number and $6.15 as our 2022 terminal EPS, we get a GAAP CAGR in earnings of 15.4%. Using the TTM EPS of $5.91 as our multiplicand and 15.4+.61(dividend yield)=16.02 as our multiplier gives us a fair value based on GAAP earnings of $94.67. Looking at the PEG based on Non-GAAP numbers using EBITDA, we have a 2018 EBITDA total of $81.8 Billion and a terminal 2022 value of $130.54 Billion. This will show a slower growth rate in EBITDA than GAAP earnings at only 9.8% per annum. The TTM EBITDA per share is $125.28 Billion/15.842 Billion shares=$7.9 in EBITDA per share. This gives us a Non-GAAP value of $82.23 a share incorporating the .61% dividend yield into the Non-GAAP multiplier of 9.8.
This is a strange anomaly amongst the tech giants that normally show a higher EBITDA growth rate and higher PEG ratio valuation based on Non-GAAP versus GAAP. This tells me that Apple is slowly becoming similar to IBM (IBM), which relies more on financial engineering to grow earnings than actual organic growth or effective acquisitions.
The balance sheet
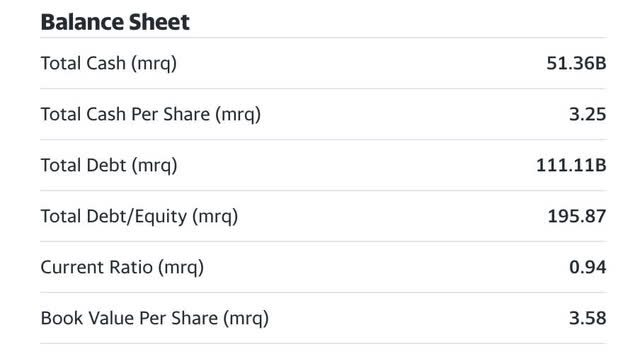
With a cash pile of $51.36 Billion, the current asset position is not too shabby, but not as good as it was either. In 2019 Apple had cash on the balance sheet of $100.5 Billion. cash got cut in half while seeing total debt increase from $108 to $111.11 Billion mrq and net debt increase from $59 to $96 Billion during that same period. This is not a good trend. Peter Lynch advises an attractive balance sheet having the exact opposite criteria. Increasing current assets and decreasing debt. The debt-to-equity ratio now sits at 195.87%. The current ratio is under 1.
Catalysts
If earnings stay flat or stagnate, and the world gets back to normal, peaceful relations that do not threaten Apple’s manufacturing capabilities, an increasing dividend would be interesting. With a big reduction to the share count, Apple now paves the way to institute some legitimate dividend increases. With an indication through the buybacks that Apple has nothing better to do with its capital than buyback shares, the next best thing would be to return cash to the shareholder. With a paltry yield under 1%, Apple would get back on my radar when the yield got closer to 2%. That would be an excellent catalyst in my eyes.
Risks
The de-globalization argument is the biggest in my mind. That and the weight of all the debt on the balance sheet with rising rates could add up to trouble in the future. Apple has a higher sensitivity to manufacturing costs than most other tech giants in the top quintile of the Nasdaq 100 and most of their factory eggs are in one basket to boot. If Apple continues to miss on earnings even after all the buybacks, institutions might start to reallocate where their tech bets reside.
Summary
The accumulated deficit in retained earnings would be fine in my mind if Apple were instituting huge buybacks because the stock was severely undervalued. However, at this valuation, the buybacks and retained earnings deficit seem like more of a value destruction than a creation for shareholders. The products are still the best out there in my opinion. Absolutely every device I work on is an Apple product. However, this is the day that I worried Tim Cook would one day run up against. He is an amazing steward of capital and has done great things to improve upon Steve Jobs’ original creations. But there would come a day when we would need to see a Tim Cook creation led by his team that would define his reign. I’m just not seeing that and the price remains overheated. Hold with a price target of $95 based on a GAAP Peg ratio.
Disclosure: I/we have a beneficial long position in the shares of AAPL, GOOGL, META either through stock ownership, options, or other derivatives. I wrote this article myself, and it expresses my own opinions. I am not receiving compensation for it (other than from Seeking Alpha). I have no business relationship with any company whose stock is mentioned in this article.

