Summary:
- Apple stock prices have been stuck in a $125-$175 consolidation range for more than 2 years now.
- If you have begun to consider it as dead money and are starting to lose patience, this article is for you.
- The lower end of this range offers an excellent entry point for long-term holding, with a very asymmetric return profile.
- And for swing trading, this range actually offers about the same level of volatility as its more exciting days.
Drew Angerer
Thesis
After enjoying a spectacular bull ride between 2020 and 2021, Apple’s (NASDAQ:AAPL) stock prices have been oscillating in a $125~$175 range for almost 3 years now (see the next chart below). You have good reasons to start thinking if it has become dead money.
And this article will show why, for me, this range is a blessing. I only wish it could stay in this range longer, so I can opportunistically keep nibbling here and there. In the remainder of this article, I will detail my analysis of a few key trigger points that could be of interest to both swing traders and also long-term investors. In particular, you will see that:
- For swing traders, this seemingly boring range actually offers as much volatility as its more exciting days. And yet, the valuation multiples are much more reasonable (in a P/E range of about 20x to 28x), which provides better fundamental protection.
- For long-term investors, I will explain why buying AAPL (or any stock with fundamentals similar to AAPL) with P/E close to 20x is a no-brainer. At such multiples, AAPL is projected to offer about 10% annual return, almost double that of the overall market, and close to 3x of treasury bond yields. The risk-adjusted return is even higher, as I consider investment in AAPL to be much safer than in the overall equity market.
Source: Author based on Yahoo! data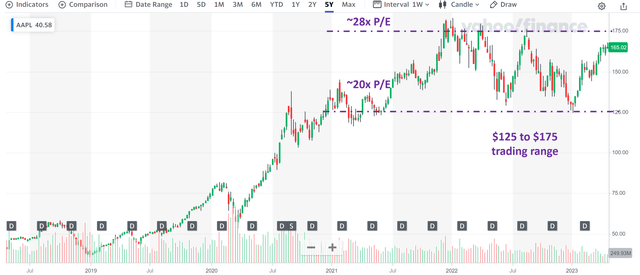
Swing Trading Opportunities
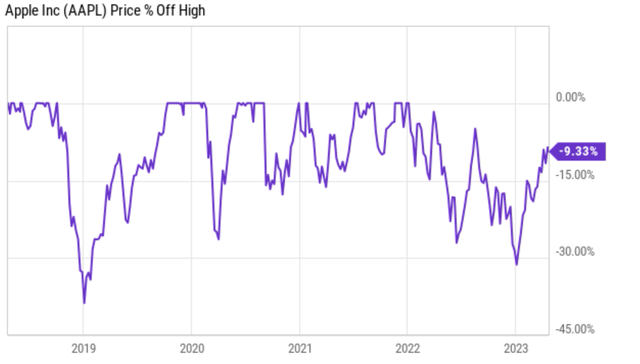
If you are getting bored by the consolidation range, the next chart below might change your mind. The chart shows the stock’s volatility in the past 5 years as measured by its price corrections off high. As seen, the stock has been as volatile in this range as it has been between 2019 and 2022. To wit, the stock is currently 9.3% off its recent peak price. And the stock suffered a correction of 30%+ in early 2023. Off-high corrections close to this magnitude only occurred twice in the past five years: first at the end of 2018 and then in earlier 2023. And in each instance, the stock price rebounded swiftly afterward.
In the meantime, the P/E multiples are also much more reasonable in this price range (corresponding to a P/E range of 20x to 28x), offering much better fundamental protection for the trades. In contrast, the stock was priced in a P/E range of 30 to 40 during 2020 and 2021.
Next, we will see the implications of such P/E multiples for long-term holding.
Stable And Robust Long-term Growth Potential
Investors should not expect – and do not need – hyper-growth at AAPL anymore. In the long term, a healthy but stable growth curve, if bought at the right price, is always more profitable.
And AAPL is one of the best stocks offering these traits. First, it enjoys enviable capital allocation flexibility and yet continues to invest with discipline in its growth. The chart below summarizes the company’s maintenance and growth capital spending (for details on these concepts, refer to my previous article here). As seen, the company’s total depreciation and amortization (“TDA”) has been $11.3 billion on average, while its capital expenditures (CAPEX) have been on average $10.57 billion, BELOW its TDA.
Source: Author based on Yahoo! data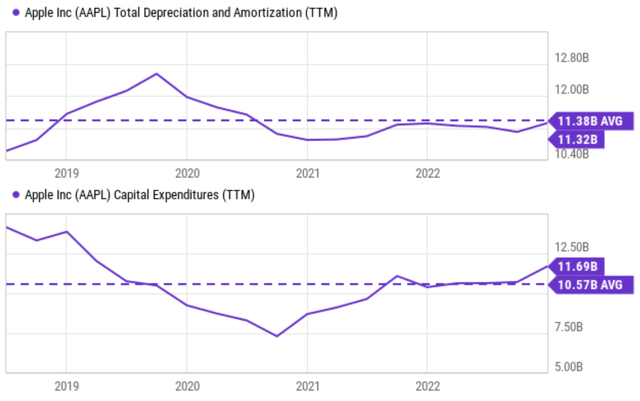
Traditional wisdom is to approximate a business’ maintenance CAPEX by the TDA, then use the difference to approximate its growth CAPEX. Here, AAPL’s total CAPEX is less than its TDA on average. It of course does not mean that AAPL has not been investing in growth (the fact that its EPS has been growing robustly in the past settles this doubt).
The reason is that AAPL’s business model is so good that A) it can offload a good part of its CAPEX to the contractors (Foxconn serves as a notable example) it outsources, B) it uses its existing assets very efficiently, which reduces the need for significant capital expenditure, and C) its return on capital employed (“ROCE”) is so high that even a small amount of growth CAPEX investment can fuel healthy growth. We will elaborate on these points in more detail next.
The $125-175 Range Again
As mentioned earlier, a price range of $125 and $175 translates into a P/E range of about 20x to 28x, which is a much more reasonable range as illustrated by the chart below. In my opinion, this P/E range is very attractive both in relative and absolute terms. To put this into perspective, AAPL has been trading at an average P/E of 25.5x as shown below and the overall market (approximated by the S&P 500) is valued at around 22x P/E as of this writing.
Source: Author based on Yahoo! data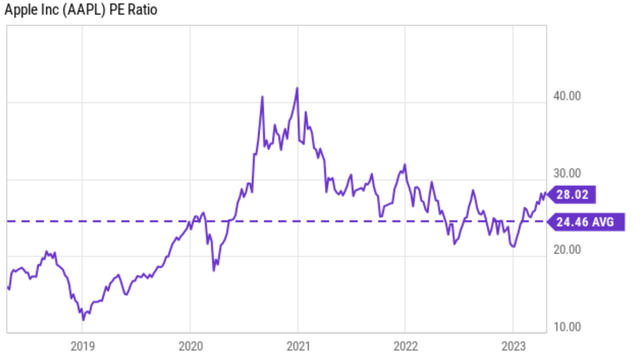
And as aforementioned, AAPL’s business model is such that it does not need too much maintenance CAPEX. As a result, a good part of its total CAPEX is actually growth CAPEX so that its owners’ earnings (“OE”) are much higher than its accounting EPS.
The table below shows my estimate of AAPL’s FWD OE, in comparison to its accounting EPS and cash flows. The table was made following Greenwald’s method (detailed in my earlier article or Greenwald’s book, Value Investing). As seen, my estimate of AAPL’s OE exceeds its accounting EPS ($6.39 vs $6.15), which in turn exceeds its free cash flow (FCF, $6.05). The fact that its accounting EPS exceeds its FCF consistently already provides a sign that the accounting EPS underestimates its true earning power.
Source: Author based on Yahoo! data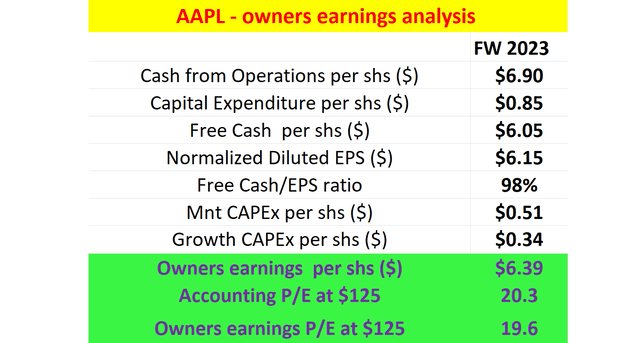
As such, in this price range, its true P/E is even below what is on the surface. At the lower end of this range, a price of $125 corresponds to an owner’s earnings P/E of only 19.6x as shown. A stock with AAPL’s profitability is a no-brainer at valuations below 20x P/E. With a ROCE in the 80% to 90% range, a 5% investment rate would result in 4% to 5% organic real growth rates (before inflation adjustments). An owners’ P/E ratio of 20x provides a 5% owners’ earnings yield, leading to a total return in the double digits (again without any inflation escalator).
The next chart below puts the above in a broader context. As seen, AAPL is expected to offer approximately 10% annual return (“ROI”) in the long run at an entry price of $125 and about 8% at a price of $175. In contrast, the overall market is estimated to provide less than 6% of ROI in the long run due to its much lower ROCE and about the same P/E.
Source: Author based on Yahoo! data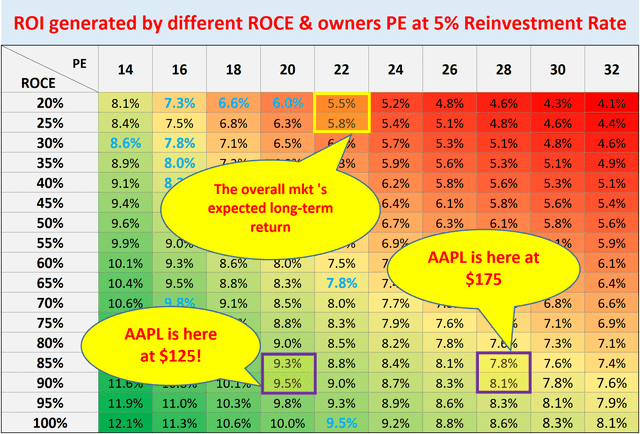
Risks And Final Thoughts
Apple faces several ongoing headwinds. Sales for the more recent quarter were down 5%, while earnings declined a little over 10%. Unfavorable currency effects played a major role, trimming the top line by 8%. Additionally, COVID-19-related disruptions crimped the supply of Pro and Pro Max iPhones. As a result, sales of the flagship smartphone fell by about 8%. Inflation and the war in Ukraine also weighed on results. These uncertainties are capsulated in the large variance in consensus estimates shown below. For instance, the consensus EPS for 2023 ranges from $5.38 to $6.40, a variance of 19%. The variance further widens to 27% for 2024 and 2025.
These headwinds are likely to keep its stock price range bound in the near term. And the thesis is precise that such a consolidation range is not a bad thing for AAPL investors, either short-term or long-term investors. For swing traders, a $125 to $175 range offers as much volatility as its more exciting days in a more reasonable P/E range. And for long-term investors, AAPL is projected to offer far superior return potential than the overall equity (or bond) market.
Source: Author based on Seeking Alpha data
Analyst’s Disclosure: I/we have a beneficial long position in the shares of AAPL either through stock ownership, options, or other derivatives. I wrote this article myself, and it expresses my own opinions. I am not receiving compensation for it (other than from Seeking Alpha). I have no business relationship with any company whose stock is mentioned in this article.
Seeking Alpha’s Disclosure: Past performance is no guarantee of future results. No recommendation or advice is being given as to whether any investment is suitable for a particular investor. Any views or opinions expressed above may not reflect those of Seeking Alpha as a whole. Seeking Alpha is not a licensed securities dealer, broker or US investment adviser or investment bank. Our analysts are third party authors that include both professional investors and individual investors who may not be licensed or certified by any institute or regulatory body.
As you can tell, our core style is to provide actionable and unambiguous ideas from our independent research. If your share this investment style, check out Envision Early Retirement. It provides at least 1x in-depth articles per week on such ideas.
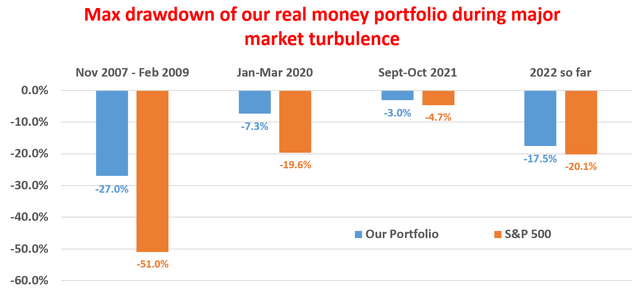
We have helped our members not only to beat S&P 500 but also avoid heavy drawdowns despite the extreme volatilities in BOTH the equity AND bond market.
Join for a 100% Risk-Free trial and see if our proven method can help you too.
