Summary:
- Apple records a slight beat on quarterly estimates, with earnings of $1.53 per share and revenues of $90.75 billion.
- However, areas of weakness remain evident with iPhone sales declining by approximately -10% and revenue in China dropping by -8%.
- Technical indicators suggest potential further declines in Apple’s stock price, but we believe support could be seen just above the $150 level.
S_Z
Apple, Inc. (NASDAQ:AAPL) was largely able to quell market fears into the end of last week, as the iPhone producer released a quarterly earnings report that slightly beat prior estimates (both in terms of income and revenue) and announced the largest share buyback program in the company’s history. But while these results technically fall into “positive surprise” territory, investors must understand that key areas of weakness are already becoming apparent – and while the company did announce share buybacks of $110 billion, we believe that Apple’s $0.01 dividend increase might not be enough to prevent the stock from moving lower.
On the upside, quarterly earnings were recorded at $1.53 per share ($23.64 billion), modestly surpassing consensus estimates of $1.50 per share – which implies annualized declines of -2% relative to the $24.16 billion figure that was reported during the same period last year. Revenues were recorded at $90.75 billion, which also surpassed consensus estimates of $90.01 billion, but this implies an annualized decline of -4.3% for the period. Significant highlights were seen in the company’s services segment (which includes payments, warranties, subscriptions, and search engine licensing), where sales figures posted at $23.9 billion (indicating gains of +14.2% for the period) and Apple’s paid-subscriptions figure has surpassed the 1 billion milestone.
On the downside, iPhone sales posted at $45.96 billion (roughly in line with the consensus estimates of $46 billion), which marks an annualized decline of roughly -10%. Management has explained that these declines were negatively influenced by supply chain issues that postponed iPhone 14 shipments and distorted Apple’s reported sales figures during the prior-year period. But perhaps more concerning is Apple’s deteriorating relationship with Chinese consumers. China is Apple’s third-biggest market and the company’s revenue figures for the period posted at $16.37 billion – but while this performance did manage to surpass analyst estimates ($15.25 billion) these results indicate broad declines of -8% for the period. Overall, this performance does suggest that Apple’s products are becoming less attractive to Chinese consumers, and it is becoming very difficult to argue that the company will be able to maintain its superior status as a primary choice for luxury consumer electronics products in the region.
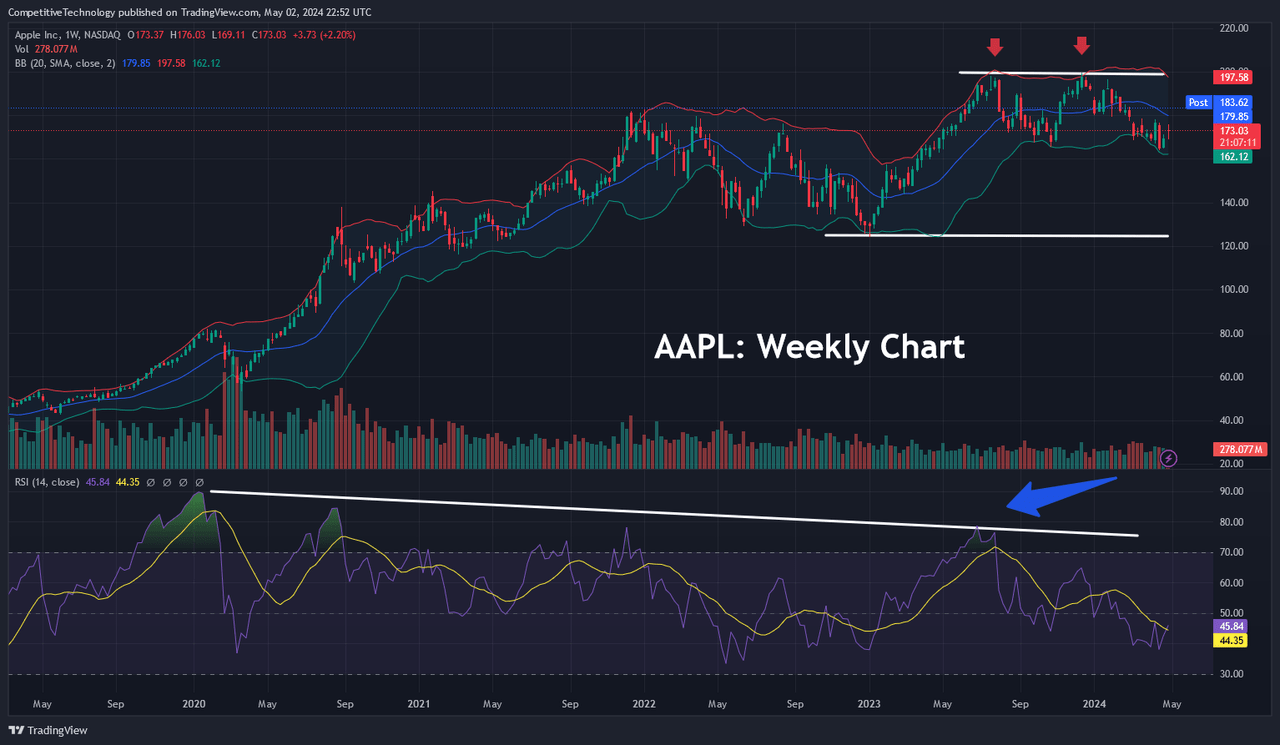
AAPL: Double-Top Resistance Zone (Income Generator via TradingView)
On the weekly charts, we can see evidence of weakness that could send share prices lower after the company posted long-term highs of $199.62 in December 2023. As we can see in this weekly price history, the sub-$200 price zone was tested on two separate occasions – and the resulting downtrend has posted lower lows following each failure. Specifically, AAPL share prices fell to lows of $165.67 in October 2023 after failing to break the $200 level the first time in July 2023.
Later, this important support zone ($165.67) was invalidated after share prices failed during the second test of resistance near $200, ultimately falling to new lows of $164.08 in April 2024. Essentially, what we have on the weekly charts is a double-top resistance zone that has resulted in lower lows following failures at a major psychological level ($200). In addition to this, weekly indicator readings in the Relative Strength Index (RSI) are heavily bearish (and have possessed this characteristic for an extended period of time). Since these readings are nowhere near oversold territory (they are actually near the mid-point of the histogram), the balance of the evidence suggests that AAPL share prices could fall further before the downtrend becomes overextended.
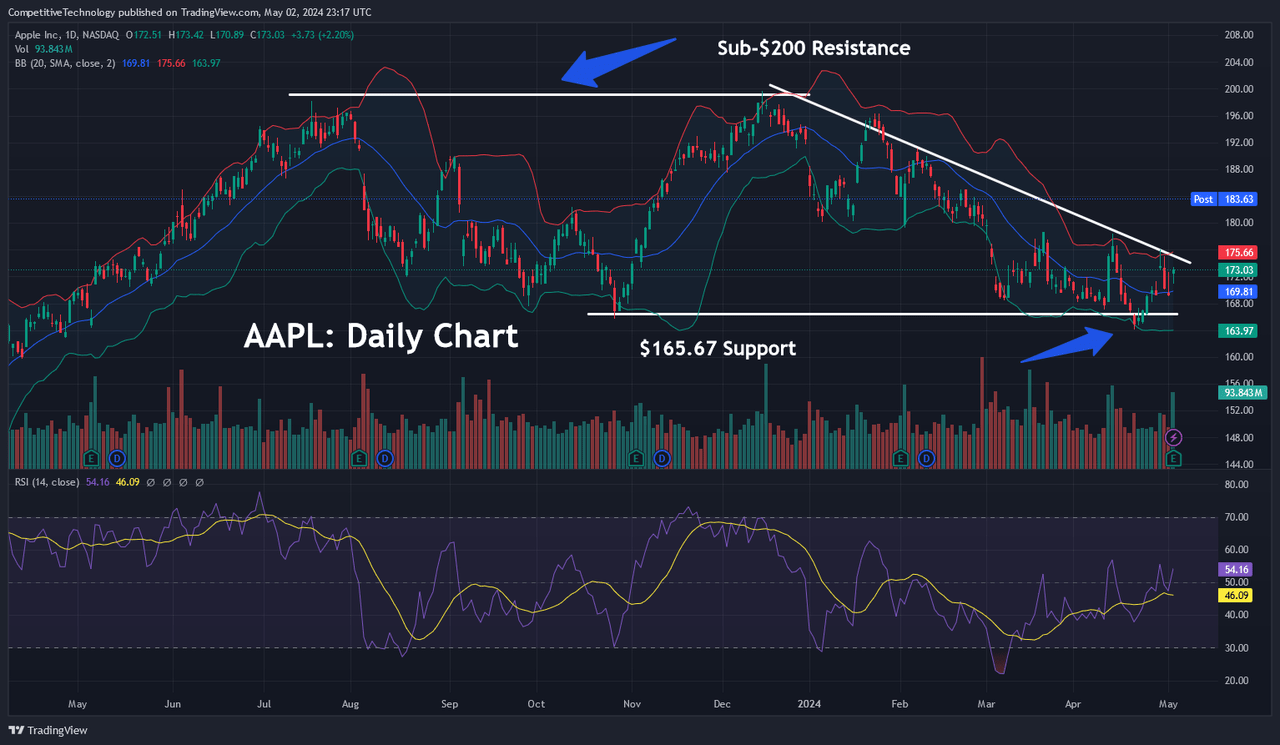
AAPL: Historical Support Zone Breaks (Income Generator via TradingView)
In the chart above, we have a daily price history in AAPL shares to take a closer look at the aforementioned support resistance levels. In this case, the RSI reading is also printing near the mid-point of the histogram, so there is very little evidence here to suggest that markets will be able to find strong support in these regions near-term. If we do expect to see AAPL share prices heading lower, we will need to identify price levels that have the potential to work as support and contain further selling pressure going forward.
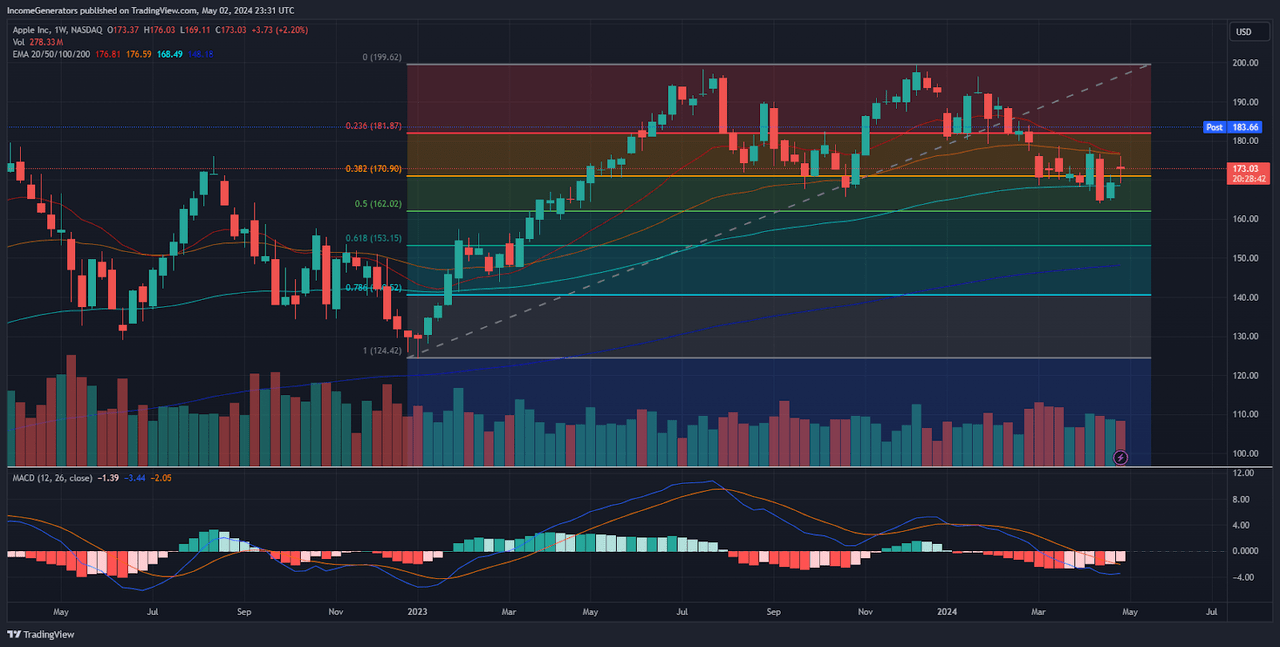
AAPL: Fibonacci Retracement Levels (Income Generator via TradingView)
To accomplish this, we can use Fibonacci retracement levels to better understand where current price action rests in terms of the dominant historical price trend. If we analyze the stock’s price moves from the $124.17 lows (recorded in January 2023) to the ultimate price highs of $199.62 (December 2023), we can see that both the 23.6% and 38.2% Fibonacci retracement levels have already been broken (which is a highly bullish signal on its own). But when we combine this with the fact that historical support zones have already broken to lower lows and the Moving Average Convergence Divergence (MACD) indicator has recently crossed into bearish territory – the negative outlook really begins to intensify.
Moreover, this price history shows that AAPL has already fallen through its 20-week, 50-week, and 100-week exponential moving averages, so it is very difficult to make bullish arguments for this stock at current levels. The 50% retracement of AAPL’s dominant price move currently rests near $162, but we cannot identify any other indicators in this area which point to this zone as a potential level of strong support. Below here, the 61.8% Fibonacci retracement of the aforementioned move is located slightly above the $153 level, and this price zone does rest within close proximity to the rising 200-period moving average on the weekly charts (adding to its potential validity and significance).
Since declines toward this region would almost certainly send indicator readings into oversold territory, we believe that this level (just above psychological support at $150) can be used as a downside target to add to long positions in the event that selling pressure in AAPL begins to accelerate. Overall, we do see evidence of weakness in the company’s most recent earnings report and strong potential for Apple to continue losing market share to Huawei and other Chinese competitors. When we add this long list of bearish technical influences to this equation, the outlook for share prices starts to look quite discouraging. Since we did see a slight quarterly beat on EPS estimates, we believe that share prices should find technical support above the $150 level and that the stock will become a better buying opportunity at lower levels.
Analyst’s Disclosure: I/we have a beneficial long position in the shares of AAPL either through stock ownership, options, or other derivatives. I wrote this article myself, and it expresses my own opinions. I am not receiving compensation for it (other than from Seeking Alpha). I have no business relationship with any company whose stock is mentioned in this article.
Seeking Alpha’s Disclosure: Past performance is no guarantee of future results. No recommendation or advice is being given as to whether any investment is suitable for a particular investor. Any views or opinions expressed above may not reflect those of Seeking Alpha as a whole. Seeking Alpha is not a licensed securities dealer, broker or US investment adviser or investment bank. Our analysts are third party authors that include both professional investors and individual investors who may not be licensed or certified by any institute or regulatory body.
