Summary:
- Apple should be in everybody’s portfolio, no matter at what stage of life or age.
- Technical set-up is positive-neutral to positive, in expectation of short- and mid-term solutions to macroeconomic challenges.
- Price is close to all-high but this is where you want it to be.
Nikada/iStock Unreleased via Getty Images
Investment Thesis
In my opinion, Apple Inc. (NASDAQ:AAPL) should be in everybody’s portfolio, no matter at what stage of life or age you are. Of course, the question is when to buy it. Therefore, while I present both the tailwinds and headwinds of the business, I will focus in this article on the technical analysis signals for the Buy recommendation that I am making.
Tailwinds
When you think of Apple, Inc. you think of three things and one person. Brand. Stickiness. Integrated system. Steve Jobs. Ok, Tim Cook is a great CEO, but the company’s, and perhaps American innovation history’s, greatest legend is Jobs. In the connected world, people are divided between Apple people and Samsung people. I must admit I am a part of the latter, but I have many friends and colleagues who belong to the other tribe and I completely understand their loyalty to Apple.
Rumors of Samsung switching its default search engine from Google (GOOG) (GOOGL) to Microsoft’s (MSFT) Bing suggest that Apple will get more negotiating power over the contract with Google. An article from Business Insider quotes the estimates from Bank of America that Samsung’s threat to replace Google Search with Bing across its devices could benefit Apple by more bargaining power to better monetize over 2 billion active Apple devices (NB. the number of users milestone was underlined during the Q1 2023 earnings call by Cook).
Apple is also one of the top picks of Berkshire Hathaway (BRK.A) (BRK.B), which is the third biggest institutional owner of the company. For Q4 of 2022, Berkshire Hathaway added nearly 334 thousand shares. The transactions for the Q1 of 2023 are to become public in a couple of weeks. A much bigger addition in Q4 2022 was made by Morgan Stanley which purchased nearly 26 million shares, much more than Vanguard or BlackRock combined, two biggest owners of AAPL via the multiple ETFs. Similarly, a big purchase was made by Norges Bank, the central bank of Norway.
On another note, Apple entered a US market for bank deposits by partnering with Goldman Sachs, offering a high-interest (4.15%) savings account for Apple Card holders. Apple has also just begun a 10-year partnership with Major League Soccer. MLS Season Pass was launched in February, which will give fans in more than 100 countries access to every live MLS regular season game as well as the playoffs and MLS Cup.
The company has also introduced new MacBook Pro models powered by Apple chips M2 Pro and M2 Max, boasting an unprecedented performance while using less energy, resulting in the longest battery life ever in a Mac.
Fundamentally speaking, Apple has very strong margins even despite foreign currency challenges. As summarized by Luca Maestri, CFO:
“Company gross margin was 43%, up 70 basis points from last quarter due to leverage and favorable mix, partially offset by foreign exchange. Products gross margin was 37%, up 240 basis points sequentially. And Services gross margin was 70.8%, up 30 basis points sequentially, both due to the same factors that impacted total company gross margin.”
Headwinds
Many Seeking Alpha contributors have underlined the rich valuations of Apple and described in detail various ratios suggesting a conclusion that Apple stock has a low to the null upside. At some points in time, also lower valuations were also deemed all-time highs but this did not stop the stock price to rise.
Similarly, the expansion to India is moderated by the fact of steep prices of the devices in developing markets. On the side, one of my beliefs is “Nothing sells better than luxury” and many brands can attest to this.
It is true that the macroeconomic conditions are not perfect and they resulted in a weak performance in some of the sectors in Q1 2023, as reported in the earnings call on Feb, 2:
-
Revenue of $117.2 billion, down 5% year-over-year, with foreign exchange headwinds, which cost Apple nearly 800 basis points,
-
Supply problems of iPhone 14 Pro and iPhone 14 Pro Max,
-
iPhone revenue came in at $65.8 billion for the quarter, down 8% year-over-year,
-
Revenue for Wearables, Home and Accessories was $13.5 billion, which was down 8% year-over-year.
However, more positive results were recorded in the following areas:
-
iPad revenue grew 30% to a total of $9.4 billion,
-
Apple achieved an all-time revenue record of $20.8 billion in services, powered by double-digit revenue growth from App Store subscriptions, and set all-time revenue records across a number of categories, including cloud and payment services
-
In emerging markets, the installed base grew by double digits, and with record levels of switchers in India and in Mexico.
Overall, the mix of Apple’s innovation and strong management are currently being challenged by the macroeconomic circumstances, but the long-term profitability and Apple’s market position seem at the moment to be solid unless a powerful disruption appears on an economic or technological dimension.
Explanation of My Technical Analysis Toolbox
I will analyze Apple from a perspective of a number of technical analysis tools and show the screenshots on the monthly and weekly Heikin Ashi candles charts – each timeframe presented through two separate sets of indicators – which I will complement with a simplified daily Renko chart to reflect the short-term price momentum
The first chart setup (I will call it Chart 1) uses Bill William’s Alligator indicator and Awesome Oscillator, as well as Ichimoku Clouds and On Balance Volume indicator line. For fundamentals, I show the quarterly revenue trend which I use for quick visual triage.
The Alligator technical analysis tool uses three smoothed moving averages that are based on thirteen, eight, and five periods, called also Jaw (blue line), Teeth (red line), and Lips (green line), respectively. Due to the smoothing of each moving average, the Jaw makes the slowest turns and the Lips make the fastest turns. The Lips crossing down through the other lines signals a short opportunity while crossing upward signals a buying opportunity.
William’s Awesome Oscillator (AO) is a market momentum tool that visualizes a histogram of two moving averages, calculated on median prices of a recent number of periods compared to the momentum of a larger number of previous periods. If the AO histogram is crossing above the zero line, that’s indicative of bullish momentum. Conversely, when it crosses below zero, it may indicate bearish momentum.
As for the Ichimoku Cloud – I am not using a full set of lines of Ichimoku lines, only the Leading Spans A and B, whose crosses dictates the color of the cloud and whose individual lines provide levels of the strongest support and resistance lines. Ichimoku averages are plotted into the future which in its own right provides a clearer picture but have no predictive powers.
On-Balance-Volume (OBV) indicator is a volume-based tool and is supposed to indicate the crowd sentiment about the price. OBV provides a running total of an asset’s trading volume and indicates whether this volume is flowing in or out, especially when viewed in divergence with the price action.
The second chart setting (Chart 2) uses 2 moving averages (10- and 50-period), volume, and volume’s 20-period average. On the screenshot from top to bottom, you will see the Composite Index Divergence Indicator (CIDI), which I learned from the book of Constance Brown, as well as J. Welles Wilder’s Directional Movement Indicator (DMI). I also use MACD (Moving Average Convergence Divergence) which is well known to everybody: I seek crossovers of MACD and signal, as well as above/below the zero level.
CIDI comes from a combination of RSI with the Momentum indicator. For more literature, see Brown’s paper or read her book. CIDI has been developed to solve the problem of RSI not being able to show divergence. I personally use the CIDI’s crossover above and below its slow and fast-moving averages, as well as the position of the averages against each other.
As for DMI, I skip the ADX line because it doesn’t give me anything. Instead, I focus on the crossovers of the Positive Direction Indicator DI+ and Negative Direction Indicator DI-. When the DI+ is above DI-, the current price momentum is upwards. When the DI- is above DI+, the current price momentum is downwards.
On the use of Heikin Ashi candles and Renko boxes, I use them as tools for trend reversal and continuation identification. Renko charts do not have a time scale and they are built on price movements that must be big enough to create a new box or brick. Similar to Heikin Ashi, Renko charts filter the noise.
The Long-Term Trend
For the long-term trend analysis, I use monthly charts. As we see in Chart 1, there are already three green monthly Heiking Ashi candles and the one of April opened above all the three mines of Alligator. The Lips line (green) has crossed above the Teeth (red) line and all three lines are trending upwards. The upper edge of the green Ichimoku Cloud establishes a solid S/R line at the level of $150. We can see that the monthly Awesome Oscillator has turned green at a still very low (however, positive) level and is comparable to the AO levels in mid-2019. The On-Balance-Volume line makes a peak that is still below the highs of March 2022, so this is still a threshold to breach. The bottom panel indicates the revenue trend, which is a part of this chart view.
Chart 1 – Monthly (TradingView)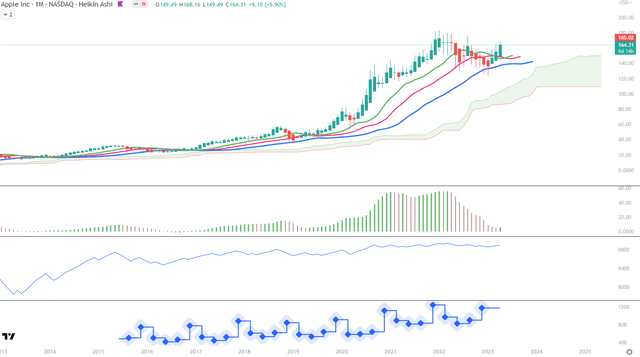
In Chart 2 we see that the April candle started on top of the 10-month Moving Average, which has also made an upwards turn. The 50-month MA is steadily rising. The CIDI line has crossed both its fast (green) and slow (orange) moving averages and the fast average seems to be bottoming. The momentum indicator setup could mean a beginning of an uptrend. The monthly MACD is making an upwards turn and can possibly cross above its signal within the next two months. We can also appreciate that the DI+ line, above the DI- line, has picked up and maybe open another long-term uptrend period.
Chart 2 – Monthly (TradingView)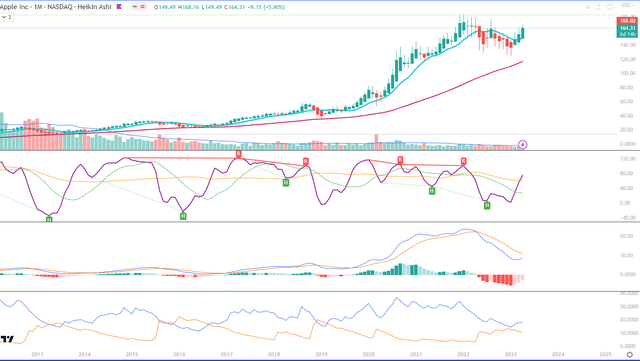
The Mid-Term Trend
For the mid-term trend analysis, I use weekly charts. As we can see in Chart 1, quite a strong S/R line establishes itself around the upper edge of the red Ichimoku Cloud which started in December 2022. I drew a horizontal line at the level of $157, slightly above the Cloud in order to catch some of the wicks of green candles which touched this level. We can appreciate that in this timeframe, the red Cloud is turning now to green, as well as all the Alligator’s lines are trending upwards. The weekly AO has been green and positive since the end of February. OBV line has been rising steadily, without abrupt turns. I would expect the current mid-term uptrend to continue up to $170 and correct back to the S/R line, or rise up to $173-176 but then correct to a slightly higher S/R, possibly around $163.
Chart 1 – Weekly (TradingView)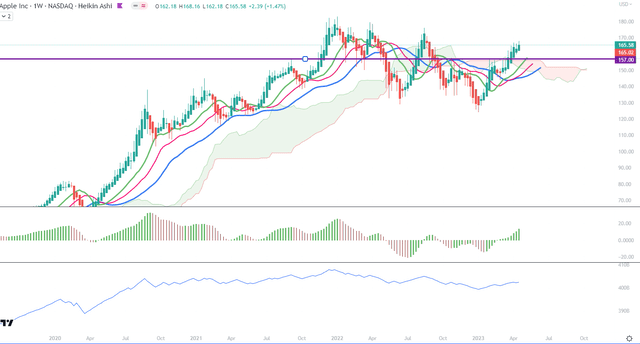
For Chart 2, we can see that the 10-week MA has crossed over the 50-week MA and the latter seems to flatten. The CIDI line indicates here that a correction I have mentioned above can arrive sooner rather than later since it has flattened on the top and is approaching the fast average from above. However, it can also remain flat for some time, while the price trends upward. The weekly MACD line and its signal have both crossed above the zero level and are trending upwards. While CIDI may be noisier, I expect MACD to remain above the zero level. The DI+ line is above the DI- line and it has taken an upwards turn.
Chart 2 – Weekly (TradingView)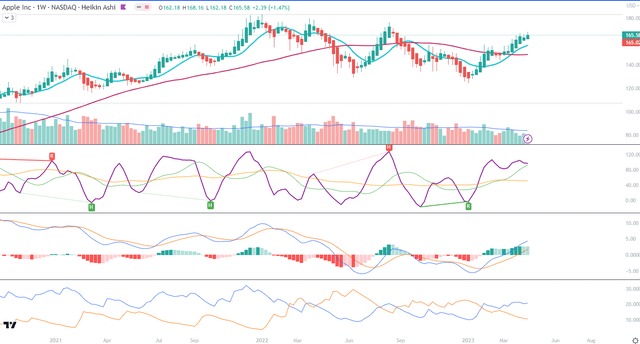
Price Momentum
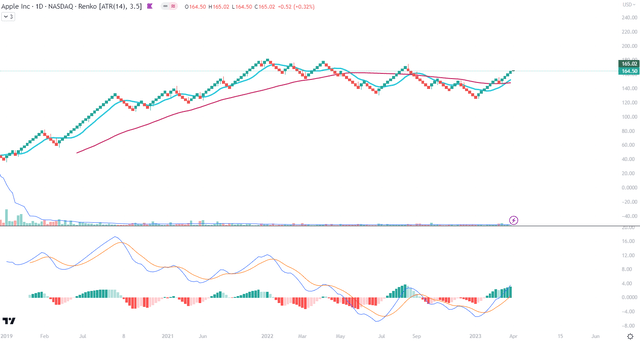
The Renko chart is, according to me, the most convincing picture of a momentum build-up. The 10-box MA has crossed above the 50-box MA while MACD and its signal have both moved above the zero level.
Conclusion
I consider Apple to be a Buy due to its multiple and innovative ways of generating revenue and weathering the macroeconomic storms. I believe that the stock will deserve a Strong Buy once the global situation improves and solves the supply and FX challenges. Long-term, Apple is a brand of status for emerging markets’ growing middle class. Although not an Apple device owner myself, I plan to purchase the stock for my buy-and-hold portfolio.
Analyst’s Disclosure: I/we have no stock, option or similar derivative position in any of the companies mentioned, but may initiate a beneficial Short position through short-selling of the stock, or purchase of put options or similar derivatives in AAPL over the next 72 hours. I wrote this article myself, and it expresses my own opinions. I am not receiving compensation for it (other than from Seeking Alpha). I have no business relationship with any company whose stock is mentioned in this article.
Seeking Alpha’s Disclosure: Past performance is no guarantee of future results. No recommendation or advice is being given as to whether any investment is suitable for a particular investor. Any views or opinions expressed above may not reflect those of Seeking Alpha as a whole. Seeking Alpha is not a licensed securities dealer, broker or US investment adviser or investment bank. Our analysts are third party authors that include both professional investors and individual investors who may not be licensed or certified by any institute or regulatory body.

