
Summary:
- Applying the Growth-Share Matrix analysis to Apple Inc.’s product and service offerings, we can conclude that its products are cash-generative cash cows while its services are high-growth question marks.
- Products usually enjoy a high market share with low growth, while services have a low market share but the potential for higher growth.
- Apple Watch is the sole star of the company, enjoying a high market share combined with strong market growth.
- In order for Apple to continue its growth journey, it needs to turn some of its question marks into stars in the future. Some potential candidates are HomePod Mini and Apple Music.
- Although Apple is a great business, the valuation looks rich at over 29x P/E (over 20% overvalued), which is why I rate Apple a sell.
Rocky89/iStock via Getty Images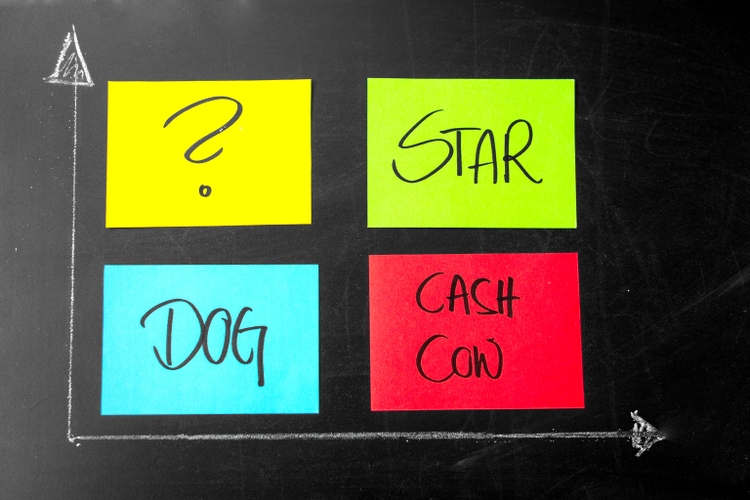
Cash Cows, Stars, Questions Marks and Dogs
Apple Inc. (NASDAQ:AAPL), being one of the world’s largest companies, is active in various product and service segments. Most of their products/services are profitable with high margins. Apple enjoys a high market share in most of these segments although more so in their product categories than in their service offerings as we’ll see later.
In this article, I have analyzed the markets that Apple operates in and identified the ones where the market is still growing and where Apple still has room to take market share. These are classified as question marks in the Growth-Share framework I have applied in the article. I also go through Apple’s Stars and Cash Cows. Fortunately, I couldn’t identify any Dogs. Below is a short description of the different categories:
- Dogs: Products/services where the company has a low market share and the market is expected to experience low growth
- Question marks: Products/services where the respective markets are experiencing high growth but where the company has a low market share i.e. it’s not sure whether it will be successful yet.
- Stars: Markets that experience high growth and where the company has a high market share i.e. the growth segments where the company is expected to reap the benefits of the growth
- Cash cows: Markets that have become saturated where the company has a high market share. These are the products that generate excess cash that the company can invest in the question marks or potentially pay back to shareholders in the form of dividends and/or share buybacks (which Apple has done as well).
As a brief recap, Apple categorizes its operations into two segments which are products (80% of sales) and services (20% of sales). The Products segment can be further split into product categories. These are iPhone, Mac, iPad, Wearables, Home and Accessories. The Services segment consists of sales derived from digital content (e.g., App Store and streaming services), advertising, AppleCare, cloud services and payment services. Despite some of these sub-segments being individually fairly large on their own, Apple reports everything in a single segment. I believe they will split this segment into smaller sub-segments at some point when they have grown a bit larger.
Sales split by segment and sub-segment (Company financial statements, analyst)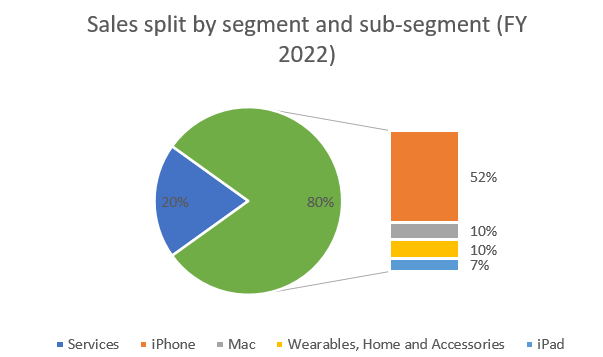
In the next sections, I’ll go through each product/service segment’s market size, expected growth rates and Apple’s market share in this specific segment.
Smartphones (iPhone)
The smartphone market has been dominated by Apple and Samsung since Nokia’s decline about a decade ago. Notably, Apple took the market leader position from Samsung at the beginning of 2023 and now has a market share of about 31% against Samsung’s 26%. The shares can vary quite a lot when the companies release new product versions. The 5% differential between the two competitors may decrease as the year progresses. GS Statcounter doesn’t disclose whether they measure the mobile market share in sales or units shipped. The key takeaway from the graph is, however, that Apple is one of the market leaders and has strengthened its market position in 2023 compared to Samsung.
Mobile Vendor Market Share Worldwide (GS Statcounter)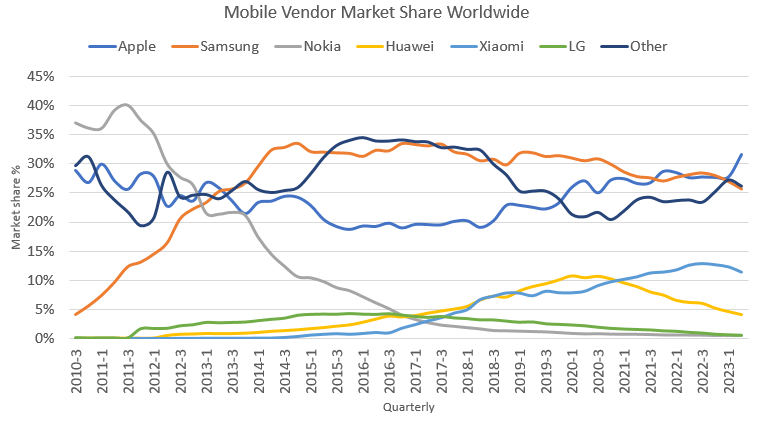
The global smartphone market was about $450 billion in size according to Statista when measured in year 2022 sales. Dividing Apple’s iPhone sales of $205 billion with this figure results in a market share of 46% which leads me to believe GS Statcounter reports market share by units sold or then either Statista’s or GS Statcounter’s data is wrong. The conclusions I made in the preceding paragraph still hold true: Apple is one of the market leaders with a strong market position.
Statista forecasts the smartphone market to grow to $540 billion by the year 2028, equivalent to a 3.1% CAGR. Fortune Business Insights, on the other hand, forecasts the market to grow to $793 billion by 2029, equivalent to a 7.3% CAGR. Your guess is as good as mine on which of these to believe, but I suppose an average of the two could be reasonable to expect, i.e., 5% growth p.a. Unless Apple is able to take an even larger slice of the pie, it’s prudent to expect slower growth of iPhone sales than have been experienced in the recent years. This product is categorized as a Cash cow.
Desktop Operating Systems/Personal Computers (OS X/Mac)
The desktop operating system market can be characterized as a fairly concentrated market with Microsoft’s Windows being the market leader with a wide margin. Microsoft sells its operating system (software) to personal computer manufacturers (hardware) and has become the industry standard. Apple’s OS X which is mostly used on its Mac products is the runner-up. Apple and new players in the Other category have been taking market share from the market leader Microsoft (Windows) as can be seen in the graph below.
Desktop Operating System Market Share Worldwide (GS Statcounter)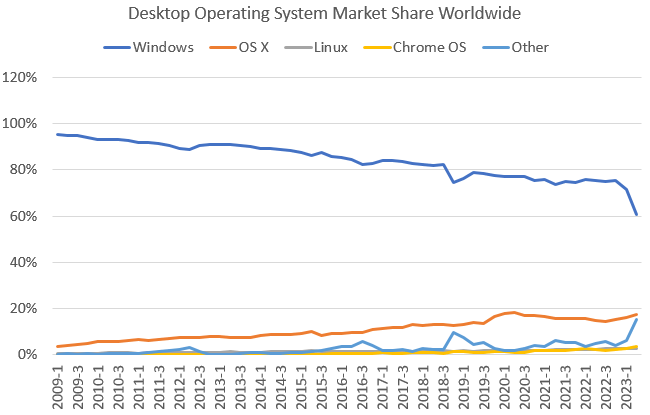
When looking at the market size and Apple’s share of the personal computer (PC) market I like to look at the size of the PC market instead of the operating system market. It also makes sense as Apple reports Mac sales which makes it easier to compare to other PC manufacturers. Most estimates I’ve seen on the size of the PC market for 2022 have been around $200 billion (Statista, The Business Research Company). With Mac sales of around $40 billion in 2022 we get a market share of about 20% which is in line with the OS X market share estimate by GS Statcounter. This makes sense to me as Apple’s OS X operating system operates, to my understanding, mostly on Mac. The Business Research Company forecasts the global PC market to grow to $267 billion by 2027, equivalent to a 5.9% CAGR. Therefore, investors can’t reasonably expect high growth rates from Apple in this segment either unless the Mac would take even more market share from other PC manufacturers and implicitly on the Windows operating system. I classify this product as a Cash cow.
Tablets (iPad)
The tablet market is very concentrated with Apple and Samsung having a combined market share of over 80%. Apple dominates the market with about 55% market share. During the period Apple has, however, been losing ground to Samsung. Amazon has also been growing its share but is still a relatively small player.
Tablet Vendor Market Share Worldwide (GS Statcounter, author)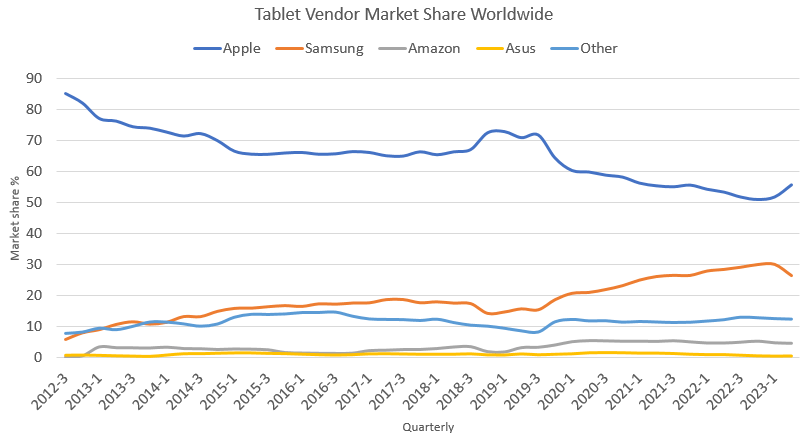
According to Statista, the tablet market was $57 billion (measured in sales) in the year 2022. iPad sales of $29 billion in 2022 would translate to a 51% market share which is fairly in line with the estimate provided by GS Statcounter. Statista expects the market to remain fairly flat at $60 billion in 2028, equivalent to a 0.8% CAGR. If these projections hold true and Samsung continues gaining on Apple, iPad sales will be flat at best or even decline. I want to point out that The Business Research Company estimated the tablet market to be $84 billion in 2022 and expects it to grow to $147 billion by 2028, equivalent to a CAGR of 11.9%. This is a much more rosy scenario than Statista’s. The conclusion in my opinion is that the tablet market will at best grow in the single digits i.e. investors can’t expect much growth for Apple in this arena either. I classify this product as a Cash cow.
Wearables, Home and Accessories
This segment is broad and the separate products are individually a small share of Apple’s revenues, so I will go through them fairly quickly. Below are a couple of statistics on most of the different products in this sub-segment.
- Headphone market (AirPods and Beats headphones): The global headphones market is estimated to be roughly between $18 to $22 billion in sales in 2022/2023. Apple is the clear leader worldwide with a 31.8% market share. Apple also owns Beats which also produces headphones and is included in the market share above. The market is estimated to grow between about 2% and 8% CAGR over the next 5-6 years i.e. not that much growth especially if you already have a large chunk of the market. This product is a Cash cow as well.
- Smartwatch market (Apple Watch): Statista estimates Apple to be the market leader in this market with a 30% market share in 2022. The runner-up is Samsung with about 10% market share. The global market size is estimated to be between $29 to $38 billion in 2022 and to exhibit strong growth from about 8% to 19% CAGR during different estimation periods. This is a clear growth segment for Apple and I classify it as a Star.
- Smart speaker market (HomePod Mini): Apple seems to come in third place in the global smart speaker market with Amazon (Amazon Echo) and Google (Google Nest) taking the first and second spots respectively (although the research is one year old). The market size in 2022 has been estimated to be anywhere between $6.5 billion to $10.8 billion and is expected to grow to $28 billion by 2028, equivalent to a CAGR of 18% or 27% (depending on which estimates base year you use). This market is also a clear growth segment for Apple and I classify it as a Question mark.
- Various electronic devices (Beats Products): Beats sells various different electronic devices and is a very small part of Apple which is why I won’t go through all the different segments here (I also included Beats headphones in the headphones category).
Services
The Services segment consists of sales derived from digital content (App Store and streaming services), advertising, AppleCare, cloud services and payment services. Below is an overview of these sub-service offerings.
- App Store: My understanding is that App Store is the largest sub-segment of the Services segment revenues. Apple reported that App Store developers received more than $60 billion during the year 2022. Apple receives 15% or 30% in commissions from App Store gross sales (depending on certain criteria such as the size of the business) which means the company generated between $11 to $26 billion in sales in 2022. Perhaps a mid-point of these two figures is the most accurate implying that App Store sales in 2022 were about $17 billion. Developers also received $60 billion during the year 2021 implying that App Store sales did not grow during 2022. Apple and Google dominate the market with Apple having a higher market share when measured by revenues. Based on Google Play and App Store sales development and pressure to lower commissions I believe this market to grow in the mid-single digits going forward. I have classified App Store as a Cash cow.
- Streaming: (e.g., Apple TV+ and Apple Music): Apple’s global market share in the video streaming market is around 5% according to 9To5Mac. The market is estimated to be between $70 and $90 billion in 2022 and is expected to exhibit strong growth at about 20% CAGR up until 2030. The juggernauts of the video streaming market are Netflix, Amazon and Disney. The global music streaming market was estimated to be about $43 billion in 2022 with Spotify being the market leader with a 30% market share. Apple, Google, Tencent and Amazon all have market shares between 10-15%. I classify these segments as Question marks although Apple Music could be argued to be a Star. I’m however hesitant to classify it as a Star as it seems that YouTube Music and Amazon Music are gaining on it.
- Advertising: Apple’s advertising revenues have been estimated to be around $5 billion and have the potential to grow to $20 billion in sales by 2026. Obviously, Apple is still a relatively small player in this segment, behind the likes of Alphabet, Meta, Microsoft and Amazon. I classify this service as a Question mark.
- AppleCare, Payment Services, Cloud services: AppleCare provides insurance/warranty for your Apple devices while payment services include Apple Pay and Apple Card (a credit card). Cloud includes services such as iCloud. I couldn’t find any good year 2022 revenue estimates for these services. There was one estimate from WarrantyWeek that AppleCare generated $8.5 billion in sales in 2021 and one from Statista that Payment services generated $4 billion in 2022. Apple also came up with a new service offering with the new savings account yielding 4.15% for depositors. The exact economics of the whole arrangement is still a bit unclear to me although it will likely induce people to use Apple Pay and Apple Card which generates revenues for Apple. Of course, Apple could also take advantage of the interest rate spread between their deposits and short-term treasuries although I’m not quite sure how the economics are set up with Goldman Sachs which is their partner in this venture. I classify these services as Question marks.
Conclusions On The Product and Services Segments
To get a holistic view of how the products and services are classified I have categorized them in a Growth-Share matrix below.
Growth-Share Matrix (Analyst)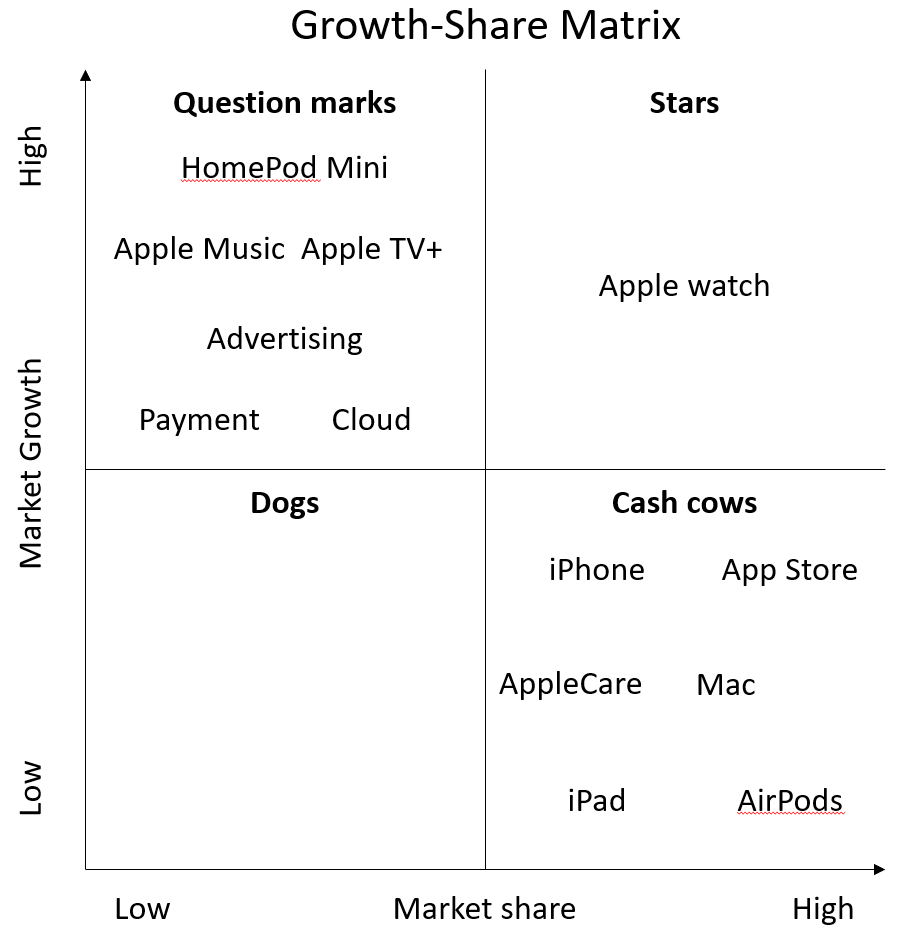
Most of the company’s products are in the Cash cow category while most of the services are in the Question marks category. According to this analysis, Apple is a consumer electronics business first and a service business second which is a fair classification in my opinion. The services segment is growing in importance each year as their markets are experiencing higher growth than the product segments. The exceptions are App Store and AppleCare (both services) as they are classified as Cash cows. App Store could potentially be classified as a Star but due to limited growth in 2022, I decided to put it in as a Cash cow. It will be interesting to see whether Apple can turn some of the Question marks into Stars in the future. This is obviously something that needs to be done in order for Apple to continue its growth journey. It will, however, be a challenging task to gain higher market share in some of the service segments due to the intense competition by well-capitalized companies such as Amazon, Alphabet, Netflix, etc. (e.g. Apple Music and Apple TV+).
In the products segment, the smartwatch (Apple watch) and smart speaker (HomePod Mini) products are clearly the next growth segments for Apple as could be seen from the estimated market growth rates. Apple can also leverage its brand as a consumer electronics company in these specific markets. There’s also been lots of talk about the Apple Car in the recent years. I, for one, think it’s a bad idea for Apple to get into a cyclical capital-intensive industry. One of the reasons why for example Warren Buffet loves Apple is their relatively asset-light business model. If Apple decided to get involved in the car industry they would have to deploy capital at much worse returns than they currently can. The future will tell whether there’s any merit to these Apple Car stories.
In the services segment, Streaming services and advertising are perhaps the markets enjoying the highest growth rates going forward. Video and music streaming are however extremely competitive and the costs associated with for example content acquisition are high which pushes returns on invested capital down. Advertising on the other hand has attractive economics and would be a high-margin, cash-generative business for Apple. It remains to be seen how successfully they can compete with other well-capitalized players such as Alphabet, Meta, Amazon, Microsoft etc.
All in all, Apple is in a good position with many promising new Stars that can take the company on its next growth journey. Apple’s future growth will most likely be linked to a stronger extent to its service segment and its ability to innovate here. With that said, the company will stay a consumer electronics company for the foreseeable future and will most likely continue to innovate here as well.
Great Business But Valuation Is Rich
Although Apple is a great business and has many things going for it, a famous investor once said:
Price is what you pay and value is what you get.
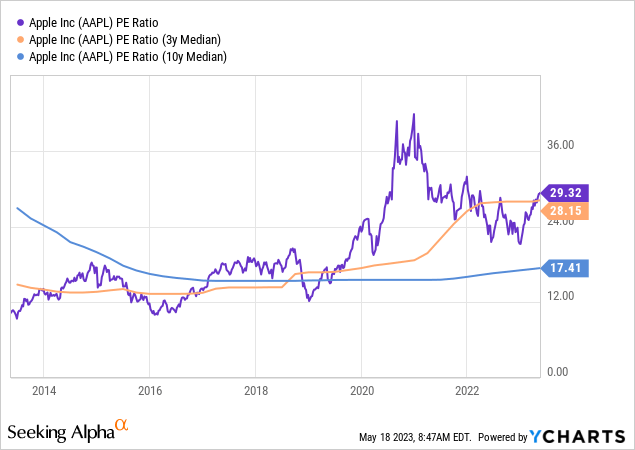
Looking at the current P/E of about 29x, Apple Inc. stock looks very expensive in my eyes even when you consider that it traded even higher during 2021. Apple enjoyed extraordinary growth in 2021 which may have supported a higher multiple but with the current sales that are flat or even declining, a 29x multiple seems rich. The current multiple is fairly in line when comparing it to the 3-year median. As I mentioned, however, most of this period is during the COVID-19 period when everything was priced to the sky due to very easy financial conditions.
Taking a longer perspective, the 10-year median, we see that Apple has traded at about 17-18x P/E. The company is of course different than it was 10 years ago. For example, services revenues have increased from about 10% of total sales to about 20%. The services segment’s gross margins are at about 70% while the product segments are around 35%. The company also has more promising new product and service categories now than it had back then. This is why I believe that the 10-year median may be a bit too low for a company of Apple’s caliber. Perhaps somewhere in the 22-24x range would be a fair multiple to give a company like Apple indicating the company is about 22% to 33% overvalued at the moment.
In the multiple, I have included the fact that about 19% of Apple’s sales are generated in China. I believe that this “China risk” should decrease the multiple one is prepared to give to Apple. The Sino-American conflict is very multi-faceted and hard to analyze from a business risk perspective. In other words, it’s uncertain if it will get worse or better in the future. Uncertainty is another word for risk and therefore I believe it’s reasonable to decrease the multiple Apple would deserve otherwise.
Worst case scenario, the Chinese government bans Apple from the country and there goes $74 billion in sales. It seems radical to even write it, but if you told me a few years ago that we’ll have a global pandemic or that Russia will start a war in Europe I wouldn’t have believed you either. I love the business but hate the price at these levels, i.e., sell your Apple Inc. stock.
Analyst’s Disclosure: I/we have no stock, option or similar derivative position in any of the companies mentioned, and no plans to initiate any such positions within the next 72 hours. I wrote this article myself, and it expresses my own opinions. I am not receiving compensation for it (other than from Seeking Alpha). I have no business relationship with any company whose stock is mentioned in this article.
Seeking Alpha’s Disclosure: Past performance is no guarantee of future results. No recommendation or advice is being given as to whether any investment is suitable for a particular investor. Any views or opinions expressed above may not reflect those of Seeking Alpha as a whole. Seeking Alpha is not a licensed securities dealer, broker or US investment adviser or investment bank. Our analysts are third party authors that include both professional investors and individual investors who may not be licensed or certified by any institute or regulatory body.