Summary:
- Apple stock experienced a 30.1% rally after my “buy” recommendation but has since slowed, prompting a downgrade to “hold” near all-time highs.
- Despite solid Q3 earnings, including revenue and EPS beats, Apple’s forward valuation metrics suggest limited upside compared to other MAG-7 stocks.
- Apple’s price-book ratio of 52.74x is high, making Alphabet and other MAG-7 stocks more attractive on a relative valuation basis.
- Investors should wait for a deeper price decline before entering new long positions, as current upside potential appears limited.
nayuki
When I last covered Apple Inc. (NASDAQ:AAPL) with a “buy” rating on May 5th, 2024 in the article “Apple: Dividend Raise Won’t Be Enough”, the stock was attempting to recover from a series of declines that had generated losses of -17.8% in less than six months and sent share prices to near-term lows of $164.08:
AAPL: Early 2024 Stock Losses (Income Generator via TradingView)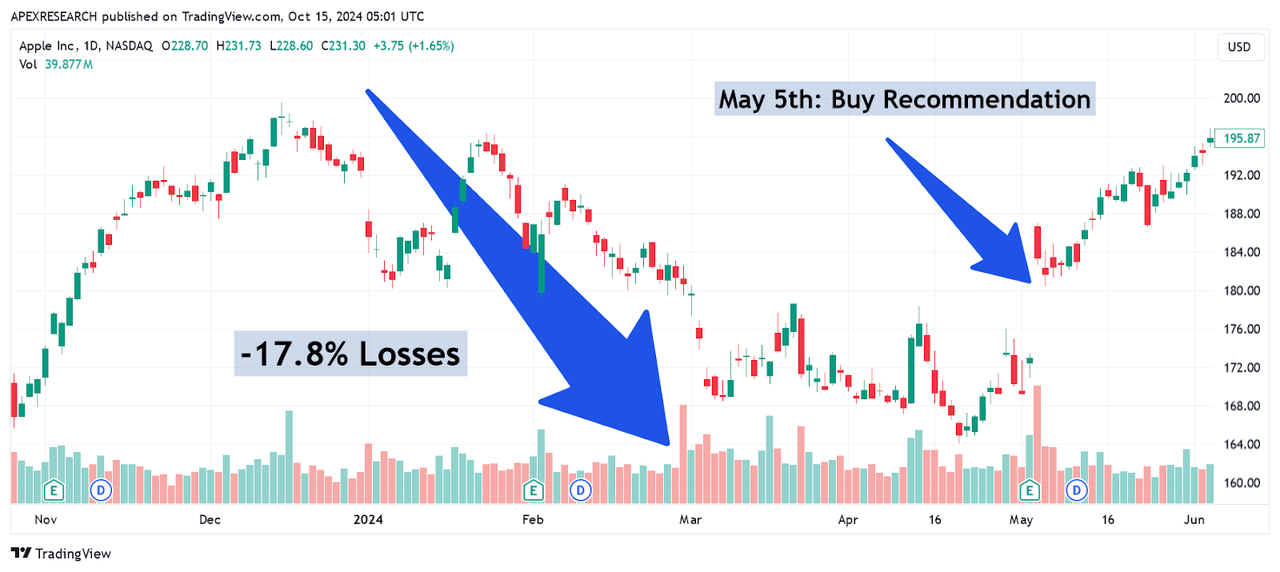
Since then, the stock has seen rallies that have been quite sizable and this bullish activity helped investors generate share price gains of as much as 30.1% over the following 10-week period:
AAPL: Buy Recommendation Aftermath (Income Generator via TradingView)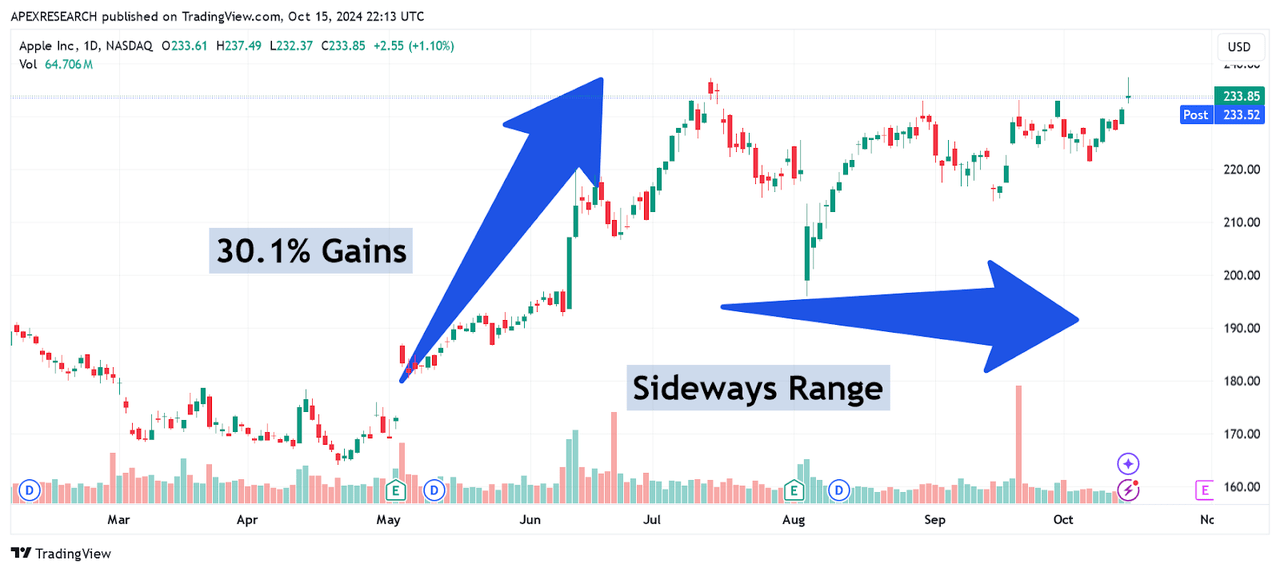
Overall, my prior “buy” recommendation has benefitted from total returns of 28.56% even while the S&P 500 has lagged far behind with gains of just 13.08% over the same period of time. However, that initial Apple stock rally has started to show a significant slowdown in share price momentum, in spite of the fact that the company managed to post fairly impressive earnings results during the fiscal third quarter period. As a result, I think the most prudent approach at this stage is to downgrade my prior “buy” rating to a “hold” rating while the stock trades within relatively close proximity to the July 15th all-time highs and upside potential is starting to look exhausted going forward.
Apple: Q3 Earnings Figures (Apple Earnings Release)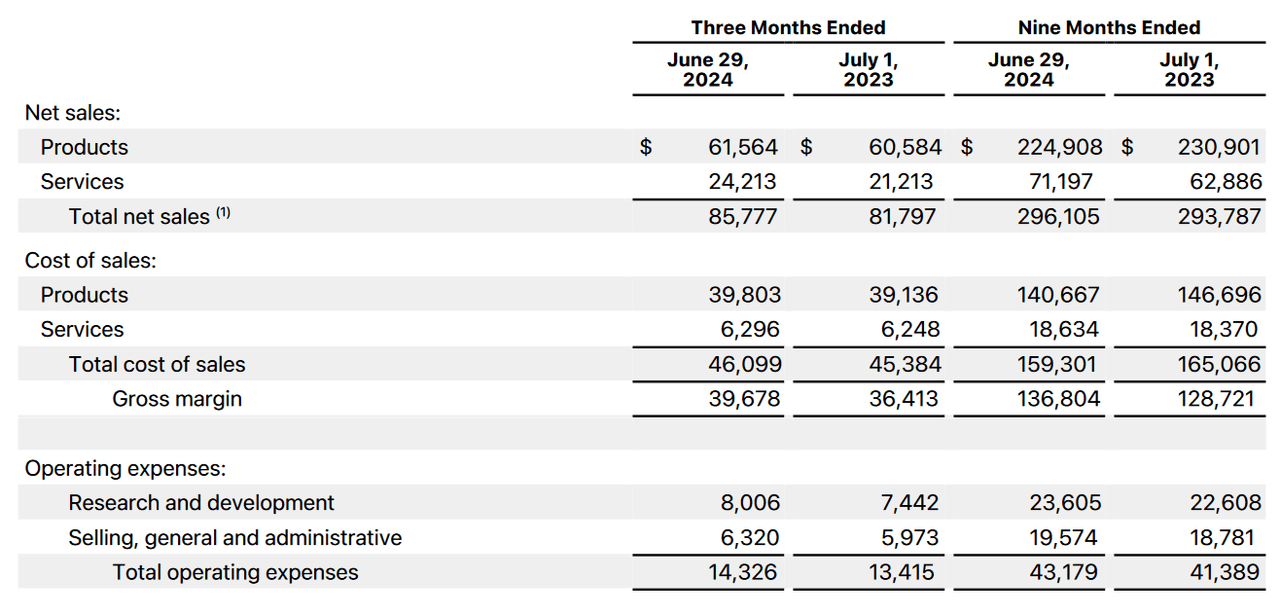
All of that said, it should be noted that Apple has recently posted solid quarterly performance results, and this has helped the stock maintain its current position at these elevated levels. For the period, total revenue and EPS results both beat market expectations (at $85.78 billion and $1.40 per share). On the revenue side, these results moderately surpassed consensus estimates by 1.48% while the EPS figure surpassed consensus estimates by 3.7%. Key areas of strength were seen in revenues from the Services, iPad, and iPhone segments. iPhone revenues surpassed expectations by 1.26% (at $39.3 billion) and iPad revenues beat estimates by an even wider 8.32% margin (at $7.16 billion).
Apple: Q3 Earnings Figures (Apple Earnings Release)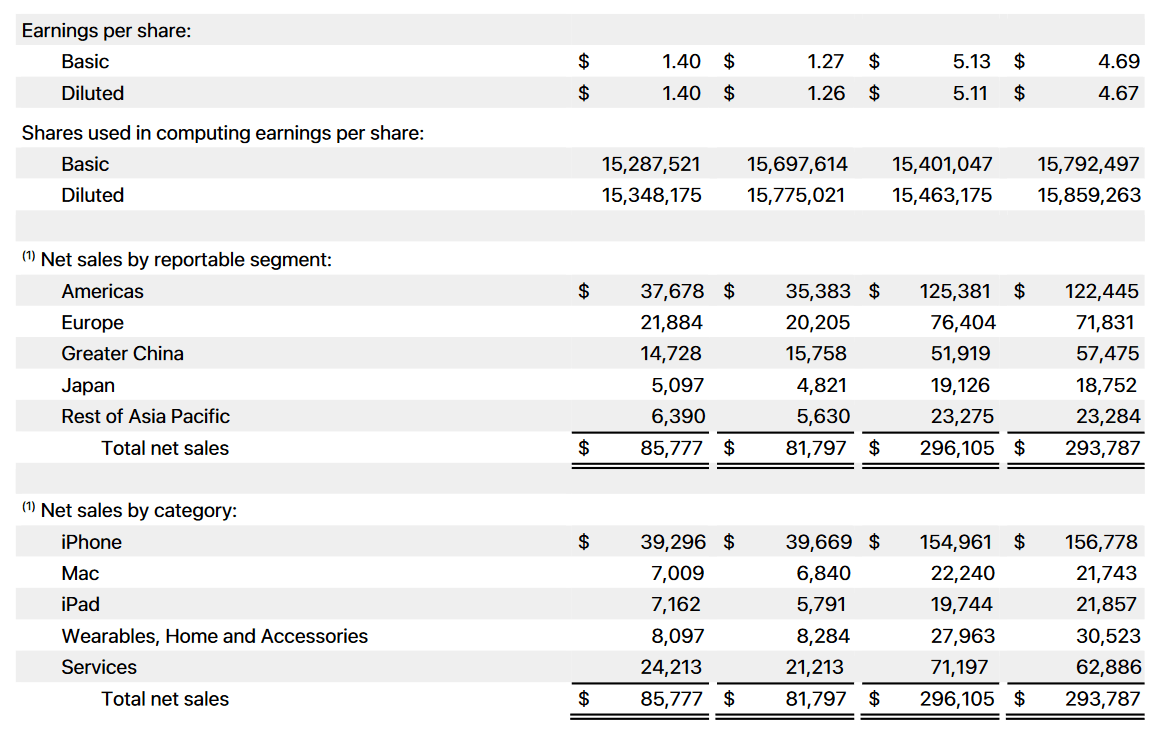
Notably, these iPad figures indicate annualized growth rates of over 23% and roughly half of the people buying these items were purchasing an iPad for the first time, which does help to counter the market saturation arguments that often seem to be raised by investors with a more bearish Apple outlook. Other important areas of strength were seen in Apple’s services revenue (which came in at $24.21 billion) and in gross margin figures (which surpassed 46.1% consensus estimates at 46.3%). Additionally, the company’s net income figures of $21.45 billion (or $1.26 per share) indicate annualized growth rates of 8.32% for the period.
AAPL: Comparative Price to Earnings Valuations (YCharts)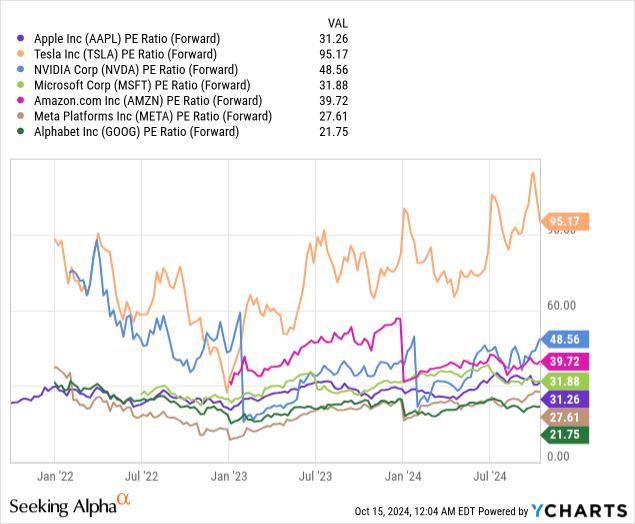
In light of these figures, we must assess Apple’s forward valuation metrics in relation to the company’s mega-cap tech counterparts. Within my trading group, one of the most common questions that is typically raised is which of the MAG-7 stocks offers the best investment opportunity at any given time. The majority of the stocks we trade tend to come from the smaller-cap category, but it is obviously an advisable measure of stability to have a healthy allocation devoted to these market leaders, and we will regularly shift positions within this group. Currently, Apple’s forward price-earnings valuation of 31.26x is trading far below Nvidia Corp. (NVDA) at 48.56x and Tesla, Inc. (TSLA) at 95.17x. Forward valuations are a bit closer to Amazon, Inc. (AMZN) at 39.72x and Microsoft Corp. (MSFT) at 31.88x. However, these are currently cheaper options within this group if we are looking at Meta Platforms (META) at 27.61x and Alphabet, Inc. (GOOG) at 21.75x.
AAPL: Comparative Price to Sales Valuations (YCharts)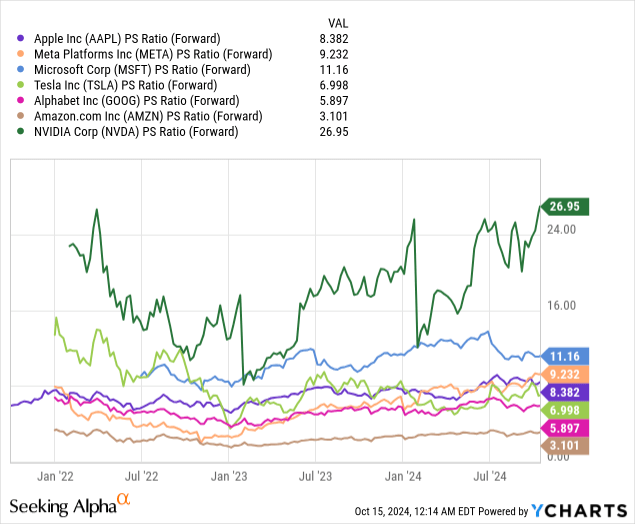
Less preferable relative valuations can be seen if we view these companies base on the forward price-sales metric, as Apple currently trades with a ratio of 8.38x and three other MAG-7 companies are currently trading with lower valuations. While more expensive options can be seen in Meta Platforms, Microsoft, and Nvidia, stocks like Tesla (at 6.99x), Alphabet (at 5.89x), and Amazon (at 3.1x) are all looking more attractive at the moment.
AAPL: Comparative Price to Book Valuations (YCharts)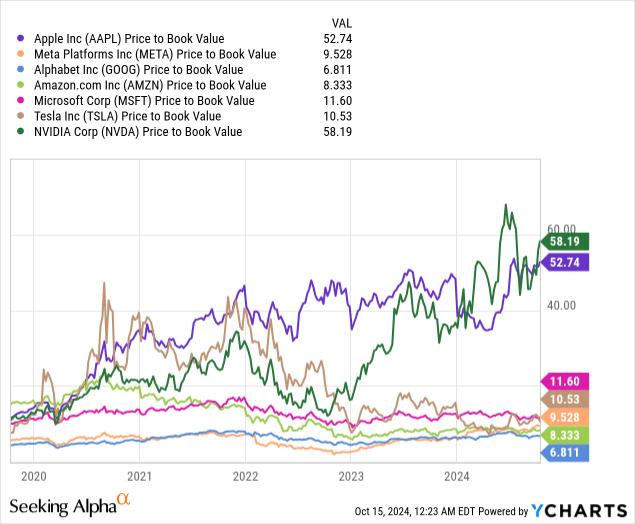
Finally, we must look at the relative price-book valuation of this group because this is where the differences start to become much more stark. Currently, Apple’s price-book ratio of 52.74x is only surpassed by Nvidia (at 58.19x) and four of the MAG-7 group are now trading at more favorable valuations: Microsoft (at 11.6x), Tesla (at 10.53x), Meta Platforms (at 9.52x), Amazon (at 8.33x), and Alphabet (at 6.81x). As we can see from all of these metrics, GOOG is currently trading in a much more favorable position when compared to AAPL, and this in large part explains why I have recently raised my rating for Alphabet to a “strong buy”.
Ultimately, all of this is not to say that I have become bearish on Apple. Q3 earnings results did show plenty of evidence of strength, and I believe that the stock still has potential to post new record highs before the end of the year. However, even a move like this would not indicate substantial changes relative to current price levels, and this is why I believe investors should wait for a deeper downturn in share prices before entering into new long positions.
AAPL: Recent Stock Trading Range (Income Generator via TradingView)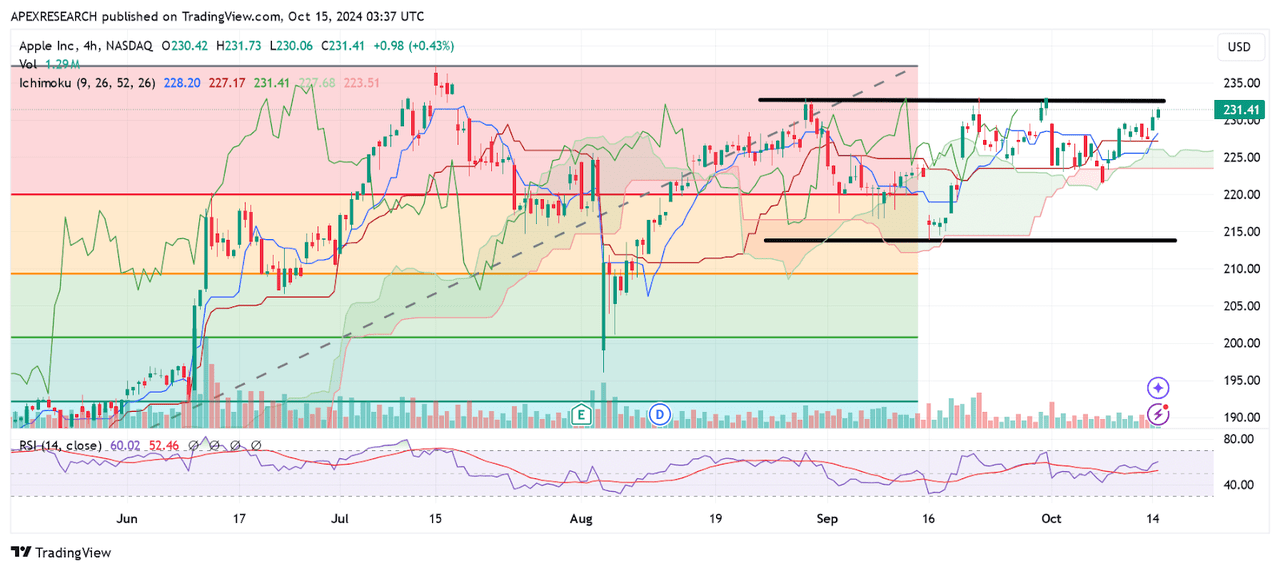
Of course, finding pullback trading opportunities in AAPL stock can often be a bit of a challenge due to the fact that, in many instances, downturns tend to be short-lived and the longer-term uptrend typically has a way of reasserting itself quite quickly. As one example, we can see in the chart shown above that this recent drop below the $200 mark did not result in oversold momentum readings in the relative strength index. This specific chart is based on the daily time frame, so these are indicator signals that would be watched closely by a large percentage of the market. After falling to these lows, share prices quickly rebounded to form a sideways trading range defined by resistance zones near $233 and support zones near $214 per share. Unfortunately, this price action leaves very little distance between current price levels and major long term resistance zones, and I believe that this places Apple’s risk-reward framework in a less attractive position when compared to some of the company’s MAG-7 counterparts.
AAPL: Prior Pullback Trading Opportunity (Income Generator via TradingView)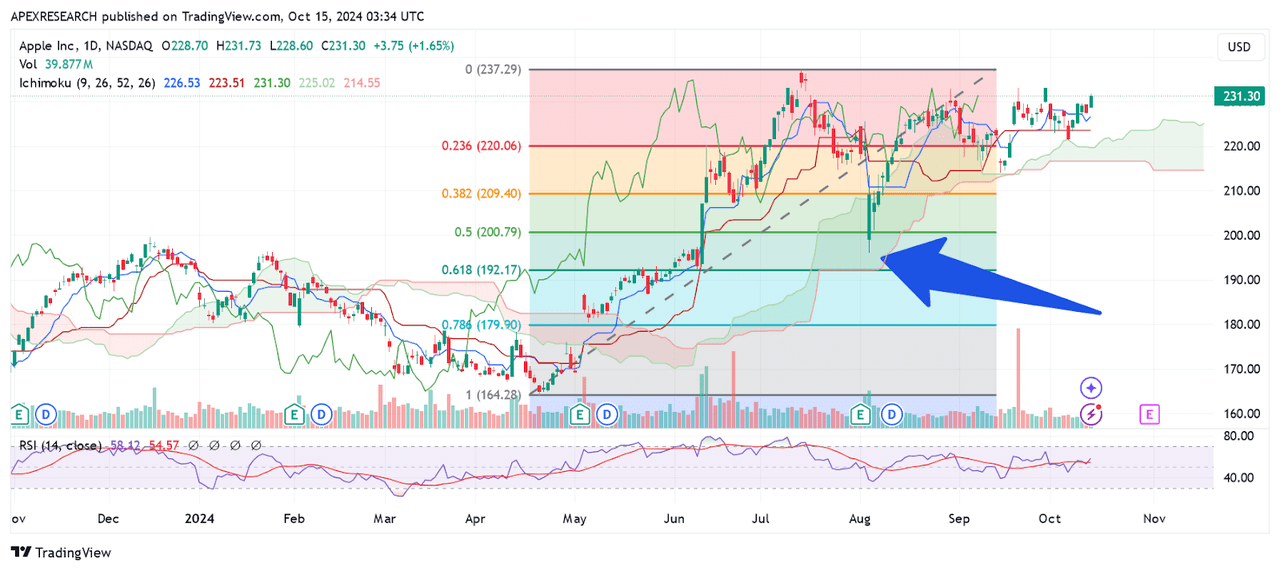
Interestingly, we did see the stock drop to lows of $196 during the August 5th trading session with a move that retraced roughly 50% of the prior rally from the April, 19th, 2024 lows (at $164.08) to the stock’s July 15th highs (at $237.23). Currently, my recommendation would be to wait for a similar price decline before adding to existing long positions (or before entering into new bullish trades). Given that the stock’s more recent upward price movements fall short of the stock’s July 15th highs, the outlook here remains consolidative with the daily reading in the relative strength hovering near the midpoint of the histogram. As a result, current upside potential appears to be limited (in my view) and I think downgrading my outlook for the stock to a “hold” rating seems to be the most appropriate course of action at the moment.
Analyst’s Disclosure: I/we have a beneficial long position in the shares of AAPL either through stock ownership, options, or other derivatives. I wrote this article myself, and it expresses my own opinions. I am not receiving compensation for it (other than from Seeking Alpha). I have no business relationship with any company whose stock is mentioned in this article.
Seeking Alpha’s Disclosure: Past performance is no guarantee of future results. No recommendation or advice is being given as to whether any investment is suitable for a particular investor. Any views or opinions expressed above may not reflect those of Seeking Alpha as a whole. Seeking Alpha is not a licensed securities dealer, broker or US investment adviser or investment bank. Our analysts are third party authors that include both professional investors and individual investors who may not be licensed or certified by any institute or regulatory body.
