Summary:
- Apple Inc.’s growth phase is over, and it is now a mature company, lacking innovation and relying on financial engineering to maintain its metrics at respectable levels.
- The lack of real innovation in Apple’s products is impacting revenue growth, particularly in the iPhone segment.
- Apple’s balance sheet is showing weaknesses, with liabilities growing faster than assets and shareholder equity eroding annually as a result.
- I’m recommending a Sell for Apple before earnings on May 2, 2024.
ozgurdonmaz
I don’t usually write about securities that I know I’m going to be bearish on, but in the case of Apple Inc. (NASDAQ:AAPL), I’m willing to make that exception. There are too many investors out there that are still hanging on to hope. True, the long-timers (or lifers, in this case, probably) have made a handsome return on their AAPL investment over the years. Even an investment made 5 years ago would have yielded a nominal total return of over 230%; on a 10Y timeframe it would have been nearly 900%. I’ll grant you that’s not a bad payback for any investment, but is it replicable over the next five or ten years?
That’s the question this article addresses, and the spoiler is that it is not, in my opinion. Sure, Apple will move along nicely, but unless it finds its innovative mojo once again the way it did in 2007 with the launch of its revolutionary iPhone, investors can consider this to be a more or less mature company that’s past the growth phase.
Please note that, unless otherwise noted, all data has been taken either from Apple’s SEC filings (mostly 10-Ks and the most recent 10-Q), and Seeking Alpha’s rich bank of historical information that you can get to from the main AAPL ticker page, for which I am duly grateful.
Where I See the Apple Core Crumbling
On the surface, everything about Apple is still shiny – or somewhat so. This is what I see at a superficial level from its three core statements, and I’ll subsequently explore the nuances in greater detail.
From a P&L statement perspective, revenues are still growing (for the most part), gross margins are still trudging upwards (although a lot more slowly now), opex is under control (although now on the higher side), and net income margins are still above the 25% level where they’ve been since FY21.
On the balance sheet side of things, things are a little less rosy – cash, equivalents, and short-term investments are down more than 27% over the past five years, while total current assets are down from $163 billion to $144 billion as of the last quarter. While this hasn’t had a negative impact on total assets over time, that’s mainly due to PP&E growth, which is subject to higher levels of depreciation than ever, the only saving grace being other long-term (non-current) assets that arise from recent investments in corporate debt and long-term treasuries, and MBS and other asset-backed securities.
When you move to its cash flow statements, you can see even less optimal figures – even though operating cash flows over the last quarter show a recovery since FY23, Apple seems to be divesting increasingly more of its marketable securities; alongside the depleting cash position, this could be worrisome, particularly since non-current marketable securities comprise a maturity profile that’s highly skewed to the next five years. We’ll delve into that in a bit.
On the whole, it looks like a well-balanced 5-year performance, but it’s actually not, as the next section shows. For that section, I’m going to pick the worst pain points to drive home my thesis that all’s not well at Apple.
Income Statement Performance
On the income statement, Apple seems to have quite a bit of operating leverage. While revenues grew nearly 50% over the last five years, net income has grown more than 80%. As a hardware-focused company that’s still transitioning into a service-heavy revenue profile, you can see the transformation happening. However, the problem here is that these service revenues continuing to grow are contingent on Apple’s device install base continuing to grow as well. The problem is that revenue growth itself has flattened out.
Due to revenue growth plateauing, I don’t see services revenues growing at such a fast pace eventually. To validate that, let’s look at how this segment has grown over this period. During the period from FY-18 to FY-23, Services show a distinct pattern. Let me help with a graphic visualization.
Data from SEC Filings, Graph by Author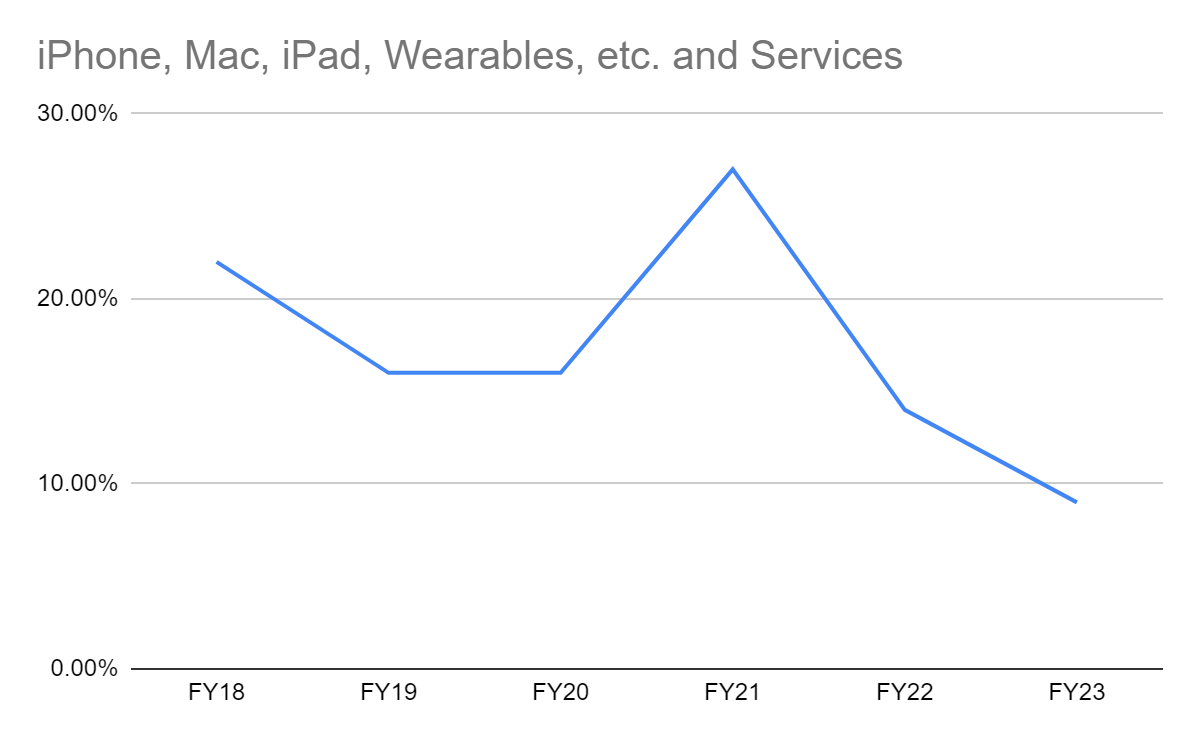
Not very difficult to spot that trend, is it? And it’s easy to see why. Services, as I said, depend on the device install base, and when that growth starts to slow down, Services growth will organically mirror that trend.
Data from SEC Filings, Graph by Author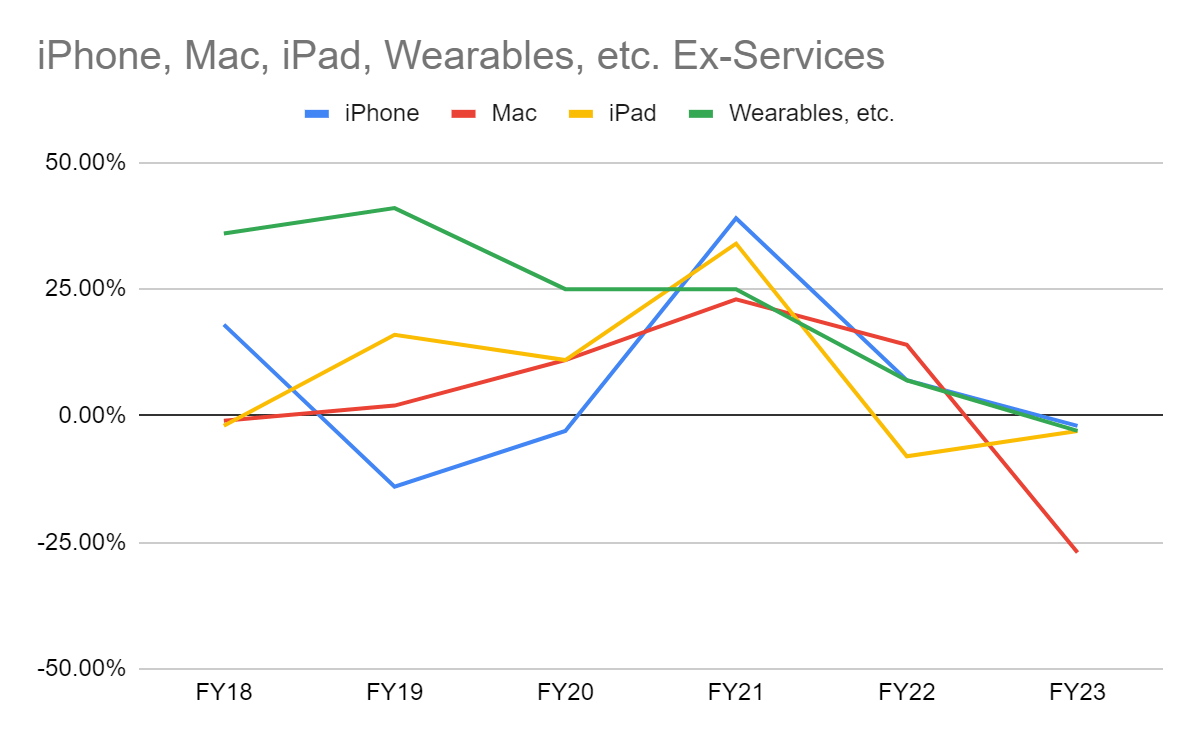
It’s relatively easy to explain the growth into the pandemic period. Stimulus money, excess disposable income, and general stay-at-home boredom boosted all line items, but then reality hit after that, and that’s what we’re seeing from FY21 onwards.
The company has thus far depended on strong iPhone sales, and I know that this is an oft-beaten dead horse, but it is undeniable that the lack of growth can be directly linked to the lack of real innovation in its products. They’re flashy and shiny and getting more expensive – and that last bit has contributed more to revenue growth than unit sales have, arguably. This is easy to see because iPhone shipments, the largest revenue component by far, haven’t grown at a rate that validates the segment’s revenue growth.
Backlinko, with data from IDC and Statista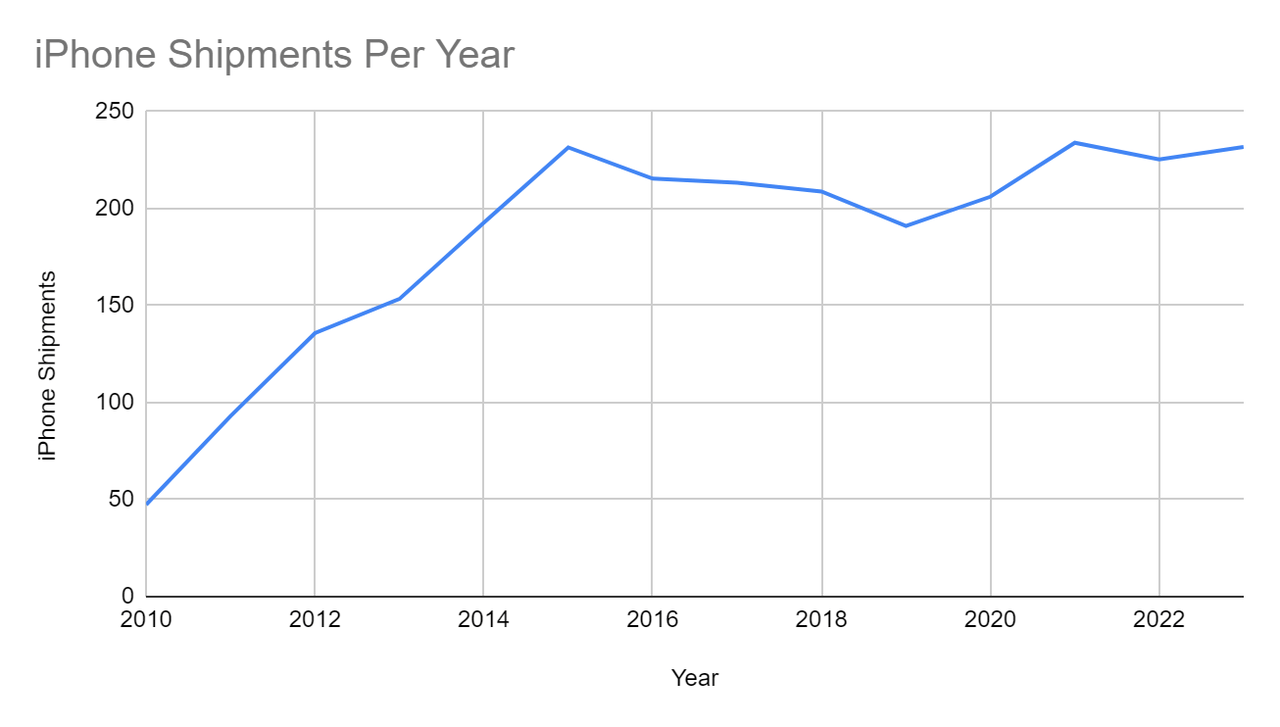
That price increase factor can also be loosely correlated by looking at shipments versus revenues – not an exact match due to the timing of the calendar period vs. fiscal period, etc., but it still offers a viable argument for the case.
Data from 10K Filings (iPhone Revenue) and Backlinko (iPhone Shipments)
.
Of course, this data needs to be taken with a pinch of salt because, when you adjust for inflation, the $499 price of the original iPhone is comparable with the $799 price tag on the iPhone 15. What’s clear is that shipments have been largely flat since 2015 (CY basis), but revenues have kept increasing due to the pricing increases (FY basis).
That’s the first sign that all’s not well at Apple.
The second aspect is the bottom line, and particularly, how opex impacts it. Let’s explore.
If you look at EBIT and how SG&A and R&D expenses play into that, Apple’s operating margins look like they’re becoming stronger (30% as of Q124), but in my opinion, that’s only because the company is doing a very delicate balancing act between SG&A and R&D expenditure. Since FY21, Apple has curtailed its SG&A to make sure that R&D spend continues to grow, but the result is that operating income has undeniably dropped. The margin vs. the top line might be growing, but that leverage I mentioned at the beginning of the article is showing signs of weakness. EBIT has improved as of the latest fiscal year, and I’ll admit that, but this leverage isn’t sustainable.
At some point in the future, something has to give, and it will show up at the bottom line. That’s my worry.
Let’s move to the balance sheet.
Balance Sheet Trends
Investors take it for granted that Apple has a stellar balance sheet because it’s still flush with cash. However, we’ve already seen that their C&E and ST securities are down 27% since FY19. Of course, there’s been some working capital movement to inventory, other current assets, and long-term assets such as PP&E, treasury holdings, etc., but total assets have been relatively flat, moving from $339 billion in FY19 to $354 billion in Q124. That’s a CAGR of 1.1% – nothing to write home about.
When you move to the liabilities side, however, the weakness is much more apparent. Total liabilities have grown from $248 billion in FY19 to $279 in Q124 for a CAGR of 3% – nearly three times the rate at which assets are growing, and that trend worries me more than the absolute numbers. As a result, shareholder equity to common is trending down at a worrisome CAGR of -4.9%. In other words, Apple’s book value is eroding annually at nearly 5%.
Another way to look at this is that equity value has grown from $45 billion to $75 billion, but retained earnings have dropped from $46 billion to just $8 billion in the last report, even dropping to negative numbers during FY22 and FY23.
And when you look at how these numbers have been engineered to exhibit growth, the problem becomes very real.
Cash Flow Performance
As I mentioned earlier, this is where you can clearly see the underlying issues. Let’s take operating cash flows to begin with. On the surface, CFO growth from $69.4 billion to $116.4 billion looks impressive. And it should be that way because, regardless of my bearish views, Apple is a cash generator. But what about the other cash flows? That’s of greater interest to me.
The first chart above is based on percentages; the second on absolute dollar value. You can see that CFO is showing healthy growth, but there have been prolonged cash outflows in CFI and CFF that are only just recovering. More financial engineering, in my opinion, but that’s not a sustainable way to grow.
Eventually, cash flows will start to weaken, thereby impacting the balance sheet’s health, and the only way to recover from that is to innovate and grow sales in a strong manner. Unfortunately, I don’t see that happening in the near future.
Higher-level Commentary
I’m not here to tell you that iPhone sales are going to fall off a cliff or the lack of innovation will send Apple spiraling down into oblivion. I have very strong faith in the company’s leadership; without them, things could have been much, much worse. The issue I have is that they’re only keeping things in check; they’re not turning this company back into the tremendous growth investment that it was during the last decade.
Yes, I’ve identified problematic areas and trends to prove my point that Apple is no longer a growth company but has entered a more mature phase where financial engineering is a necessary evil that’s needed to keep investors tied into the narrative. Nothing nefarious, of course, and I wouldn’t presume to have the kind of knowledge or confidence to accuse Apple of any underhand accounting. I’d like to make that very clear. Nevertheless, I think they’re forced to balance their suboptimal growth by squeezing hard to pull every bit of profitability down to the bottom line, so investors are kept happy.
As for the lack of innovation, I don’t know if the Vision Pro and future products will kick-start stellar growth performance in the future, but it’s not looking good. Reports suggest that production of the AR headsets is being cut nearly in half, but even if it’s not, we’re looking at roughly 800,000 units sold over the past year for an approximate amount of $2.8 billion to the top line. That’s a drop in the ocean compared to a top line of $380+ billion. Even at the high-end estimate, if reports are to be believed, we’re looking at a revenue contribution of 0.7%. That’s not iPhone-level; it’s not even iPad-level. Yes, it could lead to strong Services growth, but remember, again, that you need a solid install base to roll out your services to. Without that device growth, service revenues are likely to stall, as they already show signs of doing.
On the bull side of the fence, there are strong arguments as well. Apple’s profitability scores, for the most part, far surpass their sector medians, and this includes return on assets at nearly 30%, return on capital at +40%, net income margin at 25% and so on. Many of these metrics are even higher than the company’s own 5Y averages. From a valuation standpoint, Apple’s forward P/E multiples of 26 to 27 are at-par with the sector medians, but perhaps a little expensive on a comparative basis when you look at other price and sales multiples.
And then there’s brand value, geographic diversification, product diversification, premium pricing, and several other advantages. I’ll acknowledge each of these, definitely. However, at the end of the day, what matters is whether the company, in the form of total returns, is giving investors the kind of payback they deserve for keeping the faith. That’s not happening. In fact, if you look at share buybacks during the short window from Q120 to Q421, you’ll see Apple’s average buyback price per share going from $107 to $146. As of Q124, Apple reported repurchasing “118 million shares of its common stock for $20.5 billion” – some quick math will tell you that’s nearly $174 per share. That’s where Apple is trading right now, as I write this!
That alone should tell you clearly that Apple needs to keep spending money just to stay at its current levels of metric performance. I’m not against share buybacks, and I understand that Apple may be timing its repurchases to coincide with dips in its stock price. That’s sound capital allocation, but I’m focusing on the reason it has to spend that much capital on repurchasing common shares, and that reason is not a good one, in my opinion.
At the risk of being eaten alive by Apple bulls, I’m rating Apple a Sell right now. Sure, you might see some nominal gains along the way if you keep holding on to it, but much of the upside has already been squeezed dry, and at this point, I neither see this as a growth stock nor a value stock.
Apple’s fiscal Q2 earnings are right around the corner on May 2 after market close. I estimate that we’ll still see iPhone sales growth, overall top-line growth, and Services growth. We’re also likely to see an earnings beat that continues its two-year streak. iPhone sales were reportedly strong during the already-reported holiday quarter, so we might see some weakness there, which is seasonal and completely expected.
Regardless, I bravely stick to my Apple Inc. Sell rating.
As always, that’s just my opinion based on this analysis. Please don’t hesitate to comment if you agree, disagree, or have a different viewpoint altogether.
Analyst’s Disclosure: I/we have no stock, option or similar derivative position in any of the companies mentioned, and no plans to initiate any such positions within the next 72 hours. I wrote this article myself, and it expresses my own opinions. I am not receiving compensation for it (other than from Seeking Alpha). I have no business relationship with any company whose stock is mentioned in this article.
Seeking Alpha’s Disclosure: Past performance is no guarantee of future results. No recommendation or advice is being given as to whether any investment is suitable for a particular investor. Any views or opinions expressed above may not reflect those of Seeking Alpha as a whole. Seeking Alpha is not a licensed securities dealer, broker or US investment adviser or investment bank. Our analysts are third party authors that include both professional investors and individual investors who may not be licensed or certified by any institute or regulatory body.
