Summary:
- I consider both Apple Inc. and Microsoft Corporation to be excellent choices in terms of risk and reward and therefore believe that both are attractive long-term investments.
- Both have an Aaa credit rating from Moody’s, have strong competitive advantages and have performed well within the past 12-month period.
- However, I currently consider one of them to be slightly more attractive, particularly for dividend growth investors. This is due to strong growth perspectives and slightly lower risk factors.
Cristina Ionescu
Investment Thesis
In my opinion, both Apple Inc. (NASDAQ:AAPL) and Microsoft Corporation (NASDAQ:MSFT) are attractive long-term investments due to the companies’ strong competitive advantages, their excellent position within their industries, their enormous financial health (both companies have an Aaa credit rating from Moody’s) and their relatively attractive expected compound annual rate of return (as according to my DCF Model).
Therefore, I suggest to overweight both companies in an investment portfolio that is built for the long term. However, I do currently consider one of these picks to be more attractive than the other.
In this comparative analysis, I will show you why I consider Microsoft to be the slightly better choice for dividend growth investors when compared to Apple:
- Microsoft has a slightly higher Dividend Yield [FWD] of 0.88% when compared to Apple (Dividend Yield [FWD] of 0.55%).
- Microsoft has shown a higher Dividend Growth Rate [CAGR] over the past 5 years (9.92% compared to 7.82%).
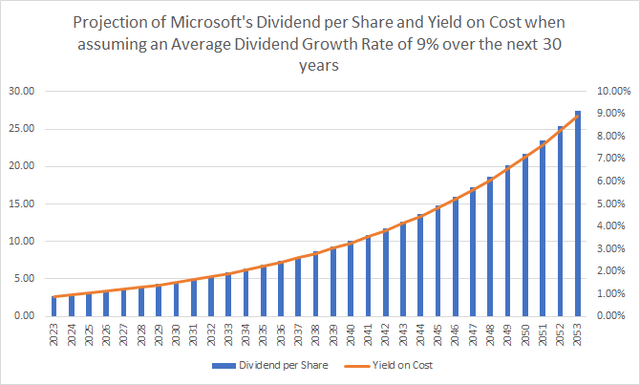
- My projection for Microsoft’s Yield on Cost which you could potentially achieve when investing over the long term is higher than Apple’s.
- My discounted cash flow (“DCF”) Model indicates an expected compound annual rate of return of 9% for Microsoft and 7% for Apple.
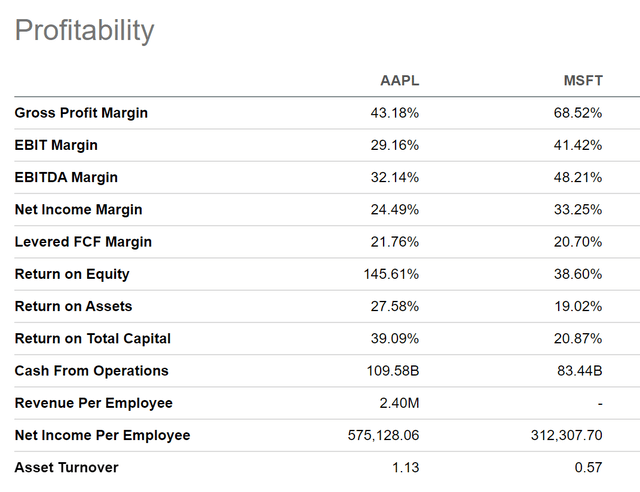
- Microsoft is ahead of Apple in terms of Profitability (EBIT Margin [TTM] of 41.42% compared to 29.16%).
- I see Microsoft as being ahead of Apple when it comes to Growth: Microsoft has shown an EBIT Growth Rate [FWD] of 12.39% while Apple’s has been 3.52%.
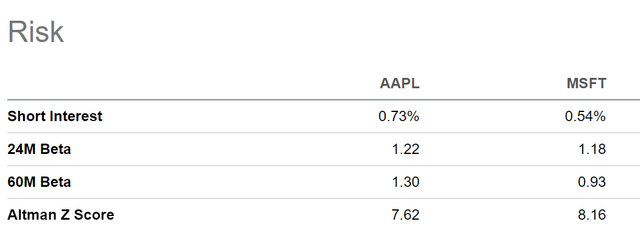
- Additionally, I consider the risk for Microsoft investors to be slightly lower than for those who invest in Apple, which is underlined by Microsoft’s 60M Beta of 0.93, while Apple’s is 1.30,
The Companies’ Competitive Position within their Industry
Both Microsoft and Apple have a strong competitive position within their industry and dispose of significant competitive advantages. This contributes to the fact that I generally suggest to overweight both companies in an investment portfolio that is built for the long term and with the objective of continuously benefiting from dividend enhancements.
Both companies have been able to build their own ecosystem, which serves them as an economic moat over their competitors: while Apple has been able to create its own ecosystem by integrating their hardware, software, and services, Microsoft’s ecosystem is mainly based on its Windows system and software applications (including Word, Excel and PowerPoint, for example).
In addition to that, Apple and Microsoft both have a broad and diversified product portfolio. This strategic approach helps them to offset declines in revenue of one business unit by relying on other units, thus helping to reduce the risk level for investors.
Furthermore, Apple and Microsoft have a strong brand image which provides them with another significant competitive advantage over competitors: according to Brand Finance, Apple is currently 2nd in the ranking of the most valuable brands in the world (with an estimated brand value of $297,512M), while Microsoft is ranked 4th (with an estimated brand value of $191,574M).
These strong competitive advantages contribute to reducing the risk level for investors, thus increasing the probability of making excellent investment decisions when investing over the long term.
The companies’ excellent position within their respective industries are further underlined by their EBIT Margins [TTM] of 41.42% (Microsoft) and 29.16% (Apple).
The Companies’ Performances within the Past 12-Month Period
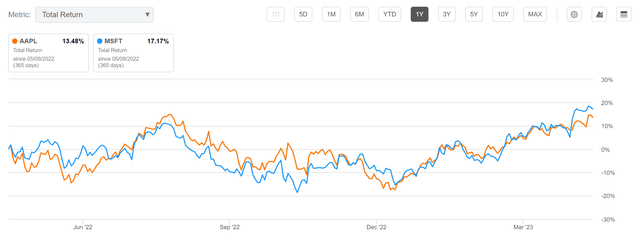
Within the past 12-month period, Microsoft has shown a Total Return of 17.17% while Apple’s Total Return has been 13.48% within the same time period. These results confirm my investment thesis to overweight both companies in a long-term oriented investment portfolio that is built with the objective of achieving dividend growth; but to select Microsoft over Apple if you were only able to choose one of them at this moment in time.
The Companies’ Dividends and Dividend Growth
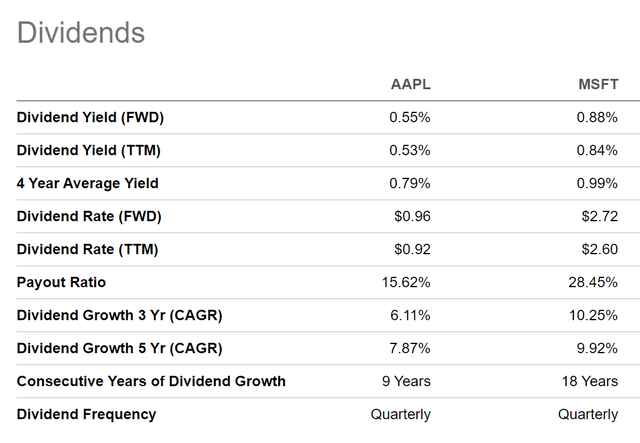
At the companies’ current price levels, Microsoft pays its shareholders a Dividend Yield [FWD] of 0.88%, while Apple’s is at 0.55%. Microsoft also has the slightly higher Dividend Growth Rate [CAGR] over the past 5 years (9.92%) when compared to Apple (7.87%).
Both metrics demonstrate that Microsoft is the slightly more attractive choice for dividend growth investors. The same is confirmed through the fact that Microsoft has already shown 18 Consecutive Years of Dividend Growth while Apple has shown 9 years.
However, it can be highlighted that Apple’s Payout Ratio of 15.62% stands significantly below the one of Microsoft (28.45%), leaving even more room for future dividend enhancements.
The Seeking Alpha Dividend Grades
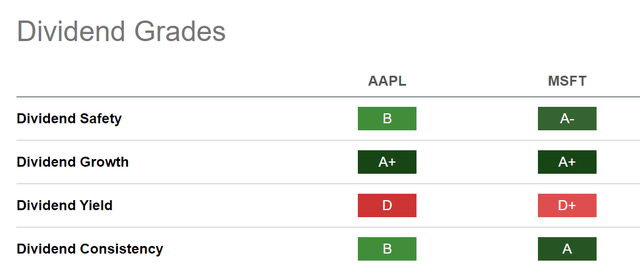
Taking into consideration the Seeking Alpha Dividend Grades, it can be highlighted that Microsoft receives the slightly better rating in terms of Dividend Safety (Microsoft receives an A- rating while Apple gets a B rating), Dividend Yield [D+ for Microsoft while Apple has a D), and Dividend Consistency (Microsoft receives an A while Apple gets a B). In terms of Dividend Growth, both companies get an A+.
The Seeking Alpha Dividend Grades confirm my investment thesis that both companies are attractive choices for dividend growth investors, but that Microsoft is the slightly more attractive choice at this moment in time.
The Projection of the companies’ Dividends and Yield on Cost
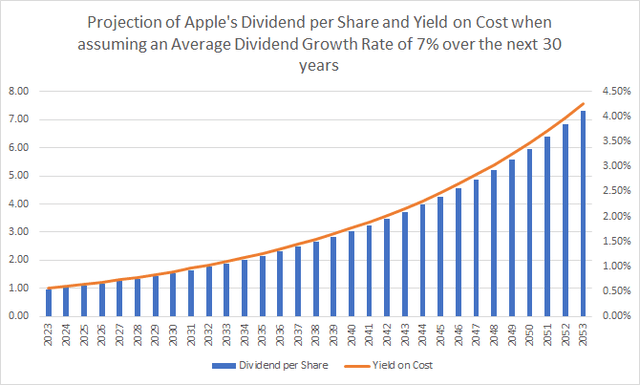
Below you can find a projection of Apple and Microsoft’s Dividend per Share and Yield on Cost.
For Apple, I have assumed an Average Dividend Growth Rate of 7% for the following 30 years (which is based on the company’s Dividend Growth Rate [CAGR] of 7.87% over the past 5 years) and for Microsoft I have assumed an Average Dividend Growth Rate of 9% (based on the company’s Dividend Growth Rate [CAGR] of 9.92% over the past 5 years).
Projection of Apple’s Dividend and Yield on Cost
Projection of Microsoft‘s Dividend and Yield on Cost
The graphics again confirm my investment thesis that Microsoft seems to be the slightly more attractive pick for dividend growth investors, since you could potentially achieve a significantly higher Yield on Cost when investing over the long term.
The Companies’ Valuation
In terms of Valuation, it can be highlighted that Microsoft has the slightly higher P/E [FWD] Ratio (32.49 when compared to Apple’s 28.97).
Microsoft also has the slightly higher Price / Sales [TTM] Ratio (11.08 when compared to 7.19) and the higher Price / Cash Flow Ratio [TTM] (27.50 compared to 24.90).
Discounted Cash Flow Model for Apple
My DCF Model currently shows an intrinsic value of $148.54 for the Apple stock. At the company’s current stock price of $171.77, this implies a downside of 13.5%.
Internal Rate of Return for Apple
Below you can find the Internal Rate of Return for Apple calculated with my DCF Model: at the company’s current stock price of $171.77, my DCF Model indicates a compound annual rate of return of approximately 7%. (In bold you can see the compound annual rate of return for Apple’s current stock price of $171.77.)
|
Purchase Price of the Apple Stock |
Internal Rate of Return as according to my DCF Model |
|
$150.00 |
10% |
|
$155.00 |
9% |
|
$160.00 |
9% |
|
$165.00 |
8% |
|
$170.00 |
7% |
|
$171.77 |
7% |
|
$175.00 |
7% |
|
$180.00 |
6% |
|
$185.00 |
5% |
|
$190.00 |
5% |
|
$195.00 |
4% |
Source: The Author.
Discounted Cash Flow Model for Microsoft
My DCF Model shows an intrinsic value of $297.68 for the Microsoft stock at this moment in time. At the company’s current stock price of $307, this implies a downside of 3%.
Internal Rate of Return for Microsoft
Below you can find the Internal Rate of Return for Microsoft calculated with my DCF Model: at the company’s current stock price of $307, my DCF Model indicates a compound annual rate of return of approximately 9%. (In bold you can see the compound annual rate of return for Microsoft’s current stock price of $307.)
|
Purchase Price of the Microsoft Stock |
Internal Rate of Return as according to my DCF Model |
|
$260.00 |
14% |
|
$270.00 |
13% |
|
$280.00 |
12% |
|
$290.00 |
11% |
|
$300.00 |
10% |
|
$307.00 |
9% |
|
$310.00 |
9% |
|
$320.00 |
8% |
|
$330.00 |
7% |
|
$340.00 |
7% |
|
$350.00 |
6% |
Source: The Author.
The fact that my current DCF Models indicate an expected compound annual rate of return of 9% for Microsoft, and only 7% for Apple, once again strengthens my belief to select Microsoft over Apple.
The Companies’ Profitability
In terms of Profitability, I also see Microsoft as being slightly ahead of Apple: this is the case because Microsoft has a higher Gross Profit Margin (68.52% compared to 43.18%) and a higher EBIT Margin (41.42% compared to 29.16%) than its competitor.
The Companies’ Growth Perspectives
In terms of Growth, I once again consider Microsoft to be slightly ahead of its competitor. My opinion is based on the following facts: Microsoft has shown a Revenue Growth Rate [FWD] of 11.78% while Apple’s is at 4.02%. In addition to that, Microsoft has shown an EBIT Growth Rate [FWD] of 12.39% while Apple’s is only 3.52%.
These metrics once again underline my investment thesis that Microsoft is the slightly better pick for dividend growth investors.
In addition, I believe that Microsoft has even stronger growth perspectives in the years ahead due to the fact that it operates in areas such as cloud services (with Microsoft Azure) and Artificial Intelligence (through the company’s investments in OpenAI), thus providing the company with additional growth potential from which investors can benefit.
The Seeking Alpha Quant Ranking
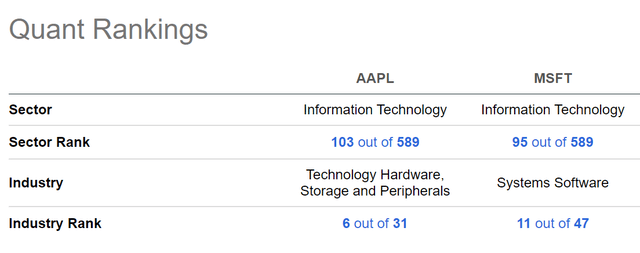
According to the Seeking Alpha Quant Ranking, Microsoft also appears to be the slightly more attractive pick for investors: Microsoft is ranked 95th while Apple is ranked 103rd (both out of 589) within the Information Technology Sector, serving to further confirm my investment thesis.
Risk Factors
In general, I consider the risk of investing in Microsoft and Apple to be relatively low. This is because both companies have strong competitive advantages, an excellent position within their industry, a strong balance sheet and an enormous Profitability.
The relatively low risks that come attached to an investment in these companies are further underlined by the fact that they both have a credit rating of Aaa from Moody’s.
In addition to that, the companies have a broad and diversified product portfolio, which implies a lower risk level for investors.
However, when I compare the risk factors that come attached to each investment, I consider Microsoft to be the slightly less risky investment when compared to Apple. My opinion is based on several metrics, which I will discuss in the following.
Microsoft’s lower 24M Beta of 1.18 (when compared to Apple’s of 1.22) and its lower 60M Beta of 0.93 (Apple’s is 1.30), serve as an indicator that Microsoft is the less risky investment when compared to Apple.
In addition to that, Microsoft has the higher EBIT Margin [TTM] (41.42% compared to 29.16%) and the higher Total Cash position ($104.42B compared to $55.87B). Microsoft also has a significantly lower Total Debt to Equity Ratio (40.74% compared to 176.35%). These metrics serve as additional indicators that the risk of investing in Microsoft is slightly lower.
In addition to that, Microsoft has the higher Current Ratio (1.91 compared to 0.94) and the higher Quick Ratio (1.66 compared to 0.76), once again pointing toward selecting Microsoft over Apple when aiming for the lower risk investment.
Conclusion
In my opinion, both Apple Inc. and Microsoft Corporation are attractive long-term investments. Both are among the largest positions of my own investment portfolio (Apple is my largest position) and I suggest overweighting both companies in a portfolio that focusses on a long-horizon and aims to provide you with dividend growth while being attractive in terms of risk and reward.
However, as I have shown in this analysis, I consider Microsoft to be the slightly better choice at this moment in time, particularly for dividend growth investors.
This is the case as the company has a slightly higher Dividend Yield [FWD] (0.88% compared to 0.55%), has shown a higher Dividend Growth Rate [CAGR] over the past 5 years (9.92% compared to 7.82%) and my DCF Model indicates a higher expected compound annual rate of return for Microsoft (9%) than it does for Apple (7%).
Furthermore, I see Microsoft as being ahead of Apple when it comes to Growth, which is underlined by the company’s EBIT Growth Rate [FWD] of 12.39% (while Apple’s is at 3.52%).
In addition to that, I see the risk factors as being slightly lower for Microsoft investors (Microsoft has a 60M Beta of 0.93 and Apple’s is 1.30), which, once again, supports my theory to select Microsoft Corporation over Apple Inc.
Analyst’s Disclosure: I/we have a beneficial long position in the shares of AAPL, MSFT either through stock ownership, options, or other derivatives. I wrote this article myself, and it expresses my own opinions. I am not receiving compensation for it (other than from Seeking Alpha). I have no business relationship with any company whose stock is mentioned in this article.
Author's Note: Thank you for reading! I would appreciate hearing your opinion on this comparative analysis on Microsoft and Apple. Do you own any of these companies or plan to acquire them?
Seeking Alpha’s Disclosure: Past performance is no guarantee of future results. No recommendation or advice is being given as to whether any investment is suitable for a particular investor. Any views or opinions expressed above may not reflect those of Seeking Alpha as a whole. Seeking Alpha is not a licensed securities dealer, broker or US investment adviser or investment bank. Our analysts are third party authors that include both professional investors and individual investors who may not be licensed or certified by any institute or regulatory body.

