Summary:
- Apple finally comes to the AI party with its share price potentially looking for the $260-$275 region next.
- Left in a wake behind the other AI major associated equities, AAPL has become Wall Street’s problem child of late, with a huge share of the device market but encountering a period of indecision as to where its share price would move next.
- In this article, we will cover some info on the company before looking into my buy signal at $160 for this equity and see what technical evidence there is that the long-awaited break of $200 will hold.
nayuki
Conor McGregor once said that we are all equals as human beings and not one of us is more talented than the other, it is simply hard work that defines us. This may or may not be true depending on your interpretation of greatness.
Have we seen examples of this through business? We certainly have, the father who came from nothing to build an empire only to watch it crumble under his offsprings leadership who was cut from a visionary different cloth.
Is the Apple (NASDAQ:AAPL) corporation a modern derivative of this in the futuristic world we live in, and has its current CEO arrived later to the AI party than its original emperor would have. A question that will never be answered, but it is interesting to note that the major equities that employ AI associated integration have been well outperforming Apple in recent years as the world’s most valuable company depending on what day it is at the moment, has developed a problem child status among investors and Wall Street.
By this, I mean technically, the delay in breaking the $200 barrier showed a flaw in appetite compared to the other giants in its class.
So with the announcement of AI integration into its products this month, is Apple finally back in favor after an indecisive period and if $200 can hold, where is this stock going next?
For our readers who follow my analysis, I have a buy signal for Apple issued in March 2023 at $160 with Seeking Alpha, in this article we will look into the company’s performance of late and analyze the charts to see if we can gauge a future price from this latest breakout.
In the past year, Apple has seen a slight percentage decline each quarter in its EPS releases, although they have managed a small beat each quarter. Revenue has been an astonishing average of 90.5 billion during this period, with modest beats on each occasion.
In May, Apple announced a 10% decline in sales but said it was planning a $110 billion share buyback, while also revealing that the company has a staggering 2.2 billion devices that are active worldwide.
Dominance
2023 saw Apple dominate Samsung in the smartphone market for the first time since 2010. While Samsung remains a major player and the front-runner in competition to Apple in this area, their shipments were down 226 million in 2023, which combined with Apples admitted 10% decline shows an overall picture that global demand is slipping recently possibly on high inflation and the cost of living issues.
Smartphone performance Chart (Techhq)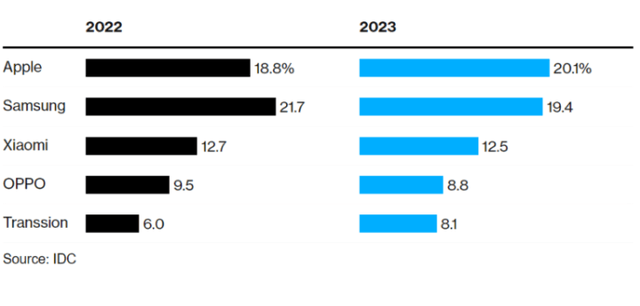
“Stronger for longer”
Evercore ISI analyst Amit Daryanani said in a client note this week that AI features will have a staggered roll-out and will not be fully available until 2025. He also noted that iPhone 16 sales will be “stronger for longer” as these features gradually roll out, perhaps suggesting that iPhone 16 sales may see a prolonged sales process compared to previous models as customers switch to using AI on their smartphones for the first time.
So the big question is, can this latest AI integration to its products act as the catalyst to launch this equity higher and improve sales long term.
Now we can move to the monthly chart to examine the structure Apple has been sitting in.
Apple Monthly Chart (C trader)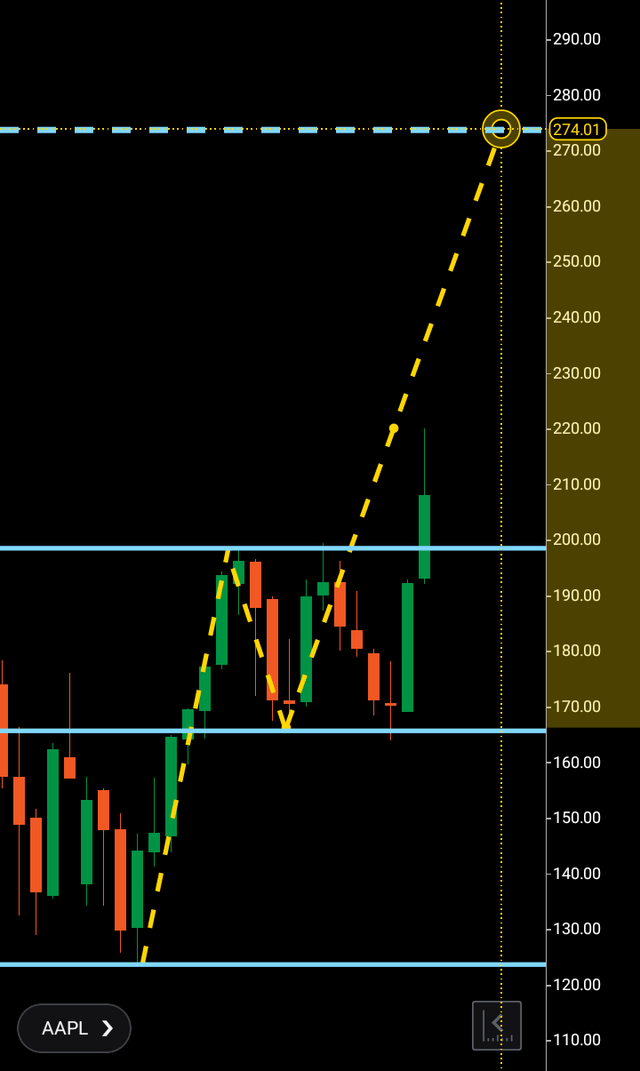
Firstly, we can see the wave of bullish buying from the $125 region that peaked at $200. This can be taken as the wave one.
Then we can see the three bearish months from $200 to $165, which counts as the wave two. There is nothing abnormal about these three months of selling but compared to the more bullish action we have seen in this market it does count as quite sluggish.
Then we can see the re attempt from $165 to break above $200 to launch the third wave towards $275 which it does, only to pip a dollar over the previous resistance and then slump into a protracted four months of selling even taking out the original low of the wave two briefly before re attempting another assent.
Following the news of AI integration, we can then see Apple smashing through the $200 region so far, topping out at $220. This is what I have been waiting for, in order for a third wave either not be classed as a fake out or to lend probability that it is actually looking to go higher, a financial market must find a rejection candle on a timeframe over resistance then beat that rejection.
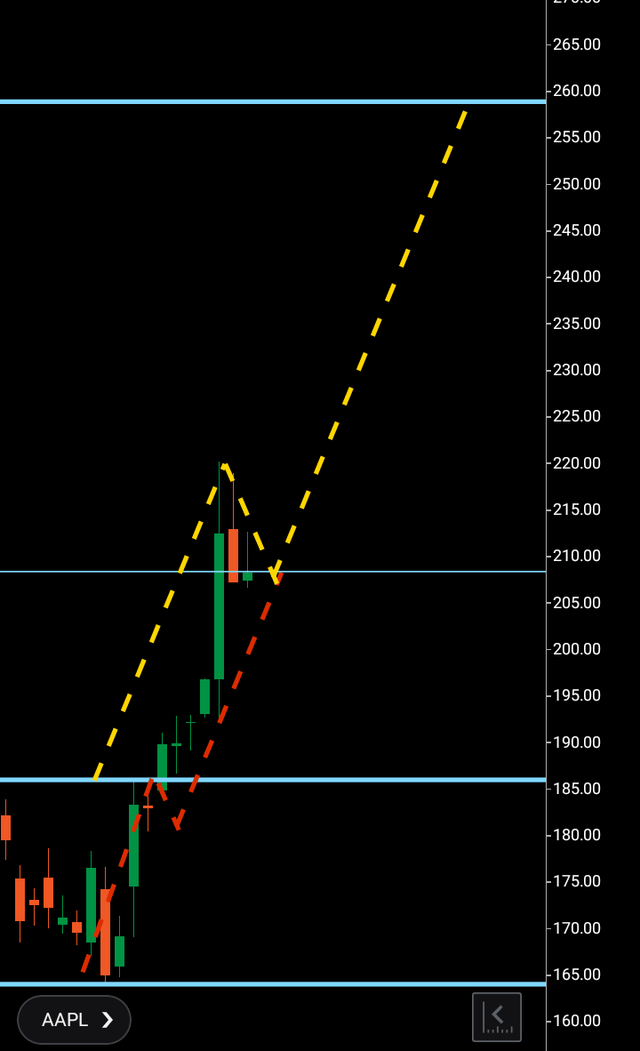
The weekly chart shows evidence of this as the immediate buying cooled from $220 creating a rejection candle which now paves the way for this move higher to hold should the $220 be broken above.
Here is that exact picture as we can see with the original three wave patterns from the weekly chart $165-$186 completing at $208. As financial markets go higher, they must make three wave patterns that include buying and selling on all timeframes, this is now Apples new attempt to break even higher in this weekly structure by finding buying to $220 and rejection interestingly to just below the target of the first third wave at $208.
We can clearly see that should $220 be broken above, Apple will look to launch an additional third wave to the $260 area on this chart.
Bearish Scenario
At the moment, there isn’t a technical bearish scenario in play. It could be that $220 isn’t broken above, which then leads to an additional drop and return into its $200-$165 structure, something that the coming weeks will show us.
Conclusion
If Apple can break above $220 we can see that both the weekly wave to $260 and monthly wave to $275 are very much in play. I am issuing a hold signal until $220 is broken above lending tangible probability that this equity wants to go higher long term.
Analyst’s Disclosure: I/we have no stock, option or similar derivative position in any of the companies mentioned, and no plans to initiate any such positions within the next 72 hours. I wrote this article myself, and it expresses my own opinions. I am not receiving compensation for it (other than from Seeking Alpha). I have no business relationship with any company whose stock is mentioned in this article.
Seeking Alpha’s Disclosure: Past performance is no guarantee of future results. No recommendation or advice is being given as to whether any investment is suitable for a particular investor. Any views or opinions expressed above may not reflect those of Seeking Alpha as a whole. Seeking Alpha is not a licensed securities dealer, broker or US investment adviser or investment bank. Our analysts are third party authors that include both professional investors and individual investors who may not be licensed or certified by any institute or regulatory body.
