Summary:
- Berkshire Hathaway’s sale of half its Apple stake raises questions, especially with the upcoming AI-integrated iPhone 16 and Apple’s shift to organic chip modems.
- Despite Berkshire’s move, my analysis suggests AAPL remains bullish, with the potential to reach $275 within 180-240 days.
- Technical charts show Apple’s three-wave pattern, indicating strong resistance and support levels, with bullish momentum likely to continue.
- Apple’s strategic innovations and market shifts position it well for future growth, making it a compelling investment despite recent stock movements.
ozgurdonmaz
It is said that in 1944, Warren Buffett submitted his first tax return deducting $35 for the use of his bicycle and watch while doing the paper round as a teenager. Born savvy, one could say. The world’s most famous investor recently sold half of Berkshire Hathaway’s holding in Apple and as this stock may look to go higher, there is general puzzlement among the financial world.
Does Mr. Buffett know something we don’t, is he freeing up cash to diversify Berkshire’s portfolio, only he will know that.
Readers who follow my analysis will be aware that I issued a buy signal for Apple (NASDAQ:AAPL) in March of last year at $160 and the reality is, compared to some of the top 10 major US equities for example, it has been a slow mover.
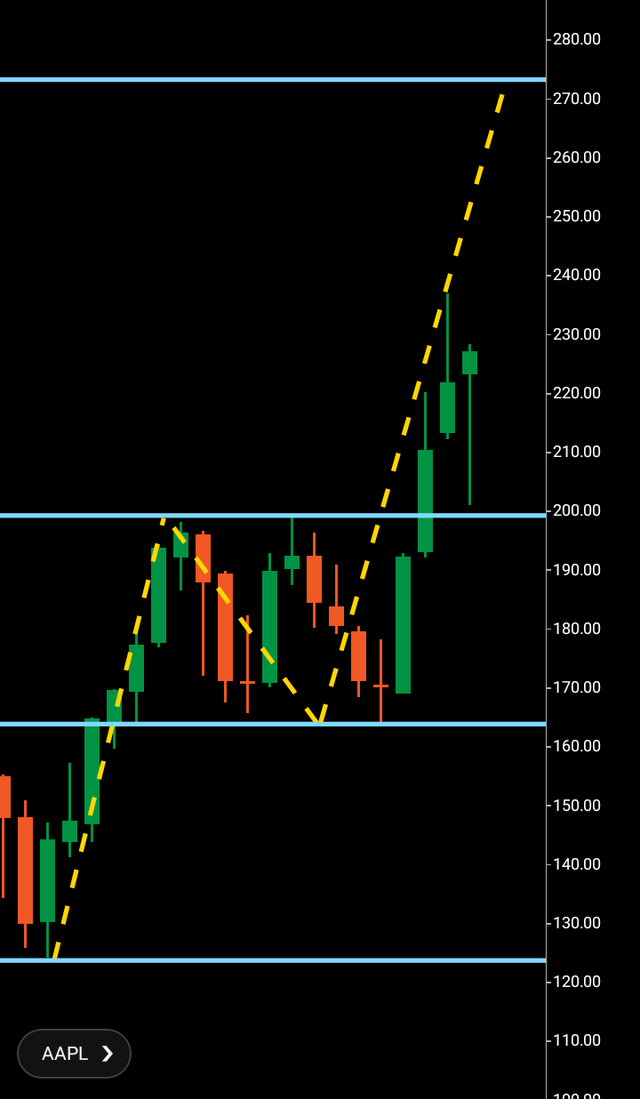
A snapshot technical summary before we cover this element in more detail later, Apple created a pattern to $275 by the break of $200 on the monthly chart according to my analysis in late 2023 before retreating and struggling to re break resistance in an indecisive pattern until May of this year finally saw a rejuvenated bullish buy up.
Apple, among the elite of elite that carry dominance in their sector, in this article we will look into the company going forward as well as analyzing the charts to examine where this equity may be looking to go next price wise as the stock market emperor partially sells out while the share price may look to go higher.
Berkshire’s decision to sell half its stake in Apple comes with curious timing, the company is due to release their latest iPhone to their line-up on September the 9th.
The iPhone 16 will be the first smartphone in Apple’s inventory that will feature AI. Also, interestingly, Apple has looked to move away from using Qualcomm’s chips which they have used for over ten years into using their own organic chip modems in a bid to become more efficient and self-dependable as the AI evolution takes shape. However, this move has not come without complications, Apple has been working on manufacturing its own 5G chip since 2018. It could be that the company underestimated the complexity of its move into organic manufacturing of these key components.
Last year, Apple extended their contract to use Qualcomm’s chips until 2027. The key will be a delicate balance of ensuring their own manufactured modems will power AI features sufficiently, while choosing to activate an option with Qualcomm for a further several years while continuing their in-house development.
With these types of efficiency and market evolving shifts being made by the tech giant to be self-sufficient as AI integrates through their products in the future, continued strong sales and a large cash balance. Can we perhaps observe it is the latter of the reasons that Berkshire has decided to partially sell, free up some cash and diversify their portfolio?
Let’s move onwards to the charts to technically prospect where Apple may look to go next price wise.
We can see on the monthly chart below the initiation of the wave one from $125-200. Remarkably given the overall upward trajectory of the whole market, this wave started in December 2022 and contained six straight months of bullish buying eventually pausing at the $200 area to create the wave two rejections which saw the price fall off that high to settle around $165 before picking up momentum towards resistance once again.
Apple monthly structure (C trader)
On a technical note, Apple did pip higher very slightly technically launching a third wave to $275 only to retreat back into its structure again, even piping lower from the wave two only to find traction again to re attempt for resistance that was broken through, before Apple pierced $240 so far in this third wave structure.
Sometimes financial markets can take this course, by that I mean pip through support or resistance slightly before quickly turning around in the other direction. Personally, like all my analysis when reading three wave patterns lending probability as to the future price of a financial market, I like to see tangible timeframes create three wave patterns above or below resistance to indicate that the market will actually take this course and not just pip below or above resistance.
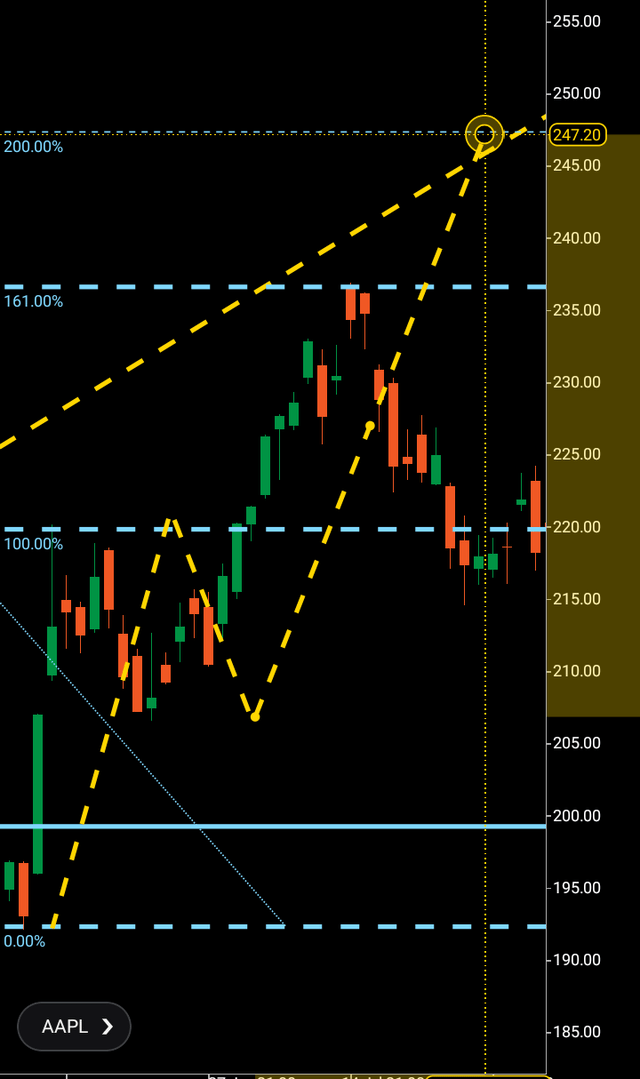
An example below is from the Apple break of $200 on the daily chart, we can see bullish buying candles above the $200 region along with bearish selling candles that then get broken above launching a third wave on the daily that has so far bounced of the Fibonacci 161 exactly and is due to complete circa $247 (On this daily timeframe), overall, we are looking at the monthly chart in this article, I would just like to give our readers and example from timeframes within the monthly that also give different targets within the macro picture.
Conclusion
The upcoming launch of the iPhone 16 that will see full AI integration is an exciting moment for this tech giant. The charts suggest no immediate bearish case for this equity. It would not surprise me if we saw another month selling on the way to $275 if Apple is going to get there. Overall, I would expect Apple to arrive at this target within 180-240 days.
Analyst’s Disclosure: I/we have no stock, option or similar derivative position in any of the companies mentioned, and no plans to initiate any such positions within the next 72 hours. I wrote this article myself, and it expresses my own opinions. I am not receiving compensation for it (other than from Seeking Alpha). I have no business relationship with any company whose stock is mentioned in this article.
Seeking Alpha’s Disclosure: Past performance is no guarantee of future results. No recommendation or advice is being given as to whether any investment is suitable for a particular investor. Any views or opinions expressed above may not reflect those of Seeking Alpha as a whole. Seeking Alpha is not a licensed securities dealer, broker or US investment adviser or investment bank. Our analysts are third party authors that include both professional investors and individual investors who may not be licensed or certified by any institute or regulatory body.

