Summary:
- Apple Inc. is filing its Q2 2023 report in a week – it’s time to take a look at the adequacy of Wall Street’s expectations for the company’s earnings.
- Based on my analysis, the current estimates most likely do not fully reflect the fluctuations of DXY – at least Apple’s revenue consensus estimate is at risk for Q2 FY2023.
- Apple’s P/E in relation to the S&P 500 Index is about 1.2x. The last time it was this high was in 2007-2008 – just before the GFC.
- The technical picture I see today predicts a 17-29% decline in AAPL from current price levels. And I see no fundamental reasons why this cannot happen in the foreseeable future.
- My previous “Sell” rating remains unchanged this time. I expect AAPL stock to trade on facts after the Q2 FY2023 report.
Nikada/iStock Unreleased via Getty Images
Introduction
The reporting season is now in full swing – 87% of companies in the S&P 500 (SPX) Index should report by May 5, 2023. This explains the abundance of articles on Seeking Alpha lately, which you could well notice yourself.
I also could not get past that as well – especially from the big tech companies’ results – because Q1 FY2023 may be very important for the dynamics of the whole market in the coming months. You may have noticed that a plethora of negative fundamental news has accumulated in recent weeks – from the US regional banking crisis to a downward trend in some leading economic indicators. However, the S&P 500 Index ETF (SPY) has continued to ignore this – this is a question for a separate article I may write soon (so stay tuned). However, one reason for the persistence of SPY is the assumption that big techs’ earnings are sustainable. This assumption has become almost common for all FANGMAN companies, regardless of their business model. As a result, various asymmetries and inefficiencies occur in the market from time to time, allowing us to predict earnings exaggerations or post-fact price movements with a higher degree of probability.
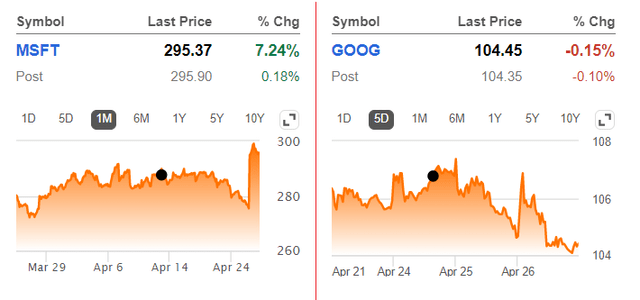
Such was the case with Microsoft Corp (MSFT) and Alphabet Inc (GOOG) (GOOGL). On April 14, I published an article on MSFT reiterating my earlier “Buy” rating and suggested that the company’s earnings estimates may be too low at the time and that the company is likely to beat them again or provide positive guidance, sending the stock price higher. On April 24, I wrote about Google and downgraded my rating from “Buy” to “Sell” on the basis that the stock could sell off on earnings because FY2024 and FY2025 forecasts are likely to be revised downward after the Q1 facts. Here’s how the market reacted to the above companies’ earnings – MSFT rose big and GOOG lost all of its pre-market gains on April 26 despite the double-beat of its EPS consensus:
Maybe my calls just got lucky this time – I cannot claim to have found the secret formula for determining EPS beats and after-fact price actions. But perhaps investors really need to pay attention to what is priced into the stocks and which of those predictions fall somewhat short of reality. I suggest applying similar analytical practices to Apple Inc. (NASDAQ:AAPL) to check whether the company can outperform Wall Street’s expectations and what kind of reaction investors should expect in the most likely scenario. Let’s dive in.
What Do We See From Apple’s EPS Revisions?
Seeking Alpha Premium provides a unique opportunity to look at how the market’s consensus forecasts have changed for each of the coming quarters (and even years!) related to EPS and revenue volumes. If we try to evaluate AAPL’s next reporting quarter, which is expected to become fact in a week (on May 4), we’ll notice that the estimated EPS of $1.39 has decreased by only 1 cent (-0.72%) in the last 12 days, which is completely insignificant, but still reflects a bit of concern and an attempt to slightly hedge the forecasts, which gives Apple a margin of safety for a beat (I assume). But I also noticed that the current estimate for Q2 FY2023 is only 2 cents (-1.42%) lower than it was at the end of October 2022 (6 months ago) – since then Apple stock has risen 6.8%, and the average decline in quarterly EPS forecasts through Q4 FY2024 (inclusive) was 2.91%.
What can it say to us? Judging by the insignificance of the EPS downward revisions, the market is most likely assuming that Apple will get off lightly in the next few quarters and return to its usual trajectory of high single-digit EPS growth rates in the next few years after FY2023. This is also confirmed by the annual EPS estimates:
Seeking Alpha, AAPL’s EPS estimates [author’s notes]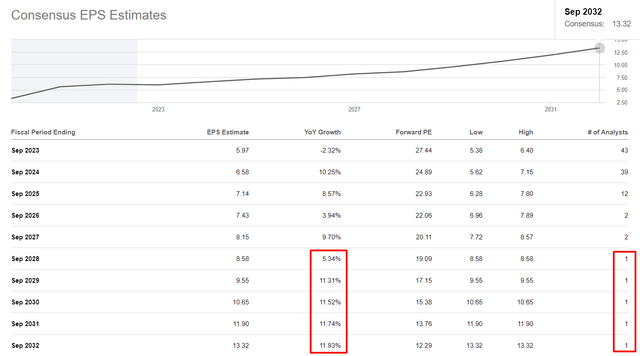
Since FY2028, EPS forecasts are given by only 1 analyst, so I don’t take them seriously.
So – the main question – how justified are these forecasts?
I do not undertake to make a judgment several years in advance – extrapolation usually works terribly when it comes to forecasting financial performance, so I will limit myself to judging only for the medium term (a few months in advance).
At the end of Q1 (ending December 31, 2022), Apple reported a QoQ EPS growth of 45.7%, which is explained by the seasonality of the company’s sales. For the same period last year [2021], AAPL reported QoQ growth of 70.7%, and a year earlier growth was about 127%. So here and now, there is an actual slowdown in growth. But for next year, analysts see QoQ growth of 54% over the company’s Q1 – meaning the market expects the company to have overcome most of its difficulties by then. In fact, Wall Street expects Apple to win even earlier – in Q4 FY2023 (ending Sept. 30), the company should nearly double QoQ earnings per share growth compared to 2022 (in 2021 there was a seasonal QoQ decline so it’s impossible to compare here). Actually, the Street believes the company should start recovering from Q2 FY2023 when its QoQ EPS growth should decline significantly less than last year [-23.9% vs. -27.6%].
Excel, author’s work, Seeking Alpha data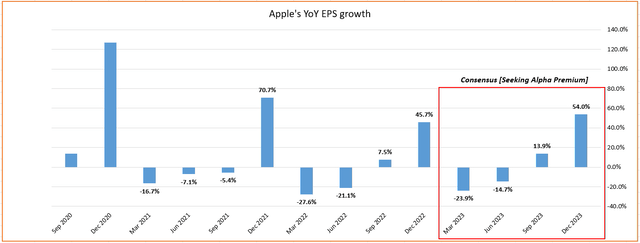
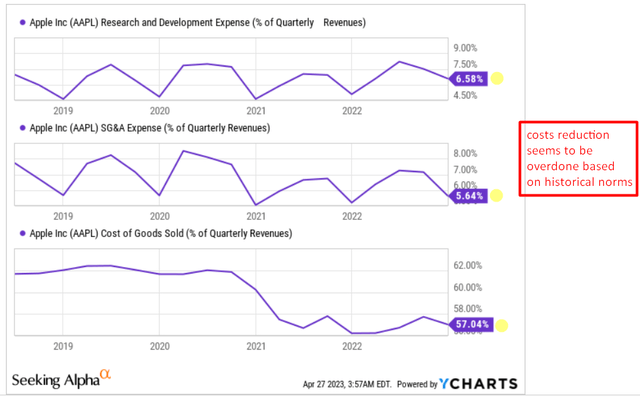
This is despite the fact that the ratio of Apple’s most important expenses to the top line has already fallen seasonally – this is especially true for the cost of sales [COGS]:
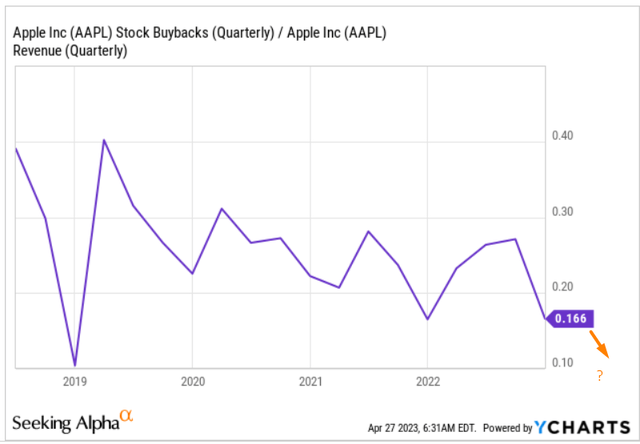
It seems to me that the cost-cutting efforts and Apple’s desire to move production from China to India and other emerging markets are only being viewed through a bullish lens, so to speak. After all, these are manufacturing facilities for non-service products, which still account for over 80% [combined] of AAPL’s total revenue. A shift to India should reduce Apple’s political (and operational) risks – good for the company’s cost of capital. But this effort comes at the expense of new investments and likely fewer buybacks as the cash cushion is depleted – a bad sign for shareholders.
SA News, author’s notes YCharts, author’s notes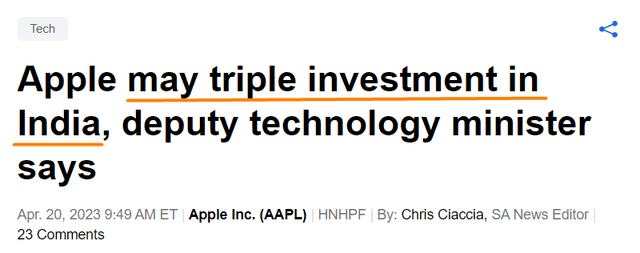
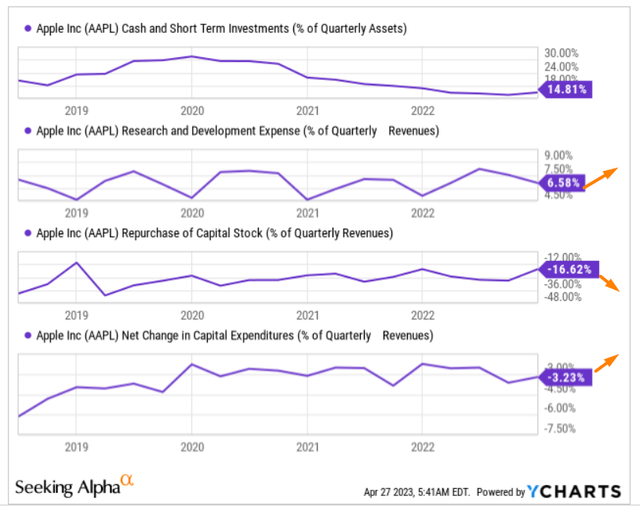
All of this suggests that forecasts for Q3 and Q4 of FY2023 may be overly inflated by the market and another round of downward revisions will be needed in the future to get a more balanced view on AAPL’s prospective growth path.
But what about Q2 FY2023? I suggest you recall FY2016 and Mr. Cook’s explanation of why revenue fell 8% YoY that year:
Net sales declined 8% or $18.1 billion during 2016 compared to 2015, primarily driven by a year-over-year decrease in iPhone net sales and the effect of weakness in most foreign currencies relative to the U.S. dollar, partially offset by an increase in Services.
Source: AAPL’s 10-K for FY2016, emphasis added by the author
Then, in fiscal 2016, the average monthly value of the U.S. dollar index (DXY) increased by 11.4% in the most profitable quarter for Apple, which was such a big hit to revenue when converted to USD.
Now, the market is predicting a decline in Q2 FY2023 EPS of only -5.93% year-over-year. The problem, however, is that Q2 FY2023 DXY was up 6.42% YoY:
Seeking Alpha, DXY, author’s calculations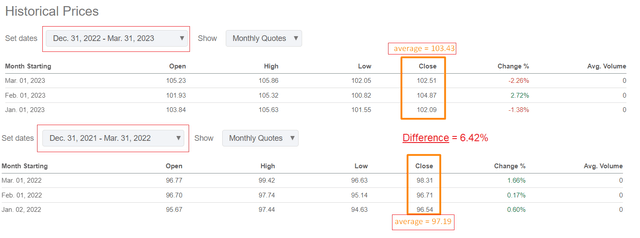
That is, analysts’ forecasts most likely do not fully reflect the fluctuations of DXY – at least Apple’s revenue consensus estimate is at risk for Q2 FY2023. If DXY remains at current levels through the end of Q3, the change from Q3 FY2022 will be only +0.29% YoY – not much, but it still represents a small headwind to projected EPS growth of 1.28% YoY.
But maybe the overall consumer demand for Apple products is up in Q2 FY2023 compared to last year. I decided to test this with Google Trends, taking the average of Q2 [13 weeks] FY2023 and the same period last year.
Google Trends, search for “iPhone”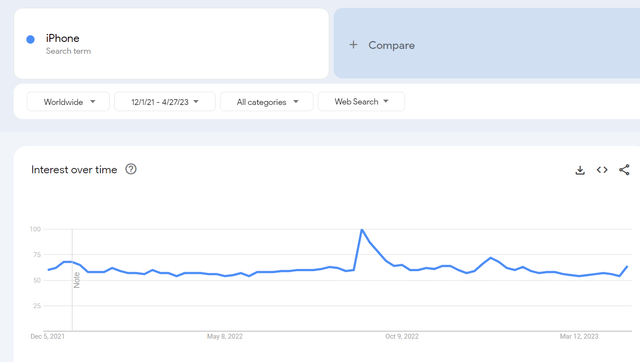
According to my calculations, in the analyzed period of this year, the index has increased from 58.31 last year to 58.54 – this does not mean that sales are better, it just shows the interest in searches for the flagship product. This interest did not really decrease in Q2 – but maybe people just looked at the selling prices and decided to move on?
The Fragility Of Apple’s Valuation
I have written about this in my previous articles, but I’ll repeat it again – Apple’s P/E in relation to the S&P 500 Index is about 1.2x. The last time it was this high was in 2007-2008 – just before the GFC:
ROIC.ai, author’s calculations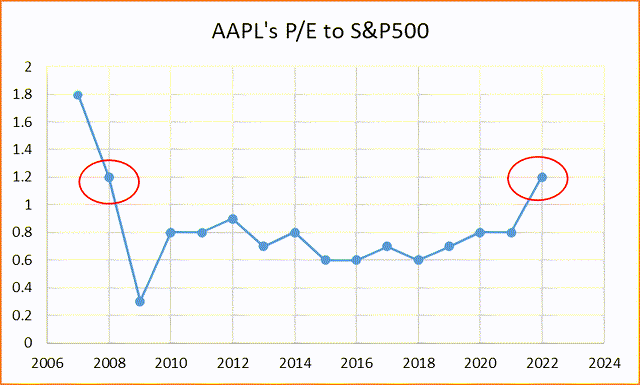
As we can see, the company’s valuation proved to be completely insensitive to the new reality in which fast-growing companies were shrinking by 50-80% in market cap during 2022. Apple proved to be a safe haven for many investors – everyone looked at the huge cash cushion and probably believed that Apple would continue to buy up its shares and justify its high multiples. Now, however, we see that the company’s business cycle has reversed – demand is slowing, cash on the balance sheet is declining (as % of total assets), and so is the volume of shares being bought back.
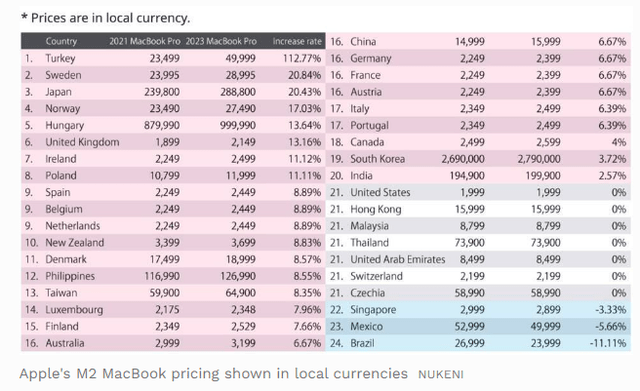
At the end of January 2023, Forbes wrote about how the company’s products have increased in price by ten percent – it would seem that sales should grow very strongly in Q2:
But already at the end of April comes the news that Apple will most likely be forced to raise the prices of its products again because the costs have increased by 20%:
I already hinted at the beginning of the article that the current gross profit margin seems to be peaking – I expect that if not in Q2, then in Q3 and Q4 we will see the full impact of rising costs, and laying off a small number of employees will not help Apple fix the situation. Yes, new projects in the financial/healthcare sectors are good. But these are talks about the future and an additional revenue stream. Where is the growth in the core business?
Again, in the long run, multiples over 20x might be justified as wages in India are 5 times lower than in China – AAPL will still get a cost cut. But that takes time, and the market prices the net positives already now. So the high risk of further downward EPS revisions makes the company’s relatively high valuation too fragile to buy AAPL stock before the upcoming report.
Apple Stock’s Technical Analysis
Since the last AAPL report, the stock is already trading 10.6% higher – the market does not seem to be paying attention to external factors and is hoping for another positive guidance from Mr. Cook. However, from a technical analysis perspective, AAPL is also very vulnerable. The stock broke through its strong local resistance level in mid-April and rolled back – this false breakout only confirmed the strength of sellers at price levels above $165 per share.
TrendSpider Software, author’s notes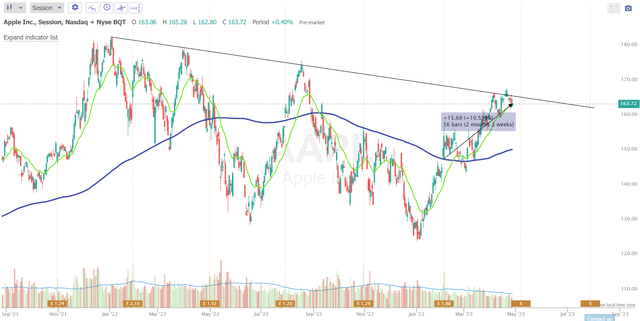
The weekly chart looks no less scary: the broad downward trend channel is holding its positions, and the AAPL price has approached its upper boundary, showing weakness for the second week in a row. The stochastic – an indicator of the strength and direction of the movement – shows a reversal of the local bullish trend. We have already seen similar signals at a similar height in 2022 and earlier – at that time, the AAPL price fell quite quickly and deeply.
TrendSpider Software, author’s notes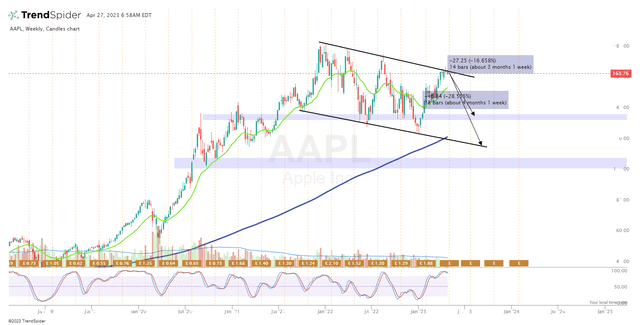
The technical picture I see today predicts a 17-29% decline in AAPL from current price levels. And since I see no fundamental reasons why this cannot happen in the foreseeable future, my previous “Sell” rating remains unchanged this time as well.
Summing-Up
My bearish view and corresponding rating for AAPL stock have a lot of upside risks to keep in mind.
First, as I have written in other SA articles, the market always looks at guidance first and EPS and revenue second. At first glance, this may seem counterintuitive, but the example of many companies with their share price performance after the fact proves it. So if Mr. Cook prepares a speech for investors about AI-related developments that can greatly increase margins and bring additional business growth, my entire thesis will lose its meaning, and AAPL stock will repeat MSFT’s recent success.
Second, Wall Street analysts are more deeply immersed in AAPL’s business, which I must admit – perhaps their forecasts are much closer to reality than mine, and accordingly, my thesis will be irrelevant in this case as well.
But despite these risks, I think it’s likely that Apple will either miss its earnings forecasts this time around due to slowing consumer demand and a stronger-than-expected U.S. dollar in Q2 [YoY], or the management won’t be able to convince the Street that the future is bright [more negative than expected guidance]. The risk of not selling AAPL stock based on these facts has become very high today, in my opinion. Therefore, I expect a downside potential of 17-28% in the medium term, based on the price chart and common sense backed by some calculations you see above.
Let me know what you think about it all in the comment section below. Thank you for reading!
Analyst’s Disclosure: I/we have no stock, option or similar derivative position in any of the companies mentioned, and no plans to initiate any such positions within the next 72 hours. I wrote this article myself, and it expresses my own opinions. I am not receiving compensation for it (other than from Seeking Alpha). I have no business relationship with any company whose stock is mentioned in this article.
Seeking Alpha’s Disclosure: Past performance is no guarantee of future results. No recommendation or advice is being given as to whether any investment is suitable for a particular investor. Any views or opinions expressed above may not reflect those of Seeking Alpha as a whole. Seeking Alpha is not a licensed securities dealer, broker or US investment adviser or investment bank. Our analysts are third party authors that include both professional investors and individual investors who may not be licensed or certified by any institute or regulatory body.
Struggle to navigate the stock market environment?
Keep your finger on the pulse and have access to the latest and highest-quality analysis of what Wall Street is buying/selling with just one subscription to Beyond the Wall Investing! Now there is a free trial and a special discount of 10% – hurry up!

