Summary:
- Over ten years, Apple’s operating and levered free cash flow have increased by over 100%.
- Over the same period, substantial cash flow has been plowed into share buybacks and debt reduction such that cash flows/shares have increased over 200%.
- Apple is currently trading near its 52-week high and 18% above its 5Yr average PE within a broader gloomy market and economic outlook.
- I would not, however, advise any investor to sell a winning position in a company like Apple without first considering managing portfolio risk more broadly.
mustafaU
Introduction
Investors and consumers alike love Apple Inc. (NASDAQ:AAPL). Consumers can be a strange bunch but most investors are easier to understand; I suspect what most investors love most about Apple are its market-crushing historic returns.
Total Return
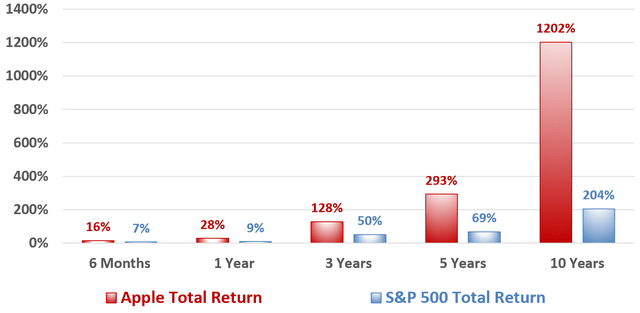
Recently, Apple has outperformed S&P 500 by 9%, 19%, and 78% over 6 months, 1 year, and 3 years respectively. Over 5 years and 10 years, Apple outperformed S&P 500 by 224% and nearly 1000%.
Although Apple is clearly easy to love, it may be a little harder to determine exactly why Apple has been a superhero like business and investment. I would not argue against Apple’s revolutionary technology or consumer devotion to its products, but I will argue that Apple’s ultimate superpower is cash flow.
What Does Superpower Cash Flow Look like?
I love graphs a little bit more than the seventy or so lines of a typical cash flow statement probably because I’m not any kind of genius. As an analyst, I find the process of handling and plotting the data a great deal more than just a useful chore or a means to support an opinion. After spending several hours over a few days with Apple cash flows, I concluded Apple’s superpower is cash flow and superpower cash flow looks the plot below.
Superpower Cash flow
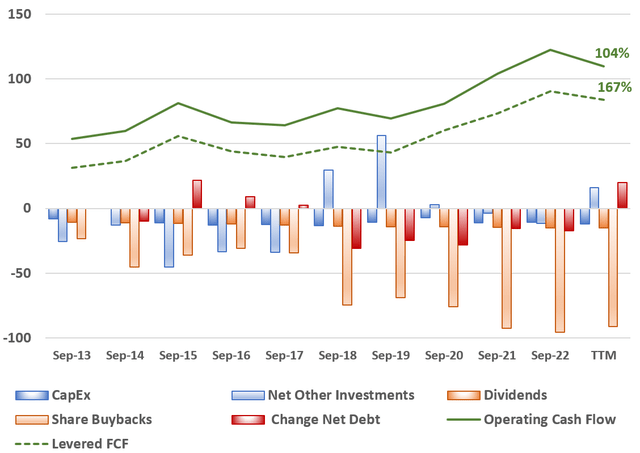
Over ten years operating cash flow increased 104% while levered free cash flow increased 167%. Several discretionary cash flow line items are represented by the blue, orange, and red columns. Apple invested an average of $16B in CapEx and other investments while rewarding shareholders with an average of $74B in dividends and share buybacks in each year since 2013. At the same time, net debt was reduced by a total of over $73B.
Like all superpowers, cash flow can be squandered or applied wisely for long term benefit. Recall that levered cash flow increased 63% more than operating cash flow over the last ten years; two major factors are reduced net debt and share buybacks.
Interest Expenses/Operating Cash Flow
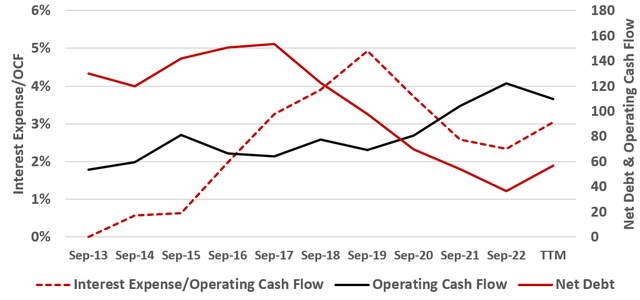
Net debt reached a peak of over $150B in 2017 and has subsequently been reduced to less than $60B. As a result, interest expenses are extraordinarily low at about 3% of operating cash flow.
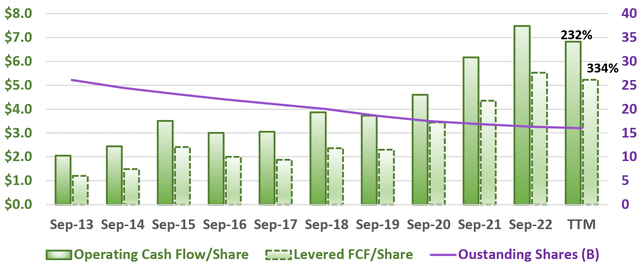
Further, over the last ten years, Apple has plowed almost $670B of its operating cash flow into share buybacks and reduced outstanding shares by almost 40%. The result is greater cash flows per share.
Annual Cash Flow/Share
Reduced share count not only reduces the number by which operating cash flow and free cash flow are divided, it also reduces cash flow on dividends. As a result of decreased share count, decreased dividend expenses, reduced debt, and other factors, operating cash flow/share has increased 232% vs the 104% increase in operating cash flow. At the same time, levered cash flow/share has increased 334% vs the 167% increase in levered cash flow.
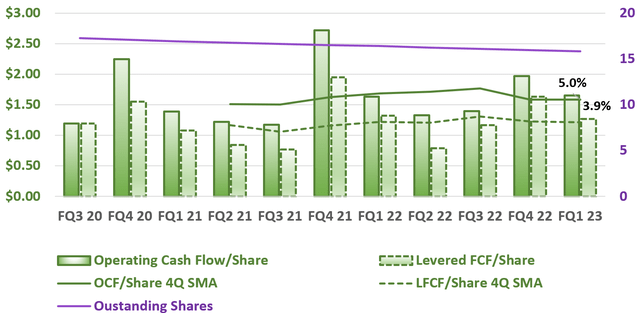
More recently cash flow growth has decreased moderately as illustrated by the plot below.
Quarterly Cash Flow/Share
This quarterly plot is analogous to the annual cash flow plot above with the addition of two lines. The 4 quarter simple moving averages of operating cash flow/share and levered free cash flow/share are plotted by the solid green and dashed green lines respectively. Despite recent challenges, the FQ1 23 averages over 4 quarters of operating cash flow/share and levered free cash flow/share are 5.0% and 3.9% higher respectively versus FQ1 21 values.
Risks
Given Apple’s cash flow super powers, reduced share count, and low debt burdens, risk is generally associated with broader economic concerns. These broader concerns include inflation, rising interest rates, reduced consumer spending, and even recession. Analysts expect FY 23 revenue at $385.4B to fall versus FY 22 revenue of $394.3B. FY 23 EPS is expected to fall to $5.87 from $6.15 in FY 22.
Further, Apple may be already be overpriced when compared to its own historical PE ratio.
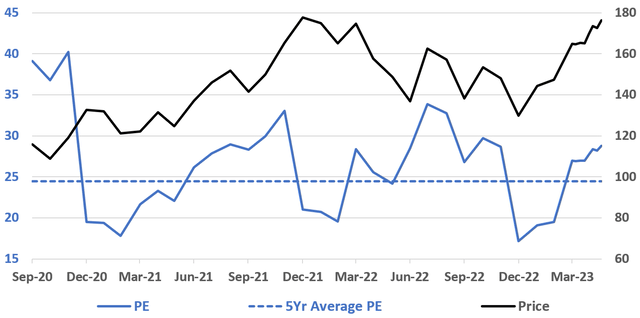
PE Ratio vs 5Yr Average
Apple PE ratio has oscillated about its own 5Yr average several times in recent years. PE is currently at 28.8 and almost 18% above its own 5Yr average of 24.5.
Although PE ratios are based on empirical data, they remain a reflection of market sentiment and expectations. Any market upset could shift sentiment such that Apple’s PE could contract towards and even below its 5Yr average.
Conclusion
With super power cash flows and prudent management, Apple remains a relatively favorable investment in most economic conditions. At the same time Apple is currently trading just below its 52 week high while PE is elevated above its 5Yr average.
I would not however advise any investor to sell a winning position in a company like Apple without first considering managing portfolio risk more broadly. Investors could first consider reducing exposure to growth, technology, or equities as a whole. One could also consider countering some downside risk through individual options or a broad inverse ETF. I recently recommended ProShares Short QQQ ETF (PSQ) on recession fears and falling earnings. I took my own advice and am currently managing a PSQ position equal to about 5% of my trading portfolio.
Finally, I often end my writing with a quote:
Just the discipline of having to put your thoughts in order with somebody is a very useful thing” – Charlie Munger
I generally provide no explanation; but in this case I will add that writing helps me refine my own investing decisions. I am also confident and thankful that readers will let me know in comments if I have finally lost my mind entirely.
Analyst’s Disclosure: I/we have a beneficial long position in the shares of PSQ either through stock ownership, options, or other derivatives. I wrote this article myself, and it expresses my own opinions. I am not receiving compensation for it (other than from Seeking Alpha). I have no business relationship with any company whose stock is mentioned in this article.
Seeking Alpha’s Disclosure: Past performance is no guarantee of future results. No recommendation or advice is being given as to whether any investment is suitable for a particular investor. Any views or opinions expressed above may not reflect those of Seeking Alpha as a whole. Seeking Alpha is not a licensed securities dealer, broker or US investment adviser or investment bank. Our analysts are third party authors that include both professional investors and individual investors who may not be licensed or certified by any institute or regulatory body.

