Summary:
- Applied Materials’ growth outlook remains positive with expansions from key customers like TSMC, Samsung, and Intel driving growth in the US and Europe.
- Market share remained stable at 19% in Q1 2024, with ASML being overtaken by Applied Materials currently, but we expect ASML to recover in the second half of the year.
- While we expect moderate improvement in revenue and margins, the company’s 50% stock price surge has put it at prices we believe are too expensive.
Sundry Photography
In our previous analysis of Applied Materials, Inc. (NASDAQ:AMAT), we believed that the company’s growth outlook remains positive despite concerns over geopolitical tensions impacting semiconductor equipment firms, with a robust growth performance in the US and Europe driven by expansions from key customers such as TSMC (TSM), Samsung (OTCPK:SSNLF) and Intel (INTC). In terms of market share, we highlighted the company dropped to second place as ASML overtook it.
In this analysis, we covered the company again following its incredible stock price surge of almost 50% since our previous analysis and determined whether the run-up was justified. We examined the company’s fundamentals in terms of whether there has been a significant improvement in the company’s fundamentals in terms of revenue growth or margin improvement. Additionally, we determine whether it could regain its top-spot position in terms of market share as a reason for investor optimism. Finally, we examined whether the company’s run-up is due to company or market-specific reasons based on valuation ratio analysis and whether is there a positive and rising investor sentiment on semicon equipment market outlook that is justified.
Moderate Improvement in Revenue and Margin Outlook
Firstly, the company’s stock price since our previous analysis in January 2024 has increased by almost 50%. We analyzed the company’s fundamentals in terms of revenue and profit growth to determine whether it was the reason for its stock price runup.
We first compiled the company’s H1 FY2024 and compared it with the H1 2023 performance to identify any growth acceleration based on its past performance, then we also examined the management guidance for its next quarter growth YoY (Q3 FY2024) compared to its previous quarter’s actual revenue growth for further indication of accelerating growth. Additionally, we compared current analysts’ consensus growth for FY2024 with the earlier consensus in January 2024 to compare whether analysts are more optimistic about Applied Materials’ growth outlook for the full year.
|
Applied Materials |
H1 FY2023 |
H1 FY2024 |
Q2 FY2024 |
Q3 FY2024 Management Guidance |
Previous Analysts’ Consensus (Jan 2024) |
Analysts’ Consensus (Jun 2024) |
|
Revenue |
13,370 |
13,353 |
6,646 |
6,650 |
26,183 |
26,940 |
|
Revenue Growth % YoY |
6.8% |
-0.1% |
0.2% |
3.5% |
-1.3% |
1.6% |
|
EPS |
3.9 |
4.22 |
2.07 |
1.97 |
7.69 |
8.37 |
|
EPS Growth % YoY |
3.4% |
8.2% |
10.7% |
5.8% |
-5.8% |
2.6% |
|
Net Margin |
24.2% |
26.2% |
26.2% |
24.5% |
24.3% |
25.7% |
Source: Company Data, Khaveen Investments
Based on the table, H1 FY2024 revenue growth YoY was flat (-0.1%), 6.9% lower compared to the comparable period’s growth rate in H1 FY2023 of 6.8%, indicating moderating sales growth performance in H1 2024. However, in terms of quarterly growth, management guidance for Q3 FY2024 is higher by 3.3% YoY compared to the actual growth for the previous quarter, indicating an improving outlook for the company. Furthermore, current analysts’ consensus for the company’s growth in June 2024 is higher by 2.9% compared to when we covered the company previously in January 2024. Based on the company’s earnings briefing, management highlighted several positive drivers for its growth, including the rise of GAA node “to generate more than $2.5 billion of revenue” and potentially double next year. Management also stated HBM packaging-related revenue is expected to increase by 6x this year to over $600 mln instead of 4x initially due to higher demand. Additionally, despite an expected drop-off in China DRAM sales which were $500 mln in the previous quarter, management expects the drop to be offset by demand for its ICAPs and “leading-logic strength” which we believe supports the better growth outlook for the full year.
In terms of profitability, the company’s EPS growth in H1 FY2024 is 8.2% YoY compared to H1 2023, indicating an improvement, while the net margin also increased slightly by 2% despite a drop in revenues. This is as the company’s Semiconductor segment operating margins have remained stable despite the slowdown in growth, while its Applied Global Services segment operating margin expanded by 2%. However, management guidance for EPS growth in Q3 2024 is 5.8% YoY, which is 4.9% lower compared to Q2 2024, with a 1.7% lower net margin as well. Finally, analysts’ consensus estimates consensus for EPS growth have improved based on current estimates for FY2024 compared to January 2024 with 8.4% higher growth, as well as a higher margin of 1.4% which further indicates a better outlook for its profitability growth.
|
Applied Materials Revenue Forecast ($ mln) |
2023 |
2024F |
2025F |
2026F |
|
Revenue |
26,517 |
26,671 |
30,868 |
35,562 |
|
Growth % |
2.8% |
0.6% |
15.7% |
15.2% |
Source: Company Data, Khaveen Investments
Based on Applied Materials’ earnings call transcript in Q4 FY2023, we believe the slowdown in the above revenue growth is attributed to what management described as a decrease in demand for the ICAPS business compared to 2022. This decrease may be “mainly due to softness in the industrial automation and automotive end-markets” as well as a “lower utilization in Q4”. Furthermore, this may be further linked to the lower spending on semiconductor and wafer fabrication equipment, as noted by management.
To conclude, Applied Materials fundamentals in terms of revenue growth indicate a slight improvement with higher guidance YoY in Q3 compared to the previous quarter and higher analysts’ revenue consensus, as well as positive earnings growth in H1 2024 compared to the same period last year and higher analysts’ consensus estimates for EPS growth and margins. However, despite this, we believe the 50% surge in stock price is not fully explained by fundamental factors, as revenue and earnings growth have been much lower, suggesting other factors. We revised our previous revenue projections for the company with a full-year growth forecast of 0.6% which we prorated based on actual Q1 to Q2 revenues and Q3 management guidance which is lower compared to our previous forecast of 15.8%, but we expect its growth to improve going into 2025 with indications of accelerating growth as explained based on management guidance, maintaining our previous forecast for 2025 and beyond for a 3-year forward average of 10.5%.
Stable Market Share
In the next point, we examined whether the rise in the company’s stock price was due to an improvement in market share and whether the company could regain its top-spot position in terms of market share.
We updated our market share of the top 5 semicon equipment companies based on their revenue by semicon equipment systems in Q1 2024. Then, we compared Applied Materials with the market in the latest quarter and identified how it has changed compared to 2023. We also updated our revenue projections for each company from our previous analyses to update our overall market share forecasts through 2026.
Company Data, SEMI, Khaveen Investments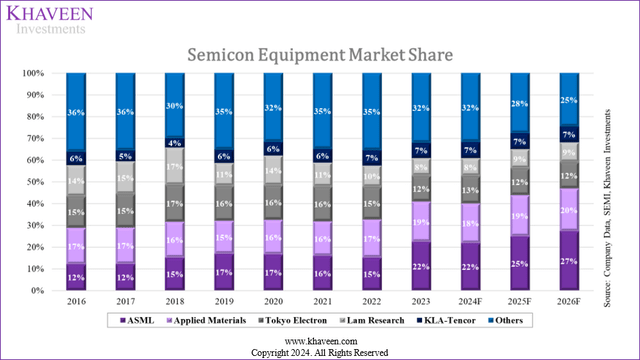
|
Company |
Q1 2024 Market Share |
Semicon Equipment Revenue (Q1 2023) ($ bln) |
Semicon Equipment Revenue (Q1 2024) ($ bln) |
Q1 2024 Growth (YoY) |
|
ASML (ASML) |
16% |
5.87 |
4.31 |
-26.6% |
|
Applied Materials |
19% |
4.98 |
4.90 |
-1.5% |
|
Tokyo Electron (OTCPK:TOELF) |
14% |
3.55 |
3.65 |
3.1% |
|
Lam Research (LRCX) |
9% |
2.26 |
2.40 |
6.2% |
|
KLA-Tencor (KLAC) |
7% |
1.90 |
1.77 |
-7.0% |
|
Others |
35% |
8.26 |
9.37 |
13.5% |
|
Total |
100% |
26.81 |
26.40 |
-1.5% |
Source: Company Data, Khaveen Investments
Based on the chart, Applied Materials market share in Q1 2024 remained steady at 19%, similar to its share in 2024. On the other hand, ASML, regained its position in the top spot as market leader in 2023 following the surge in lithography sales as the company’s Chinese customers ramped up demand ahead of the US sanctions being effective as analyzed previously. However, ASML’s position slipped to the second behind Applied Materials as its growth in Q1 2024 contracted by -26.6% YoY, which may be due to an expected slowdown in Logic segment-related revenue following the strong growth in 2023 “as customers digest the capacity additions”, thus allowing Applied Materials to retake its top position it lost in 2023 to ASML. Other companies such as Tokyo Electron and Lam Research have gained back some share in Q1 2024 that they lost in 2023 while KLA-Tencor remained stable. Tokyo Electron had a strong increase in DRAM sales evidenced by the increase in DRAM sales proportion from 16% to 27% across the year “due to active investment by Chinese customers”, and for Lam Research, we believe its growth may be attributed to “a growing demand for high bandwidth memory and sustained investment in domestic China”.
All in all, we do not believe Applied Materials’ surge in stock is justifiable based on its market share performance. The company regained its position as the number one company in terms of market share in Q1 2024, but its market share was stable at 19% compared to 2023 as its growth rate of -1.5% was in line with the market. Instead, it was due to ASML’s contraction, which is facing customer lithography equipment digestion issues in the near term. Therefore, we do not believe the company’s 50% rise in share price is due to it regaining the top spot in the semicon equipment market. However, for the full year of 2024, we expect ASML growth to recover in the second half of the year for an overall full year flattish growth outlook (0.2%) which is in line with management guidance compared to its -26.6% growth rate in Q1 2024. In comparison, we forecast Applied Materials full-year growth of 0.6% based on prorated results and management guidance, overall resulting in a slightly lower market share than ASML. Beyond that, we expect ASML’s market share to strengthen against Applied Materials with a superior forward projected growth of 24% due to the exposure of ASML to the lithography market compared to Applied Materials at a projected forward revenue growth of 15.5%. This is because we believe lithography equipment is most critical for the advancement of process technology such as EUV for scaling down to 3nm to enable high-performance logic chips. Also, ASML has a dominant market position with a 22% market share as covered in our previous analysis. This is due to ASML’s superior lead in terms of lithography technology capabilities with continuous product development, such as with high-NA EUV, which is expected to become necessary for the process node scaling among top logic chipmakers. This includes its leading capability with a 8nm resolution and alongside the 13.5nm EUV wavelength on its EXE:5000 EUV machine, overall enabling the production of advanced nodes at 2nm and below, as what we have previously covered.
Semicon Market Valuation Soars
In the next point, we further examined the company’s valuation ratios to determine whether the surge in stock price was due to an optimistic market outlook.
In this analysis, we updated the current valuation ratios including P/S, P/E and P/FCF for the top 5 semicon equipment companies from our previous analysis of Lam Research. We compared them with the historical ratios and average to examine whether there is a growing trend.
|
Ratio Comparison |
Current P/S |
P/S Average (4-year) |
Current P/E |
P/E Average (4-year) |
Current P/FCF |
P/FCF Average (4-year) |
|
Lam Research |
10.16x |
5.42x |
40.07x |
21.65x |
31.86x |
23.59x |
|
Growth (%) |
38.8% |
19.7% |
32.3% |
18.0% |
47.8% |
-2.0% |
|
ASML |
14.81x |
11.23x |
54.36x |
41.79x |
162.19x |
46.49x |
|
Growth (%) |
51.9% |
5.3% |
58.8% |
-4.3% |
96.0% |
38.5% |
|
KLA |
12.30x |
6.51x |
45.22x |
22.73x |
38.34x |
21.30x |
|
Growth (%) |
48.9% |
15.2% |
53.2% |
10.2% |
51.8% |
12.4% |
|
Tokyo Electron |
8.33x |
5.93x |
41.99x |
23.85x |
50.62x |
55.26x |
|
Growth (%) |
30.0% |
36.5% |
27.2% |
31.1% |
-21.3% |
106.9% |
|
Applied Materials |
7.85x |
3.87x |
28.49x |
16.72x |
30.58x |
18.61x |
|
Growth (%) |
86.0% |
14.4% |
74.6% |
3.5% |
107.6% |
-0.2% |
|
Average |
10.69x |
6.59x |
42.03x |
25.35x |
62.72x |
33.05x |
|
Growth (%) |
48.6% |
9.3% |
46.6% |
5.5% |
50.3% |
19.6% |
Source: GuruFocus, Khaveen Investments
GuruFocus, Khaveen Investments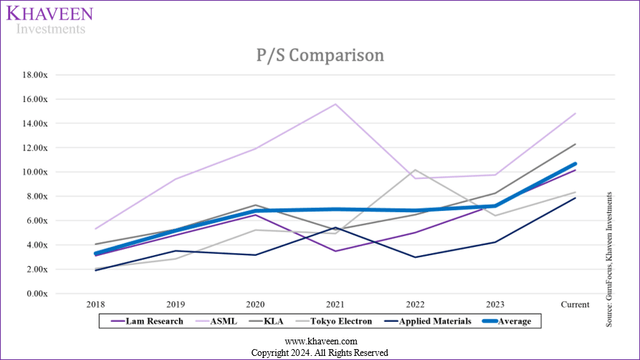
Based on the above, the average current P/S ratio of the top 5 companies is 10.69x, which has increased by 48.6% compared to 2023 and is higher than the four-year average (6.59x) by 17.2%. In terms of Applied Materials, its average P/S has increased by 86% compared to 2023. Since our previous coverage, it has increased by 50% in Jan 2024 (5.2x), this is due to a 50% rise in the company’s stock price while its revenue growth was flattish at less than 1%. However, despite the increase in its P/S ratio, it is still below the market average (10.69x).
GuruFocus, Khaveen Investments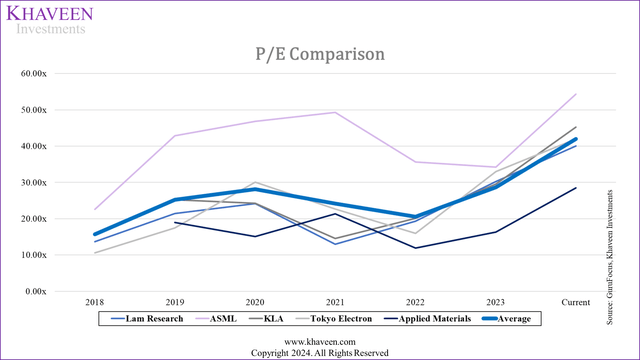
Additionally, we observed an increase of 46.6% of the current market P/E ratio across the top 5 companies in 2023 and is also higher than the four-year average (25.35x). When looking at Applied Materials, its current P/E ratio has increased by 74.6% compared to the previous year. Since our previous coverage, its ratio has increased by 48%, mainly due to the 50% rise in its stock price, while EPS TTM grew by 2.4%. However, while Applied Materials’ ratio has increased, it is still below the other 4 top companies as well as the market average (42.03x).
GuruFocus, Khaveen Investments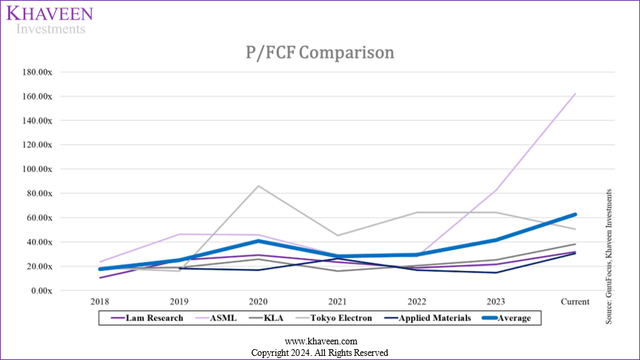
In terms of the P/FCF ratio, the current market average across the top 5 companies also increased by 50.3% and is around 30x higher compared to the market’s four-year average (33.05x). The current P/FCF ratio for Applied Materials increased by 107.6% compared to 2023 to 30.58x, 1.6x higher compared to its 4-year historical average ratio of 18.61x. Since our previous coverage, its ratio increased by 62% as its stock price rose by 50% while its FCF TTM declined by 11%.
Overall, we believe the rise in the company’s stock price is mainly due to buoyant market sentiment as we see chips as fundamental to technological advancement in the wake of the rise of AI, Cloud, IoT, ADAS and 5G technologies. Furthermore, we believe another reason for the strong sentiment is the recovery in the semicon market at a 16% market forecast following the decline in 2023. Additionally, top memory chipmakers’ capex is expected to improve this year as highlighted in our analyses of Micron whereas in the logic segment, we expect a strong growth outlook for major chipmakers catering to AI following the surge in data center segment-related chips such as GPUs and networking chips from Nvidia, AMD and Broadcom. We believe the rise of AI spurring increasing performance requirements to enable AI advancements is needed due to the increasing computational capabilities of AI models which are needed to train larger and more sophisticated AI models which are enabled by more logic chips. Thus, we see the increasing demand for chips spurring more equipment demand to support capacity expansions to produce more chips, which we expect to benefit Applied Materials due to its specialization on etch and deposition equipment which are fundamental processes in the production of chips.
Risk: Short-Term Market Growth Headwinds
We believe one of the risks for Applied Materials is the short-term semicon market growth headwinds. According to Semiconductor Intelligence, the semicon industry capex growth for 2024 is projected to decline by 2%, following a 7% decline in 2023. As mentioned in the first point, the company’s H1 FY2024 revenue growth performance had been muted, which we believe indicates the impact of the market growth headwinds on the company. However, we believe the company’s improved guidance for its Q3 growth outlook indicates a positive indication of a potential recovery. Furthermore, we expect its recovery to be supported by several growth drivers such as HBM and ICAPs, as well as its top customers’ expansion drive in the US and Europe, which may lead to a stronger growth recovery than expected.
Verdict
To conclude, we believe that the company’s incredible stock price surge is neither primarily attributable to company fundamentals such as revenue growth and earnings performance nor its market share positioning. While the company’s guidance indicates signs of recovery, we revised the full-year growth forecast to 0.6%, lower than the previous 15.8%, though we anticipate growth to accelerate in 2025 with a 3-year average of 10.5%. Furthermore, the company regained its lead in the semicon equipment market in Q1, but this was mainly due to short-term headwinds in ASML, which we expect to overtake Applied Materials again due to its strong position in the high-growth lithography market. Instead, we believe the company’s surge in stock price may be driven by positive market sentiment on the semicon industry growth optimism with rising demand for chips driven by AI, Cloud, IoT, ADAS and 5G technologies, spurring demand for more equipment benefiting Applied Materials’ which specialized in the fundamental etch and deposition process.
Company Data, Khaveen Investments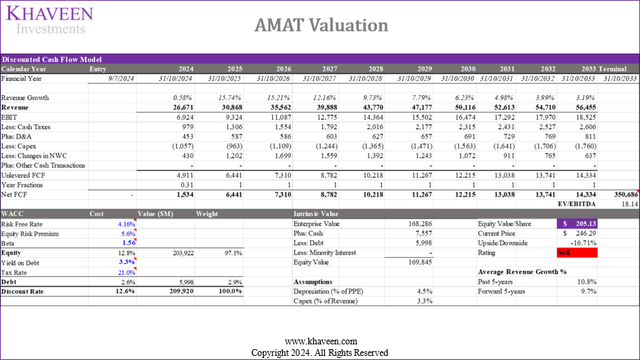
However, in terms of valuation, based on a discount rate of 12.6% (company’s WACC), interest-bearing debt based on Q2 2024 of $6 bln (including short-term borrowings, current portion of long-term debt, current portion of lease obligations, long-term debt and capital leases) and terminal value based on the 5-year average of the top semicon equipment companies’ EV/EBITDA of 18.14x, our DCF model now shows a downside of 16.71% for the company with a price target of $205.13, given the nearly 50% surge in the company’s stock price since our previous analysis, surpassing our previous price target $190.42. Thus, we downgrade the company as a Sell. This is despite the company’s valuation ratios still being relatively lower compared to peers’ average as highlighted in the 3rd section of this analysis, as all of the top semicon equipment companies’ valuation ratios have also risen, which, we believe, is due to the strong positive investor sentiment amid the semicon industry recovery and super growth trends such as AI which may bode well for the overall semicon equipment growth outlook.
Analyst’s Disclosure: I/we have a beneficial long position in the shares of AMAT either through stock ownership, options, or other derivatives. I wrote this article myself, and it expresses my own opinions. I am not receiving compensation for it (other than from Seeking Alpha). I have no business relationship with any company whose stock is mentioned in this article.
No information in this publication is intended as investment, tax, accounting, or legal advice, or as an offer/solicitation to sell or buy. Material provided in this publication is for educational purposes only, and was prepared from sources and data believed to be reliable, but we do not guarantee its accuracy or completeness. This fundamental research and analysis represent one of many investments that we cover. The rating on this investment may not represent our actual position in the investment given our multi-faceted investment strategies that also encompass the outlook of various industries, sectors, countries, and asset classes. In this case, we have exposure to the investments disclosed above from industry-wide or sector-wide investments. Use of this information in non-conjunction of our investment strategies and portfolio management may not yield the desired results.
Seeking Alpha’s Disclosure: Past performance is no guarantee of future results. No recommendation or advice is being given as to whether any investment is suitable for a particular investor. Any views or opinions expressed above may not reflect those of Seeking Alpha as a whole. Seeking Alpha is not a licensed securities dealer, broker or US investment adviser or investment bank. Our analysts are third party authors that include both professional investors and individual investors who may not be licensed or certified by any institute or regulatory body.
