Summary:
- Accenture has shown moderate revenue growth, but with red flags like decreased operating margin and diluted EPS.
- Accenture has raised its dividend for 4 consecutive years.
- The recommendation is to “Hold” until clearer signs of sustainable growth or decline emerge.
- Accenture demonstrates high earnings quality, with free cash flow exceeding net income.
JHVEPhoto
Thesis
Accenture (NYSE:ACN) has shown moderate revenue growth but with certain red flags, like a decreased operating margin and diluted EPS. While the company does exhibit strength in several financial metrics, risks like slowing revenue growth, decrease in net bookings, and increased operational costs do exist.
Utilizing a Dividend Discounted multi-stage model, the investment thesis takes into account steady growth in dividends paid out and a decrease in total debt. However, the cost of capital (~10%) is close to the 5Y CAGR for revenue (5.9%) and Adjusted EBITDA (4.7%), suggesting that the company’s returns are roughly in line with the risk involved, neither exceptionally good nor bad.
Overall, the recommendation is to “Hold” until clearer signs of sustainable growth or decline emerge.
Overview
Accenture reported financial results for the fourth quarter and full fiscal year ended August 31, 2023.
After diving into the financials, here’s what stands out. Revenue growth is up by 4% in U.S. dollars for both the fourth quarter and the entire fiscal year, a positive sign. However, the operating margin slipped from 14.7% to 12% in Q4 and 15.2% to 13.7% for the full year, which is a bit concerning.
As for Earnings Per Share, the picture is mixed. The GAAP diluted EPS dropped from $2.60 to $2.15 in Q4, although the adjusted EPS did rise by 4%. When you look at the dividend yield, it’s at a modest 1% but has grown by 15% year-over-year. That’s a good sign, especially since it makes up 30% of Free Cash Flow, suggesting it’s likely to stick around.
The company’s also sitting on a pretty hefty cash reserve, nearly $8 billion, which suggests strong liquidity. Currently, the company trades at a valuation of 21 times next year’s free cash flow.
Red Flags – Initially, growth rates were estimated at 10-11%, but after the recent earnings, the management have scaled back the projections to 8-9% for the next year. Stock-Based Compensation (SBC) has risen from 2.7% to 3% of revenues, which could dilute shareholder value.
Consulting revenues have dipped by 2% in both U.S. dollars and local currency, suggesting they aren’t as valuable in the current economic climate. New bookings are also down 10% in Q4 compared to last year, signaling a dip in demand for what the company offers.
Yet, there are some bright spots adding value to the company. For instance, 106 clients had quarterly bookings above $100 million. Then there’s the $300 million in Generative AI bookings in the last six months, which could be a long-term value driver. Financially, the company is standing on solid ground, almost debt-free, and shows strong management skills, thanks in part to Julie Sweet’s leadership and a strategy focused on cash flow.
To sum it all up, the long-term outlook seems promising, largely thanks to a robust financial standing with $8 billion in the bank and almost no debt. Add in a $3 billion investment in AI, a 13% EBITDA growth rate, and a sustained EBITDA margin of 16.9% for the last four years, and things look good for the company’s sustainability and growth. The GAAP operating margin is expected to rise by 110 to 130 basis points, which hints at increasing operational efficiency.
Free Cash Flow Analysis
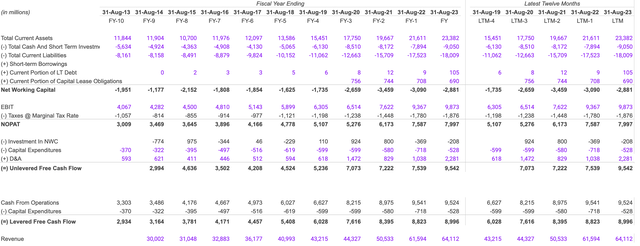
Net Working Capital is still in the red, but it’s less bad than before, improving from -$3.46 billion to -$2.88 billion. On the cash flow front, Unlevered Free Cash Flow has grown nicely, going from $7.22 billion to $9.54 billion. Levered Free Cash Flow improved from $8.39 billion to $8.99 billion. Revenue is also up, but the growth rate is slowing down. It jumped from $50.53 billion to $64.11 billion, but if you look closely, the rate of growth is less than before.
Red Flags: The negative Net Working Capital in the last two periods means there’s been a rise in current liabilities, and that’s a potential problem. Slowing revenue growth is another concern. We’re talking about an $11 billion growth from 2021 to 2022, but just a $2.5 billion increase from 2022 to 2023.
Looking at next year’s forecast, the assumptions are pretty straightforward. Revenue growth is expected to slow down further, only adding about $2 billion, making the projected total $66.11 billion. The EBIT margin is expected to hold steady at 15.4%, which would put the EBIT for next year at around $10.18 billion.
As for liquidity and solvency, the company has no worries. A current ratio of 1.29 is a good sign of short-term financial health. Plus, there’s no data suggesting any long-term debt, so solvency likely isn’t an issue. However, the revenue slowdown does add an element of risk to future profitability. And let’s not forget, negative Net Working Capital could increase the company’s dependency on external financing.
Cash Conversion Cycle
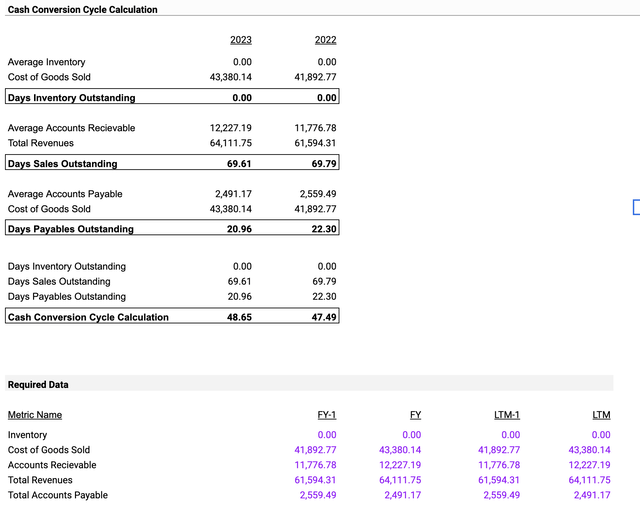
When we look at the company’s cash conversion cycle, Days Sales Outstanding has remained almost the same, moving only slightly from 69.79 days in 2022 to 69.61 days in 2023. Meanwhile, Days Payables Outstanding shows a small decrease, going from 22.30 days to 20.96 days. This basically means the company is settling its bills with creditors a tad quicker than before. On another note, the Cash Conversion Cycle has gone up a bit from 47.49 days to 48.65 days, indicating that it’s taking longer to convert the company’s resources into cash.
Turning our attention to next year’s financial forecast, a couple of assumptions guide the projections. First off, revenue growth is expected to stick around at 4.08%. Cost of Goods Sold (COGS) is also anticipated to increase at a similar rate to this year, which is 3.56%. Doing a bit of math, the forecasted revenue for 2024 is slated to be about $66,696.57 million, calculated as $64,111.75 million multiplied by 1.0408. Likewise, the forecasted COGS for the same year is estimated at around $44,935.05 million, gotten by multiplying $43,380.14 million by 1.0356.
So, what’s driving the value here? A stable revenue growth rate of 4.08% suggests a healthy financial future, and the decrease in Accounts Payable signifies that the company is doing well when it comes to managing its short-term financial commitments.
Shareholder Yield
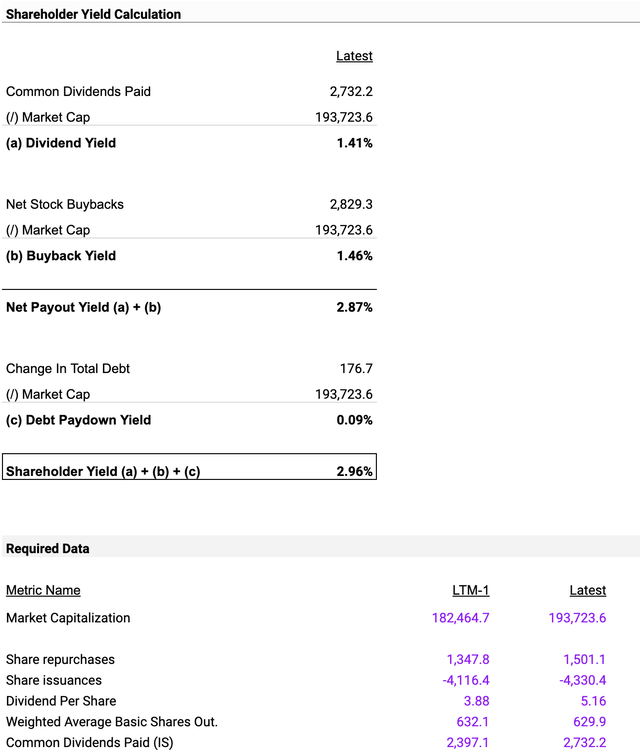
When looking at the company’s financial performance in terms of shareholder returns, several key metrics jump out. First off, the company has paid out $2,732.2 million in common dividends. Given its market capitalization of $193,723.6 million, that translates into a dividend yield of 1.41%, offering a moderate return for those investing primarily for dividends. In addition to that, the company has been actively buying back its own stock, with net stock buybacks totaling $2,829.3 million. This activity has resulted in a buyback yield of 1.46%, generally considered a positive indicator as it suggests the company believes its stock is undervalued.
Now, if you combine that dividend yield of 1.41% with the buyback yield of 1.46%, you arrive at a net payout yield of 2.87%. This basically means that a fairly decent chunk of money is being returned to shareholders through dividends and buybacks.
However, it’s not all rosy. The company’s total debt increased by $176.7 million, which when compared to its market cap, gives us a rather low debt paydown yield of 0.09%. This means that debt reduction isn’t really a priority for the company at the moment. When you roll up all these figures—dividend yield, buyback yield, and debt paydown yield—you get a total shareholder yield of 2.96%.
Key Takeaways
The reasonable net payout yield and buyback yield suggest that sticking with this stock could be a good move, although the low debt paydown yield adds a note of caution to that optimism. Looking forward, if the company stays the course, dividend yields next year might sit around the 1.41% mark and the buyback yield could be close to 1.46%. Going forward, don’t expect dramatic changes in the company’s debt position, unless they decide to shift their current policy.
Owner Earnings
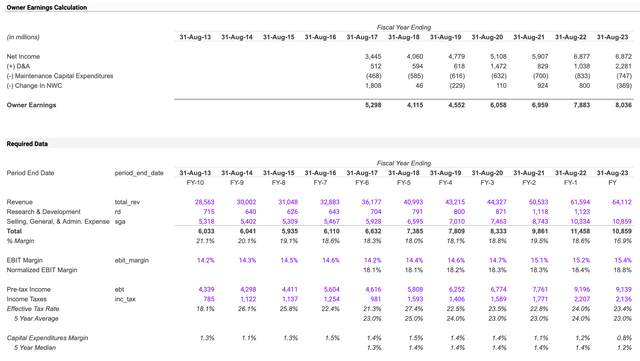
Let’s start with Net Income: it rose significantly from $5,907 million in 2021 to $6,877 million in 2022, showing an impressive 16.43% growth. However, the momentum stalled in 2023, with income practically flatlining at $6,872 million—a mere 0.07% dip from the previous year.
Meanwhile, Depreciation and Amortization expenses skyrocketed over the same timeframe, going from $829 million in 2021 to a whopping $2,281 million in 2023, marking a 175% increase. Maintenance Capital Expenditures—essentially the costs of keeping the business running smoothly—also rose, but more modestly, from $700 million to $747 million, a 6.71% uptick over the three-year period.
The Change in Net Working Capital is a real eyebrow-raiser: it swung from adding $924 million in 2021 to subtracting $369 million in 2023, representing a massive shift in short-term assets and liabilities.
Owner Earnings, which give a more comprehensive view of the company’s profitability, went up from $6,959 million in 2021 to $8,036 million in 2023, a healthy 15.44% boost. If we zero in on just the last year, the growth rate for Owner Earnings was 1.94%. Based on this, an educated forecast for next year’s Owner Earnings would place them at around $8,188 million, assuming a similar growth rate.
Red Flags: The stagnant Net Income is a red flag, signaling potential challenges for future profitability. All in all, the picture is mixed, and any investment decision should weigh both the growth in Owner Earnings and the risks tied to flat Net Income and increased expenses.
Valuation of Accenture
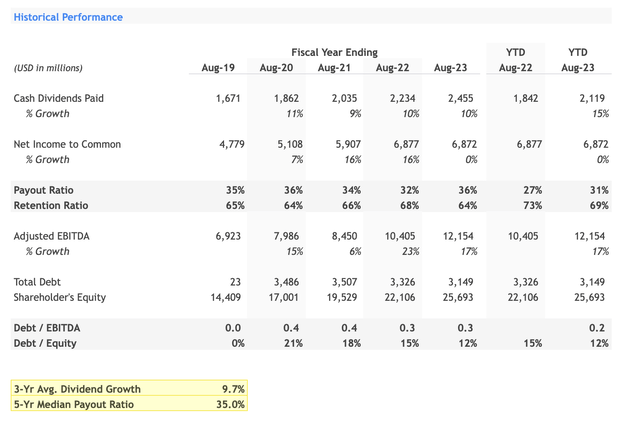
I value Accenture using the Dividend Discounted multi-stage model as my valuation tool. Let’s start by looking at the dividends the company has paid out over the last five years. The growth rate has hovered around 10%, but it recently sped up, with a year-to-date increase of 15%. That’s promising.
Net Income to Common has also risen in the last five years, going from $4,779 million in 2019 to $6,872 million in 2023. However, there’s a caveat: the income growth stalled, hitting a 0% growth rate from 2022 to 2023.
The payout ratio dipped from 35% to 32%, then climbed back up to 36%. On the brighter side, Adjusted EBITDA has been on an uptrend, boasting a 23% jump from 2021 to 2022 and another 17% rise from 2022 to 2023.
Total Debt decreased as well, falling from $3,507 million in 2021 to $3,149 million in 2023, which is a welcome development.
Shareholders’ Equity has seen a steady climb, moving up from $14,409 million to $25,693 million.
The Debt/EBITDA ratio has been holding steady between 0.3 and 0.4, while the Debt/Equity ratio has positively dropped from 21% to 12% over the years. All in all, these numbers paint a mostly optimistic picture but do raise some flags, especially regarding the stalled net income.
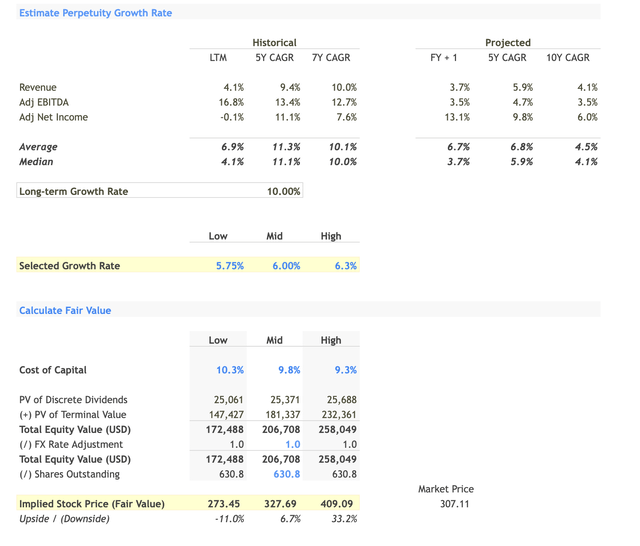
After reviewing historical data, I’ve mapped out what we might expect from dividend payments for the next five years. First off, let’s talk about Net Income to Common. The growth rate has some serious ups and downs, sinking to -0.1% in 2023 before soaring to a robust 13.1% in 2024. From there, it finds a stable growth, around 8-10% until 2027. Now, regarding the Payout Ratio, it begins at 35.7% in 2023 and increases to 92.5% by the terminal year, suggesting that as the returns converge towards the cost of capital, the company’s payout ratio increases as there are fewer growth opportunities that generate excess returns.
As for the Projected Dividends, they kick off at $2,455 million in 2023 and then leap to a whopping $10,133 million by the time we hit the terminal year. Diving into ratios, I’ve calculated the Dividend Growth Rate using the formula (New Dividend – Old Dividend) / Old Dividend.
The rate varies between 22.3% and 48.8%, and I’m anticipating that as the company’s growth opportunities wane, they’ll start shelling out more to shareholders, hence the higher payout ratio.
Finally, let’s identify some value drivers. The Net Income Growth rate oscillates between 8% and 13%, making it a strong contender for driving value in the long term, according to my model. All these factors combined paint an intriguing, albeit complex, picture of what dividend investors might anticipate in the coming years.
Looking at the financial landscape, there’s a bunch of noteworthy data to consider. Starting with Revenue Growth, the historical seven-year compound annual growth rate (7Y CAGR) fluctuated between 4.1% and 10.0%, and it’s slated to continue at a projected five-year CAGR of about 5.9%. When it comes to Adjusted EBITDA Growth, it was historically strong, boasting a last twelve months rate of 16.8%. However, the projection for the next five years dips to a more conservative 4.7%.
Now, as for Adjusted Net Income, it’s currently in the negative territory at -0.1%, but it’s projected to grow to a respectable 13.1% next year. Switching gears to the Cost of Capital, it ranges between 10.3% and 9.3%. In terms of the Implied Stock Price, the estimates hover between $273.45 and $409.09.
When you consider the 5Y CAGR to Cost of Capital, especially for Revenue at 5.9% and Adjusted EBITDA at 4.7%, both roughly divided by 10%, it suggests that the company’s growth isn’t diverging much from its cost of capital. In simpler terms, the returns the company is generating are getting closer to the cost of getting that capital in the first place.
Investment Recommendations:
Implied Stock Price / Market Price: A downside of -11.0% at the low end and an upside of 33.2% at the high end indicates a possible “Hold” situation depending on risk tolerance.
The company has robust client relations and has been consistent in paying dividends. However, potential investors should weigh these positive indicators against the evident risks and red flags, especially the declining operating margin, low net bookings and slowing revenue growth.
A ‘Hold’ recommendation seems appropriate until the company addresses the operational inefficiencies and sector-specific declines that have marred its recent financial performance. The company is financially strong with good cash flow and is rewarding shareholders through dividends and share repurchases. However, projected revenue growth is modest, and there’s a significant focus on share repurchases over investment in growth.
Analyst’s Disclosure: I/we have no stock, option or similar derivative position in any of the companies mentioned, and no plans to initiate any such positions within the next 72 hours. I wrote this article myself, and it expresses my own opinions. I am not receiving compensation for it (other than from Seeking Alpha). I have no business relationship with any company whose stock is mentioned in this article.
Seeking Alpha’s Disclosure: Past performance is no guarantee of future results. No recommendation or advice is being given as to whether any investment is suitable for a particular investor. Any views or opinions expressed above may not reflect those of Seeking Alpha as a whole. Seeking Alpha is not a licensed securities dealer, broker or US investment adviser or investment bank. Our analysts are third party authors that include both professional investors and individual investors who may not be licensed or certified by any institute or regulatory body.

