Summary:
- AT&T is presenting an attractive investment opportunity amidst mixed reactions to its recent earnings report.
- The yearly candlestick patterns for the years 2020 through 2023 indicate a healthy price correction, suggesting a potential upswing once a solid bottom is established.
- The stock price is currently at a critical support point, as evidenced by the ascending broadening wedge, channel support, and Fibonacci support levels.
Justin Sullivan/Getty Images News
AT&T Inc. (NYSE:T), a titan in the telecommunications industry, is showcasing a captivating investment opportunity. Despite modest revenue growth, AT&T has demonstrated significant progress in its mobility and broadband services. This suggests that the company’s strategic emphasis on these sectors is yielding positive results. Furthermore, AT&T’s cash flow metrics reflect a robust performance, with notable increases in free cash flow. This article delivers a technical examination of AT&T’s stock price to forecast its future trajectory and identify potential investment opportunities. Current observations reveal that the stock price is trading at a significant support level, offering a perfect buying opportunity.
A Closer Look at AT&T’s Performance
AT&T has demonstrated its potential to be a strong investment opportunity in the current market climate. Despite the mixed reactions to the company’s recent Q2 2023 earnings report, several aspects of AT&T’s financial performance suggest that the telecom giant may provide a compelling buying opportunity for investors.
The slight 1% growth in revenue reported by AT&T may not seem substantial on the surface, but the details reveal more about the company’s potential. The broadband revenue surged by 7% due to fiber growth of 28%. Moreover, there was a significant surge in the number of mobile and fiber subscribers. These figures indicate that the company’s strategic focus on mobile and fiber services is beginning to pay off. Furthermore, AT&T’s cash-flow metrics showed a strong performance in Q2 2023, with a free cash flow of $4.2 billion which is improved by 30%. This significant surge in free cash flow suggests that AT&T is generating cash at a much faster pace than before, increasing its ability to finance its business operations, pay off debt, reward shareholders, and make future strategic investments.
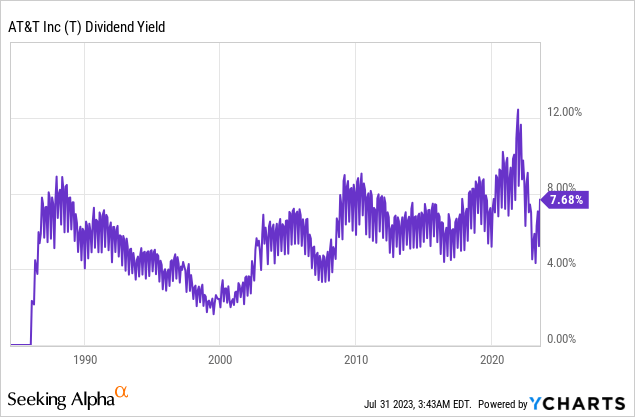
Investors are also attracted to AT&T’s impressive 7.68% dividend yield. A high dividend yield is an indicator of a stock’s investment potential, as it means the company is returning a significant amount of its profits to its shareholders. Importantly, AT&T’s management has stated that they expect to increase cash generation over time while continuing to pay out its dividend.
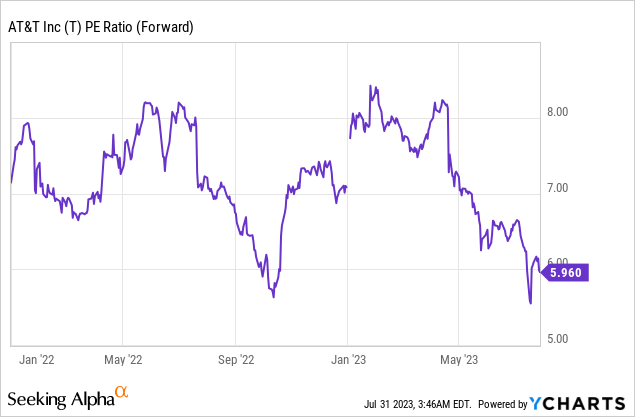
AT&T’s valuation also presents a compelling argument for investment. Currently trading at just six times forward earnings, AT&T’s stock appears undervalued, particularly in light of its strong cash flows and dividend yield. Furthermore, AT&T’s focus on cost-cutting initiatives and debt reduction suggests a prudent financial management strategy, which is encouraging for potential investors.
The broader outlook for AT&T appears optimistic. Although the company’s shares have been lagging, its latest financial results along with effective fiscal management tactics and encouraging growth in strategic sectors hint at a potential recovery. AT&T’s strong points, including its expansion in mobile and broadband services, substantial cash flows, and an impressive dividend yield, seem to counterbalance its present hurdles, rendering it an attractive proposition for value-oriented investors.
AT&T’s Long-Term Investment Prospects
AT&T’s long-term investment outlook appears highly favorable, as illustrated by the yearly chart below. The stock price bottomed out in 2002 at $4.88, followed by a significant upswing to all-time highs. The inside bars for 2003 and 2004 underscore the robustness of this bottom formation, suggesting a long-term market rally. Although the stock price has seen a two-decade rise since this bottom, the price structure suggests this trend is set to persist. Notably, the current price support at $13.43 is strong, as indicated by the red long-term support line. The yearly candles for 2020 through 2023 signify a healthy correction phase after a strong rally. Therefore, price consolidation around the $13 region supports the likelihood of a strong bottom in AT&T.
AT&T Yearly Chart (StockCharts.com)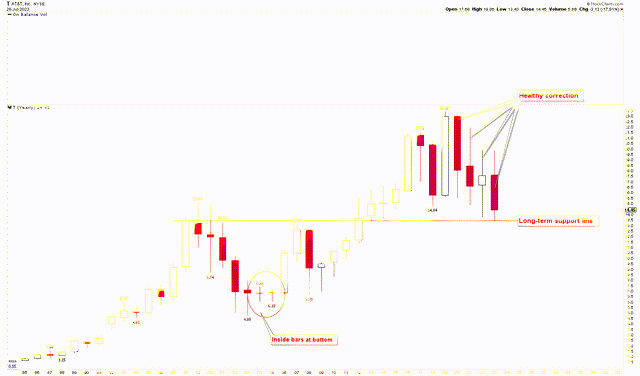
The bullish pattern in AT&T is also evident in the quarterly chart below, which indicates the stock price is currently forming a solid base at the blue channel’s support junction. This point at $13.43 is reinforced by the intersection of the blue and red support lines. The same red line from the yearly chart now indicates a double bottom pattern on the quarterly chart at $5.02 and $6.70. This pattern increases the probability of the price bottoming out in the current region.
AT&T Quarterly Chart (StockCharts.com)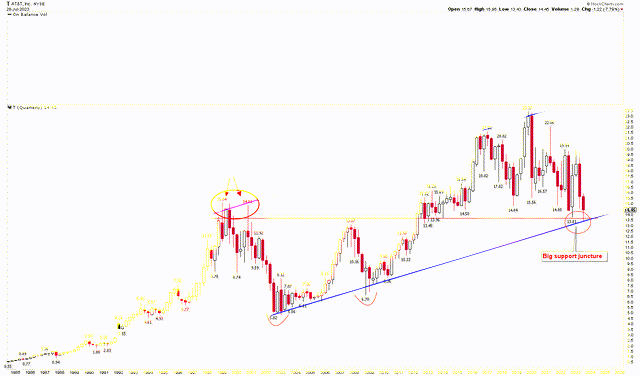
Crucial Investment Considerations and Actions
To gain deeper insight into AT&T’s bullish market conditions discussed above, the monthly chart below elucidates the market’s significant support. The chart displays the development of an ascending broadening wedge pattern starting from $4.88 to $23.37. The stock price has been trading within this wedge for a significant time. After reaching the wedge’s resistance at $21.56, the price demonstrated high volatility, potentially due to strong bullish forces countered by technical resistance. After hitting all-time highs at $23.37, the stock price underwent a correction, intriguingly coinciding with the ascending broadening wedge’s support at $13.43.
A&T Monthly Chart (StockCharts.com)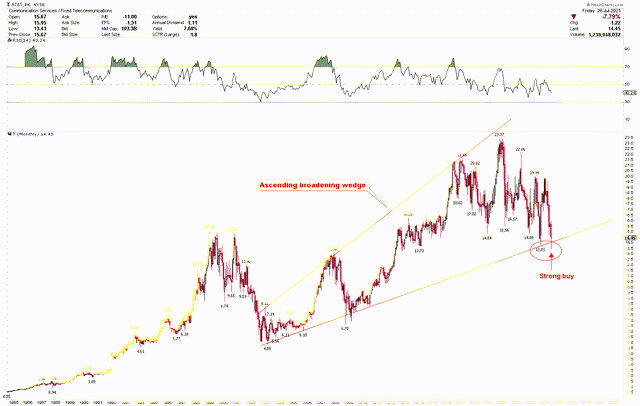
The chart below further underlines the significance of current levels, featuring the 233 simple moving averages. As shown, AT&T’s stock price has supported this moving average in 2003, 2004, 2005, 2006, and 2009, triggering robust market rallies each time. Recently, the AT&T market touched this moving average again in 2022 at $13.81, prompting a sharp market rebound to $19.86 within a few weeks. As the stock price touches this moving average again at $13.43, a strong market rally is expected.
AT&T Monthly Chart (StockCharts.com)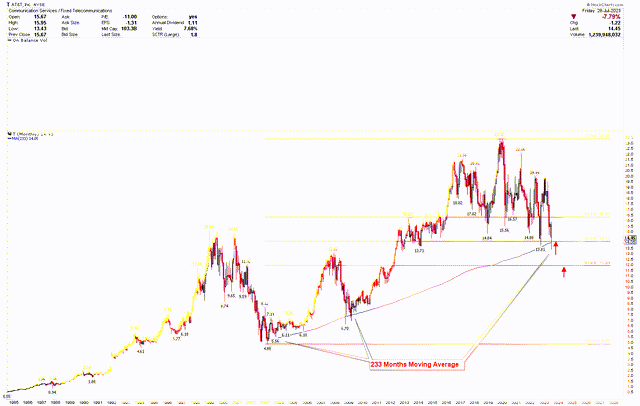
The same chart also presents the Fibonacci retracement level from the bottom of $4.88 to the high of $23.37. The current support lies at the 50% Fibonacci retracement level of $14.12. A further downward push to the 61.8% level at $11.94 could present the last support level, possibly plunging the market into an extremely oversold region. However, based on the discussion above, the market is likely to bottom at current levels. Thus, investors may contemplate buying AT&T shares at the current price, anticipating a potent rally in the coming months. In the event of a further market downturn, investors can expand their positions at $11.94, with an outlook for a future market upswing.
Market Risks
The telecommunications industry is highly competitive and is marked by rapid technological changes. The company’s performance could be affected if it fails to compete effectively against other industry players in terms of pricing, technology, or services offered. Moreover, the telecommunications industry is heavily regulated. Changes in laws and regulations could potentially hurt AT&T’s operations and financial condition. Additionally, AT&T’s ability to expand its network and offer new services may be limited by the availability of radio spectrum and government approval processes, which can be unpredictable and time-consuming.
AT&T is facing declining revenues from its business wireline services, partly due to the shift towards cloud-based communication options. If the company fails to adapt to changes in technology and customer preferences, it could lose customers and market share, which would negatively impact its financial performance. Additionally, AT&T handles a large amount of personal and sensitive data. Any breach of its network security could lead to loss of data, damage to its reputation, and potential liability, all of which could harm the company’s financial condition and operating results. The company’s use of lead-sheathed copper cables could raise environmental and safety concerns. Any related litigation or regulatory action could lead to significant costs for the company. From a technical standpoint, should the monthly closing price of the stock persistently fall below the $11.94 mark, it would fracture the existing bullish pattern. This could potentially foreshadow a continued downtrend in the market.
Final Thoughts
In conclusion, AT&T presents an interesting investment opportunity in the telecommunications sector. Despite the challenges and risks associated with environmental concerns, diminishing revenues from its business wireline services, and intense competition in the industry, I think AT&T has shown its ability to thrive amidst adversity. Its strategic emphasis on mobility and broadband services has resulted in robust financial performance, including impressive cash flow growth and a generous dividend yield.
The technical analysis for AT&T indicates that its current stock price is trading at a major support level, implying significant buying prospects for long-term investors. This support level is evident from the long-term support visible on the yearly chart, channel support on the quarterly chart, 233 simple moving average, 50% Fibonacci retracement, and strong support from the ascending broadening wedge. This substantial convergence of support factors makes this support level particularly intriguing and suggests a high potential for buying. Investors can consider buying at the current market rates and consider increasing holdings if the price dips further to $11.94.
Analyst’s Disclosure: I/we have no stock, option or similar derivative position in any of the companies mentioned, and no plans to initiate any such positions within the next 72 hours. I wrote this article myself, and it expresses my own opinions. I am not receiving compensation for it (other than from Seeking Alpha). I have no business relationship with any company whose stock is mentioned in this article.
Seeking Alpha’s Disclosure: Past performance is no guarantee of future results. No recommendation or advice is being given as to whether any investment is suitable for a particular investor. Any views or opinions expressed above may not reflect those of Seeking Alpha as a whole. Seeking Alpha is not a licensed securities dealer, broker or US investment adviser or investment bank. Our analysts are third party authors that include both professional investors and individual investors who may not be licensed or certified by any institute or regulatory body.
