Summary:
- AT&T’s stock has declined by over 20% since mid-April, reducing its PE ratio and increasing its dividend yield.
- The company faces challenges in paying its massive debt and maintaining its dividend payout due to competitive pressures and capital investments.
- Despite a high dividend yield, AT&T is not an ideal value play due to the massive challenges it faces in debt reduction, stabilizing free cash flow, and improving network coverage.
- Any dip in the expected FCF will hurt the dividend payout ratio and could lead to another cut in the dividend, which is now giving a 7.2% dividend yield.
Brandon Bell
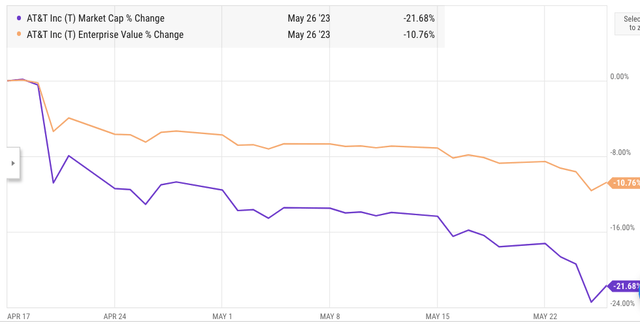
AT&T (NYSE:T) stock has declined by over 20% since mid-April. This has reduced PE ratio to less than 7 and increased the dividend yield from 5.5% to 7.2%. In a previous article in March 2022, it was mentioned that higher dividend yield will not prevent AT&T stock from underperforming. Investors looking to make a value play at the current price should also look at the broader challenges faced by the company. The 20% dip in stock price led to a 10.5% percent decline in AT&T’s enterprise value, which includes its massive debt.
Any negative impact on free cash flow can create new challenges to pay this massive debt. This will also make it difficult for the company to reach the management target of 2.5x ratio for net debt to adjusted EBITDA by 2025. The company still needs to make massive capital investments to plug any gaps in network quality. These factors reduce the security for dividend paid, which is one of the key reasons supporting the current price level of the stock. AT&T remains a value trap under these circumstances and is unlikely to beat the market returns in the near or medium term.
Impact of price correction
AT&T stock price has declined by over 20% since mid-April. This correction might look overdone but the enterprise value of the stock has dipped by a mere 10%. The massive debt taken by AT&T has led to bigger swings in the stock as the market cap declines. The enterprise value is $254 billion while the market cap of the stock is $110 billion. At the current price, every 1% decline in enterprise value will cause 2.3% dip in AT&T’s market cap. Hence, any doubt over the ability of the company to pay its long-term debt will have a much bigger impact on the stock price.
Figure 1: Impact of recent correction on market cap and enterprise value of AT&T.
This trend will only increase if there is a further decline in the stock price. Another correction in stock price by 20% can cause the enterprise value to be 2.6 times the market cap. This makes the stock more volatile instead of a stable dividend-yielding value stock.
No guarantee of future free cash flow
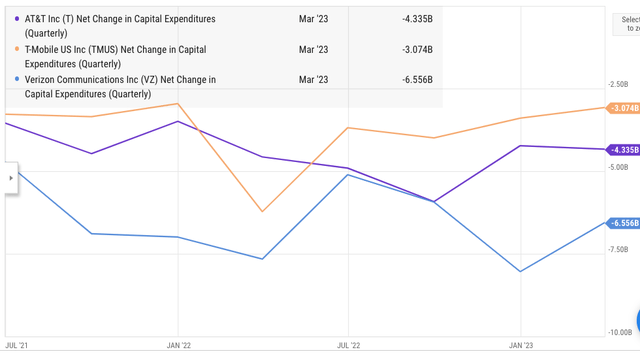
AT&T’s management has been adamant that they will hit the $16 billion mark in FCF in 2023 despite a slow first quarter. However, even in the longer term, AT&T is facing significant competitive pressure which will force the company to continue to have massive capital investment. The net result of this is that we could see the free cash flow come under intense pressure. The management has the option to rein in these capital investments but it could then end up hurting the network quality compared to the competition.
Figure 2: Quarterly capex expense among the big three telecom companies.
Revenue growth and margin expansion are very low for AT&T which reduces the ability to increase FCF. AT&T’s management was quite sure when they announced that they will meet their $16 billion FCF target. It is certainly possible that the management can get close to this target if the next few quarters don’t give a negative surprise. But the long-term ability of AT&T to maintain a solid FCF is less likely as the pressure to improve the network coverage increases in the 5G era. This will have a direct impact on the long-term viability of its dividend which is now yielding close to 7.2%.
Dividends look shaky
During the spinoff of AT&T and WBD (WBD), investors saw a dividend cut while getting additional shares of WBD. However, this arrangement has not given good returns for investors. WBD stock has dipped by over 50% since the spinoff, while AT&T stock has adjusted to a price level where yield is over 7%. The company is now spending close to $8 billion on dividends annually, while FCF is targeted at $16 billion. This leaves little room for the management to make additional capital investments. It is also doubtful if the company will reach its target of net debt to EBITDA of 2.5x by 2025.
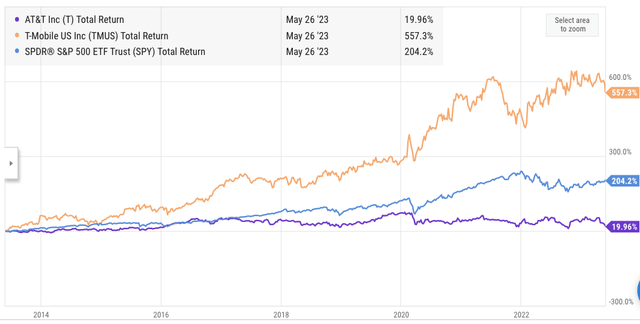
Figure 3: Total return comparison of AT&T and T-Mobile with SPY.
Over the last ten years, AT&T has massively underperformed the broader market despite spending over $120 billion on dividends. The market cap of AT&T is currently at $110 billion which is lower than the total dividends paid in the last ten years. On the other hand, T-Mobile (TMUS) does not give any dividends but has managed to outperform the broader SPY index in terms of total returns.
The new 5G and connected devices era is likely to be more uncertain compared to the last decade. It is not guaranteed that AT&T would be able to maintain dividends at the current level as future capex needs increase. Investors looking for a steady dividend stock might find the potential issues surrounding AT&T too much. As mentioned earlier, the difference in market cap and enterprise value will also cause higher volatility in the stock price in the future in my view.
Future direction of AT&T stock
At first look, AT&T stock looks very cheap after the recent correction. The dividend yield is 7.2% while the PE ratio is also quite low. However, the past results should make us cautious about the company’s ability to deliver. The recent spinoff did not deliver good returns for investors while AT&T is still saddled with a massive debt pile. T-Mobile has already overtaken AT&T in several key 5G network metrics. This would have been unthinkable a couple of years ago. There has been massive wealth destruction in the past decade and the total returns on AT&T stock is also quite poor.
The next few years will be the most challenging for the company as it would need to reduce debt and deliver stable FCF while also improving network coverage by making higher capex. A price war might also be around the corner as inflation causes customers to look for better deals. I believe all these factors can cause the stock to severely underperform the broader S&P index.
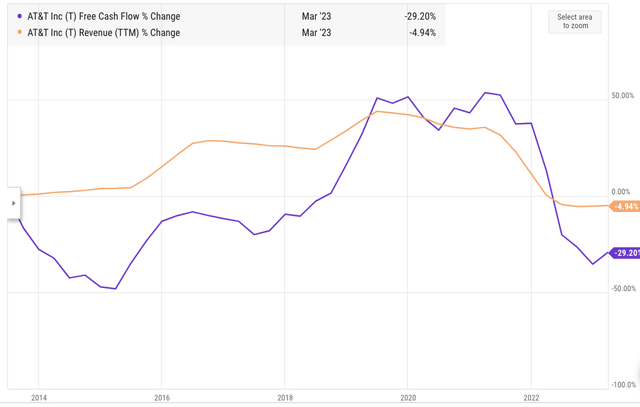
Figure 4: Revenue and FCF movement in the core telecom business in last 10 years.
Over the last ten years, the core telecom business has not seen any revenue growth while the FCF has dipped recently due to higher capex. The forward revenue estimates show that the company might increase revenue by 1% to 2% annually over the next few years. It is unlikely that Wall Street will reward the stock in this scenario while there is also a massive debt pile. Investors looking for a good dividend bet should consider other options.
Investor takeaway
AT&T’s market cap is close to $110 billion while its enterprise value is at $250 billion. Every 1 percent move in the enterprise value leads to 2.3% percent move in the stock price. The recent correction in stock price was much lower when we look at the impact on the overall enterprise value. This trend will likely increase if there is further value erosion in the stock.
AT&T needs to make consistent capex to have a decent network coverage which has a negative impact on FCF and the ability of the company to maintain the current dividend payout. The management would need to deliver on a number of factors like debt reduction, stabilizing FCF, better network coverage, and others. Despite a high dividend yield, the stock is not an ideal value play due to the massive challenges faced by the company.
Analyst’s Disclosure: I/we have no stock, option or similar derivative position in any of the companies mentioned, and no plans to initiate any such positions within the next 72 hours. I wrote this article myself, and it expresses my own opinions. I am not receiving compensation for it (other than from Seeking Alpha). I have no business relationship with any company whose stock is mentioned in this article.
Seeking Alpha’s Disclosure: Past performance is no guarantee of future results. No recommendation or advice is being given as to whether any investment is suitable for a particular investor. Any views or opinions expressed above may not reflect those of Seeking Alpha as a whole. Seeking Alpha is not a licensed securities dealer, broker or US investment adviser or investment bank. Our analysts are third party authors that include both professional investors and individual investors who may not be licensed or certified by any institute or regulatory body.

