
Summary:
- Following the spin-off of Warner Media, AT&T’s total debt was significantly reduced and currently stands at around $143B.
- In a period of rising interest rates and concerns about the sustainability of AT&T’s dividend, the market has punished the stock tremendously.
- An in-depth analysis of AT&T’s debt helps us to truly understand what matters and what level of risk that high level of debt poses.
- Comparing how AT&T’s debt profile has changed from its record debt levels provides us with insight as to how AT&T is managing its debt.
- Is AT&T’s debt level risky? Is the dividend at risk?
Brandon Bell
Over at least the last decade investors in AT&T (NYSE:T) have faced challenges due to secular trends of cord-cutting and the rise of streaming platforms. In response, AT&T embarked on a costly and shareholder wealth-destroying strategy, spending over $100 billion on acquiring DirectTV and Time Warner. Unfortunately, both acquisitions were eventually reversed, leading to further capital destruction. The company’s dividend has been cut in half, and investors received shares in Warner Media (WBD), which have already declined by over 50% from their post-split price.
On top of that, massive investments in 5G and a faster than expected rising interest rate environment, coupled with soaring inflation and reduced consumer spending, have only contributed to an already bad situation.
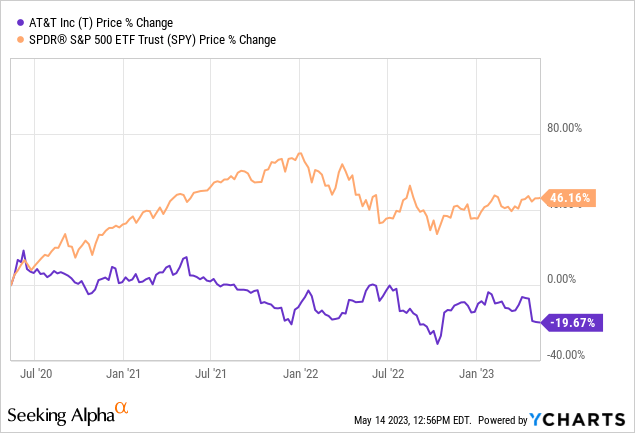
Despite these difficulties, I believe that the market is punishing AT&T too severely, and I have remained invested in the company throughout this journey. Although the stock is down around 20% in the last three years and thus significantly lagging the S&P 500’s 46% price change, it is still a solid long-term investment, and I have confidence in its ability to weather these challenges and eventually thrive.
In hindsight, my decision to remain invested in AT&T may not have been the best one, but I believe that as long as the company remains relevant with its core business model intact, it will eventually thrive. Even if the company’s business was to stagnate for several years, which is not the case, its sheer FCF power and attractive dividend yield should be enough to lift the stock price once the market is confident in its ability to deleverage and manage its balance sheet.
However, I acknowledge that the main driver for AT&T’s disastrous stock performance is investor concerns about its debt profile and FCF power, particularly following the record and exorbitantly expensive 2021 C-band spectrum auction. Therefore, I want to focus on this aspect and conduct a thorough debt assessment of the new AT&T now that the Warner Media/Discovery merger is completed. I have done a similar analysis in the past, but this will be the first time for me to assess the company’s debt following this major merger.
With that said I will concentrate on the following fundamental question on my own: What level of risk does AT&T’s debt load pose amid challenging macro-economic conditions?
Deep dive into AT&T’s debt
AT&T provides a lot of detail on its debt, but in a relatively difficult to use format. The latest data available is for Q4/2022 and this is a good time for such an analysis given a fully completed financial year.
Now having transformed that data, put it into proper structure and excluding data that is simply not usable, allows us to venture into an in-depth analysis of its debt. On top of that, by having done that exercise in the past already, we can also make some insightful comparisons. However, before doing so, we’ll have to make a number of key assumptions:
1) By end of Q4/2022, we’re focusing on $143.3B of total debt.
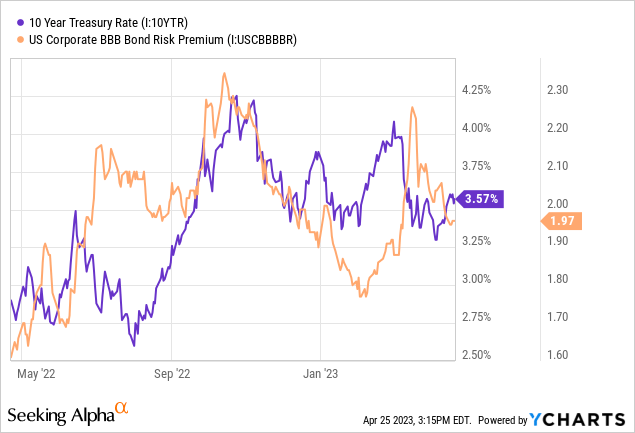
2) Debt issues with floating interest rates are hypothetically assumed to carry a coupon of 6%, which, in light of the current interest rate environment, is a fairly conservative assumption based on a 10-Year Treasury Rate of 3.5% and a BBB bond risk premium of almost 200 bps which is equivalent to AT&T’s long-term issuer rating from S&P.
For AT&T’s fixed rate debt, we can get a first impression of its composition by drawing a tree map where the size of the rectangle indicates the share in total debt by year.
AT&T Fixed Rate Debt Tree Map (Designed by author)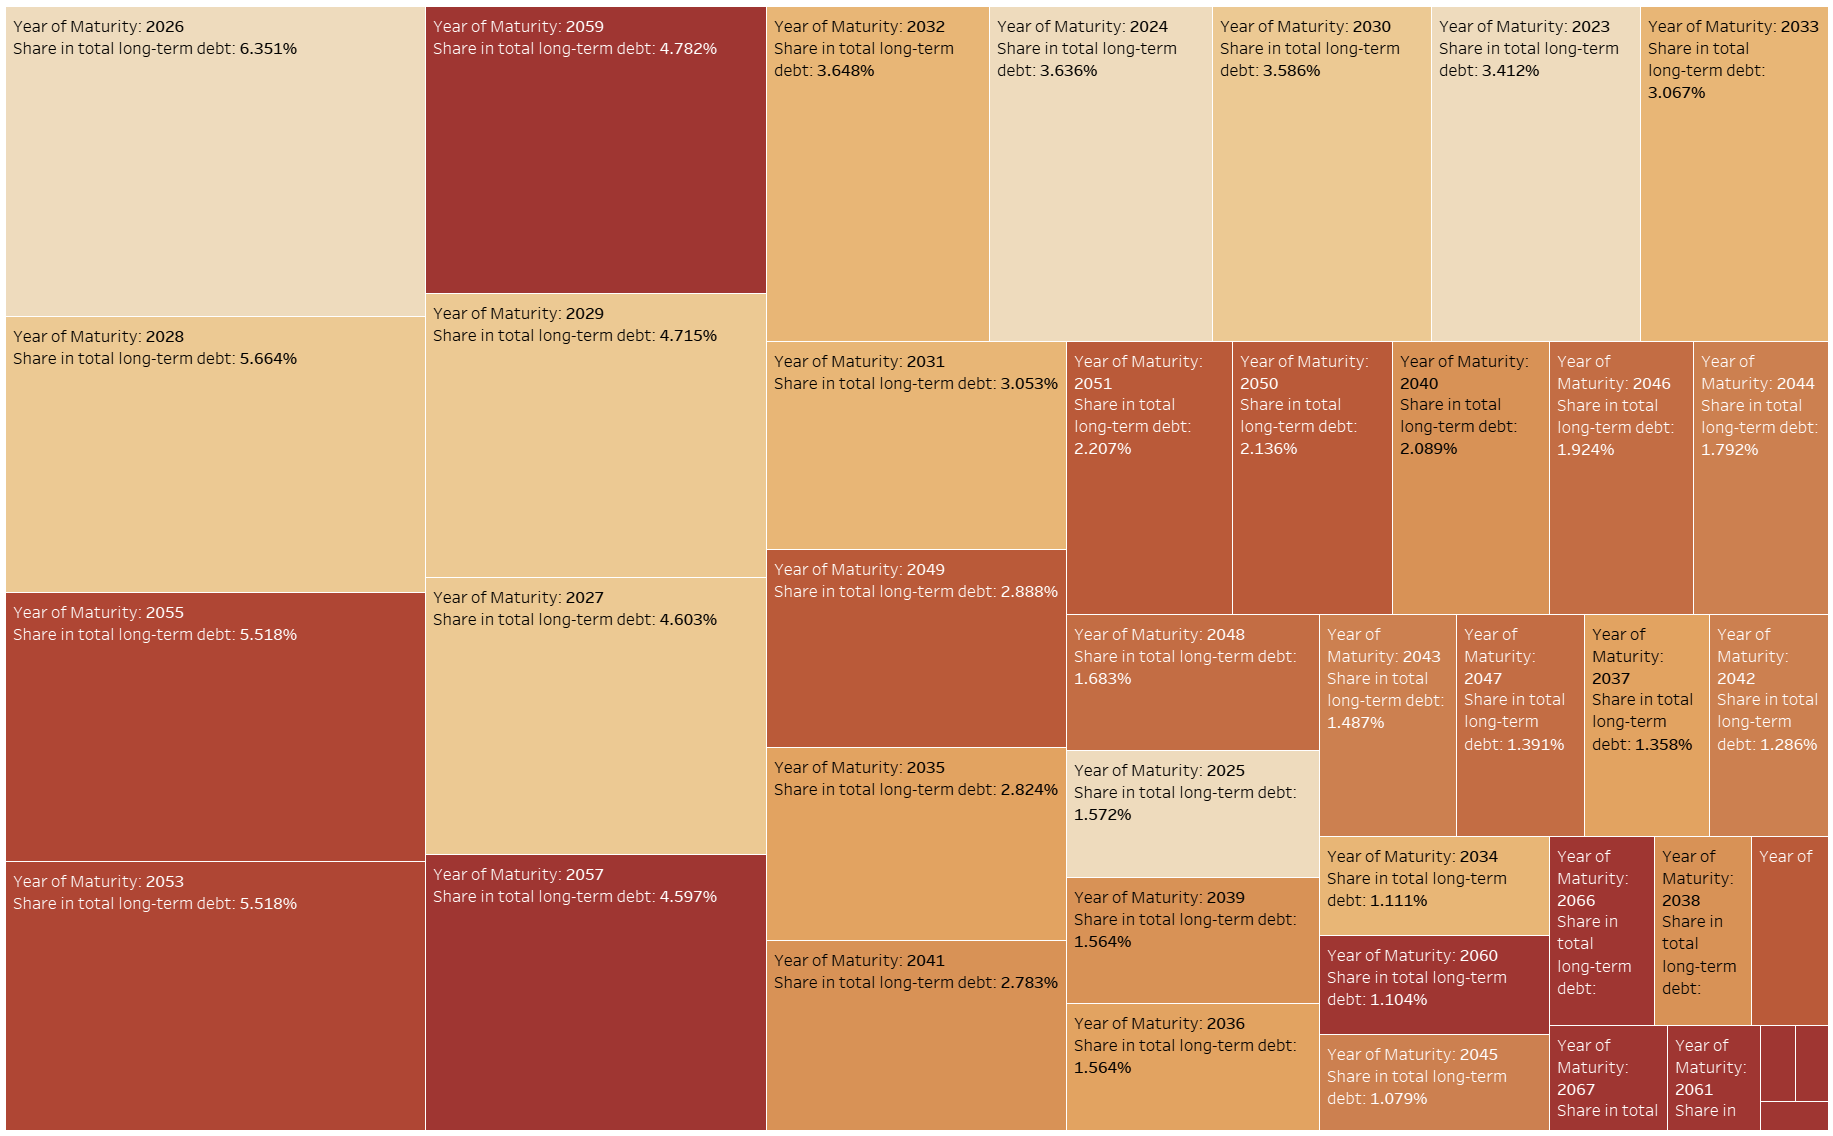
We can easily see that the debt maturities and debt sizes are pretty mixed with four of the ten biggest debt portions due in 2053 and beyond, three within the next 6-10 years, and three due within the next five years.
Plotting that same data using a running total computation, we’ll see that, over the next five years (2023 to 2027), 20% of fixed long-term debt is due.
AT&T Fixed Rate Debt and Weighted Coupon Rate (Designed by author)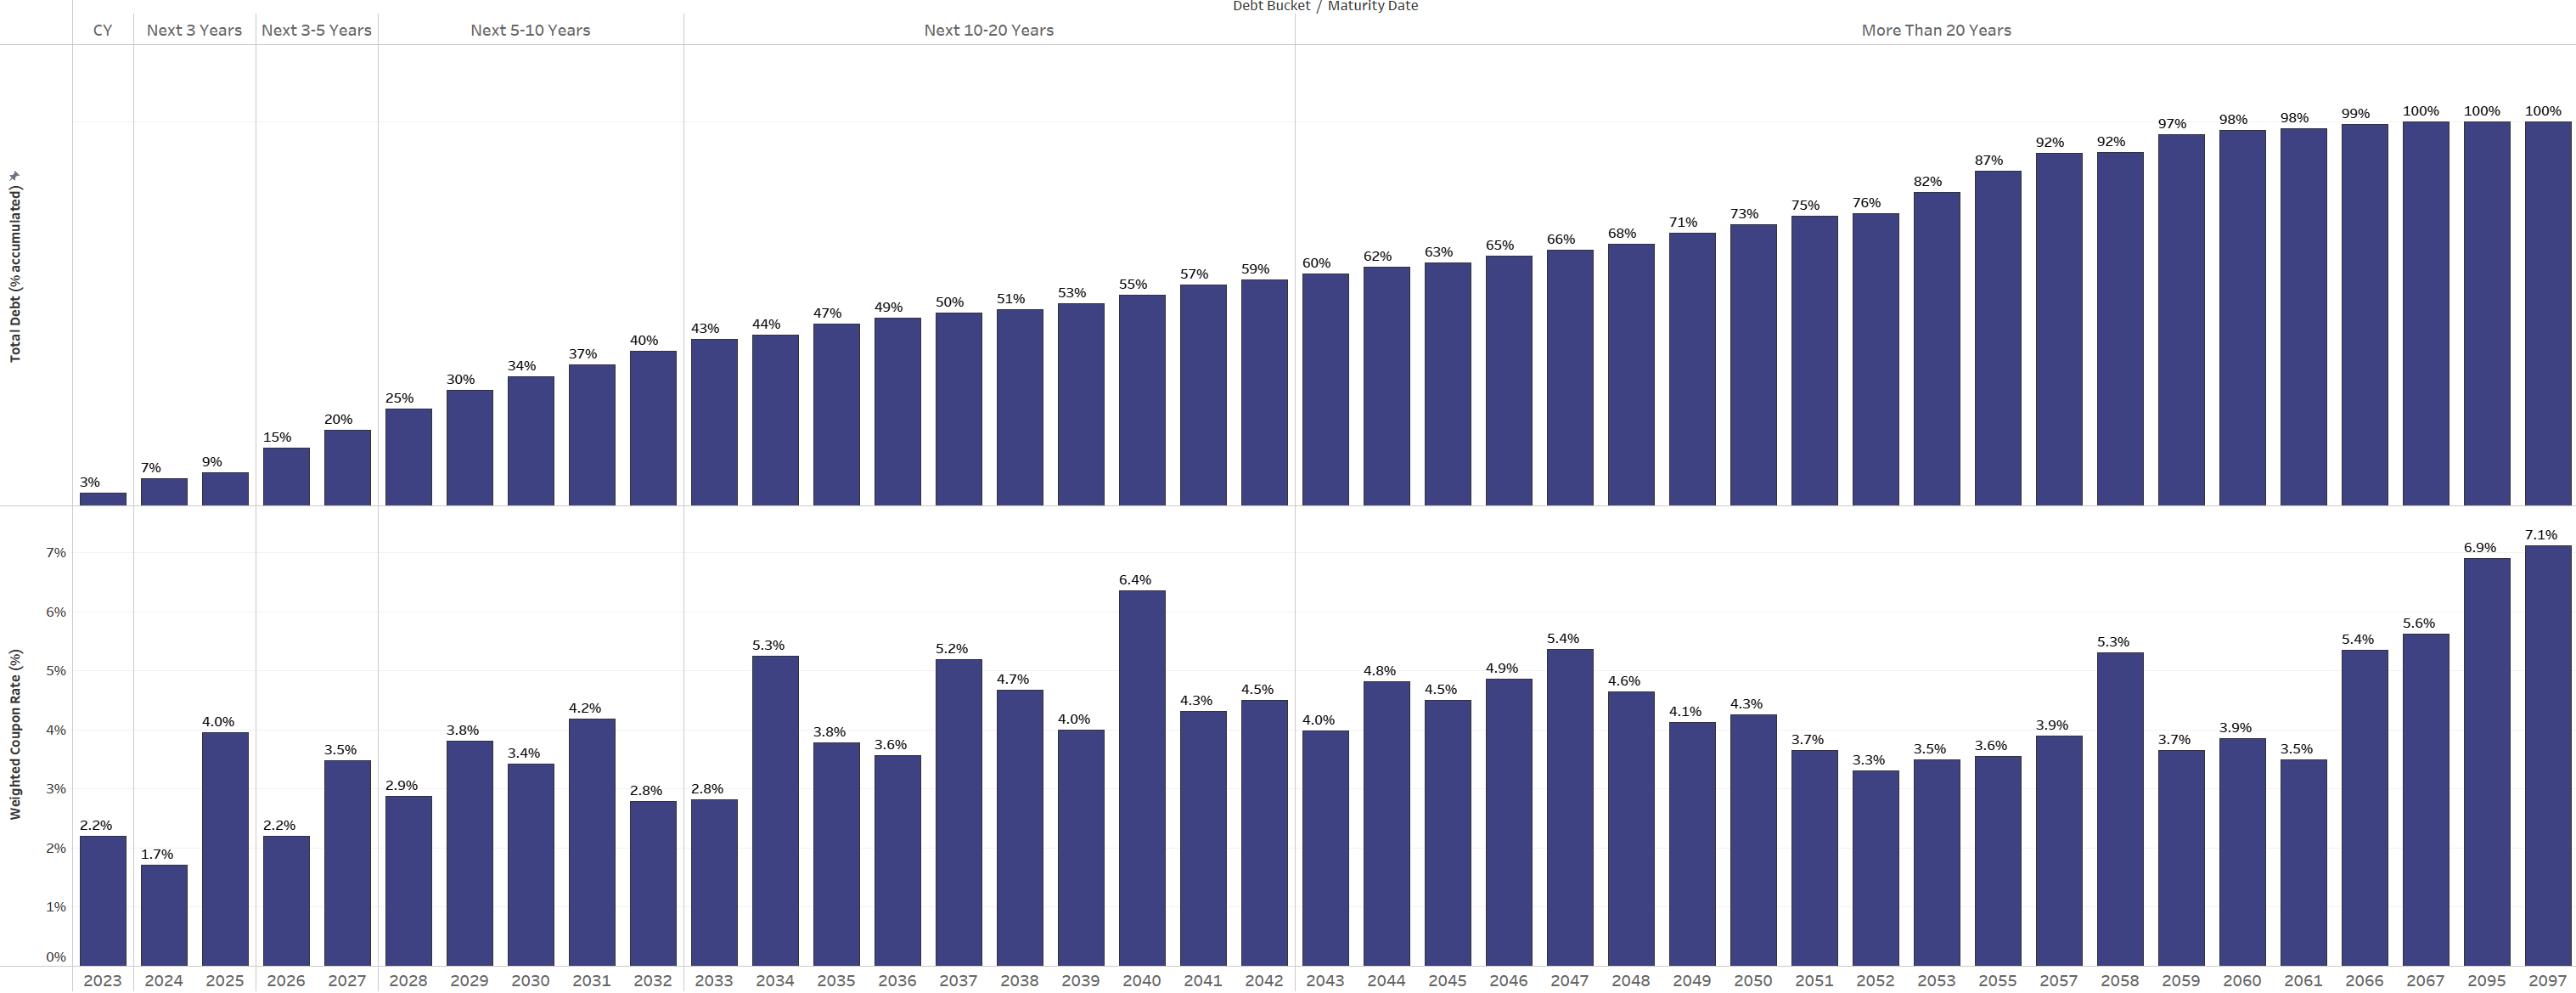
Another 15% is due within 5-10 years, and another 16% is due within 10-20 years. The majority of outstanding fixed-rate long-term debt (40%) is only due after 20 years and stretches over a period from 2043 to 2097. Unsurprisingly, on average, as maturity increases, so does the coupon rate with the years 2095 and 2097 featuring the highest coupon rates. However, there are also several years, e.g. 2051 to 2055, which carry distinctly lower coupon rates than some much earlier maturing debt in 2034 and 2040 This is basically AT&T taking advantage of historically low interest rates and rolling over portions of its debt even if that requires paying some redemption premiums.
AT&T Fixed Rate Debt, Weighted Coupon Rate and Time to Maturity (Designed by author)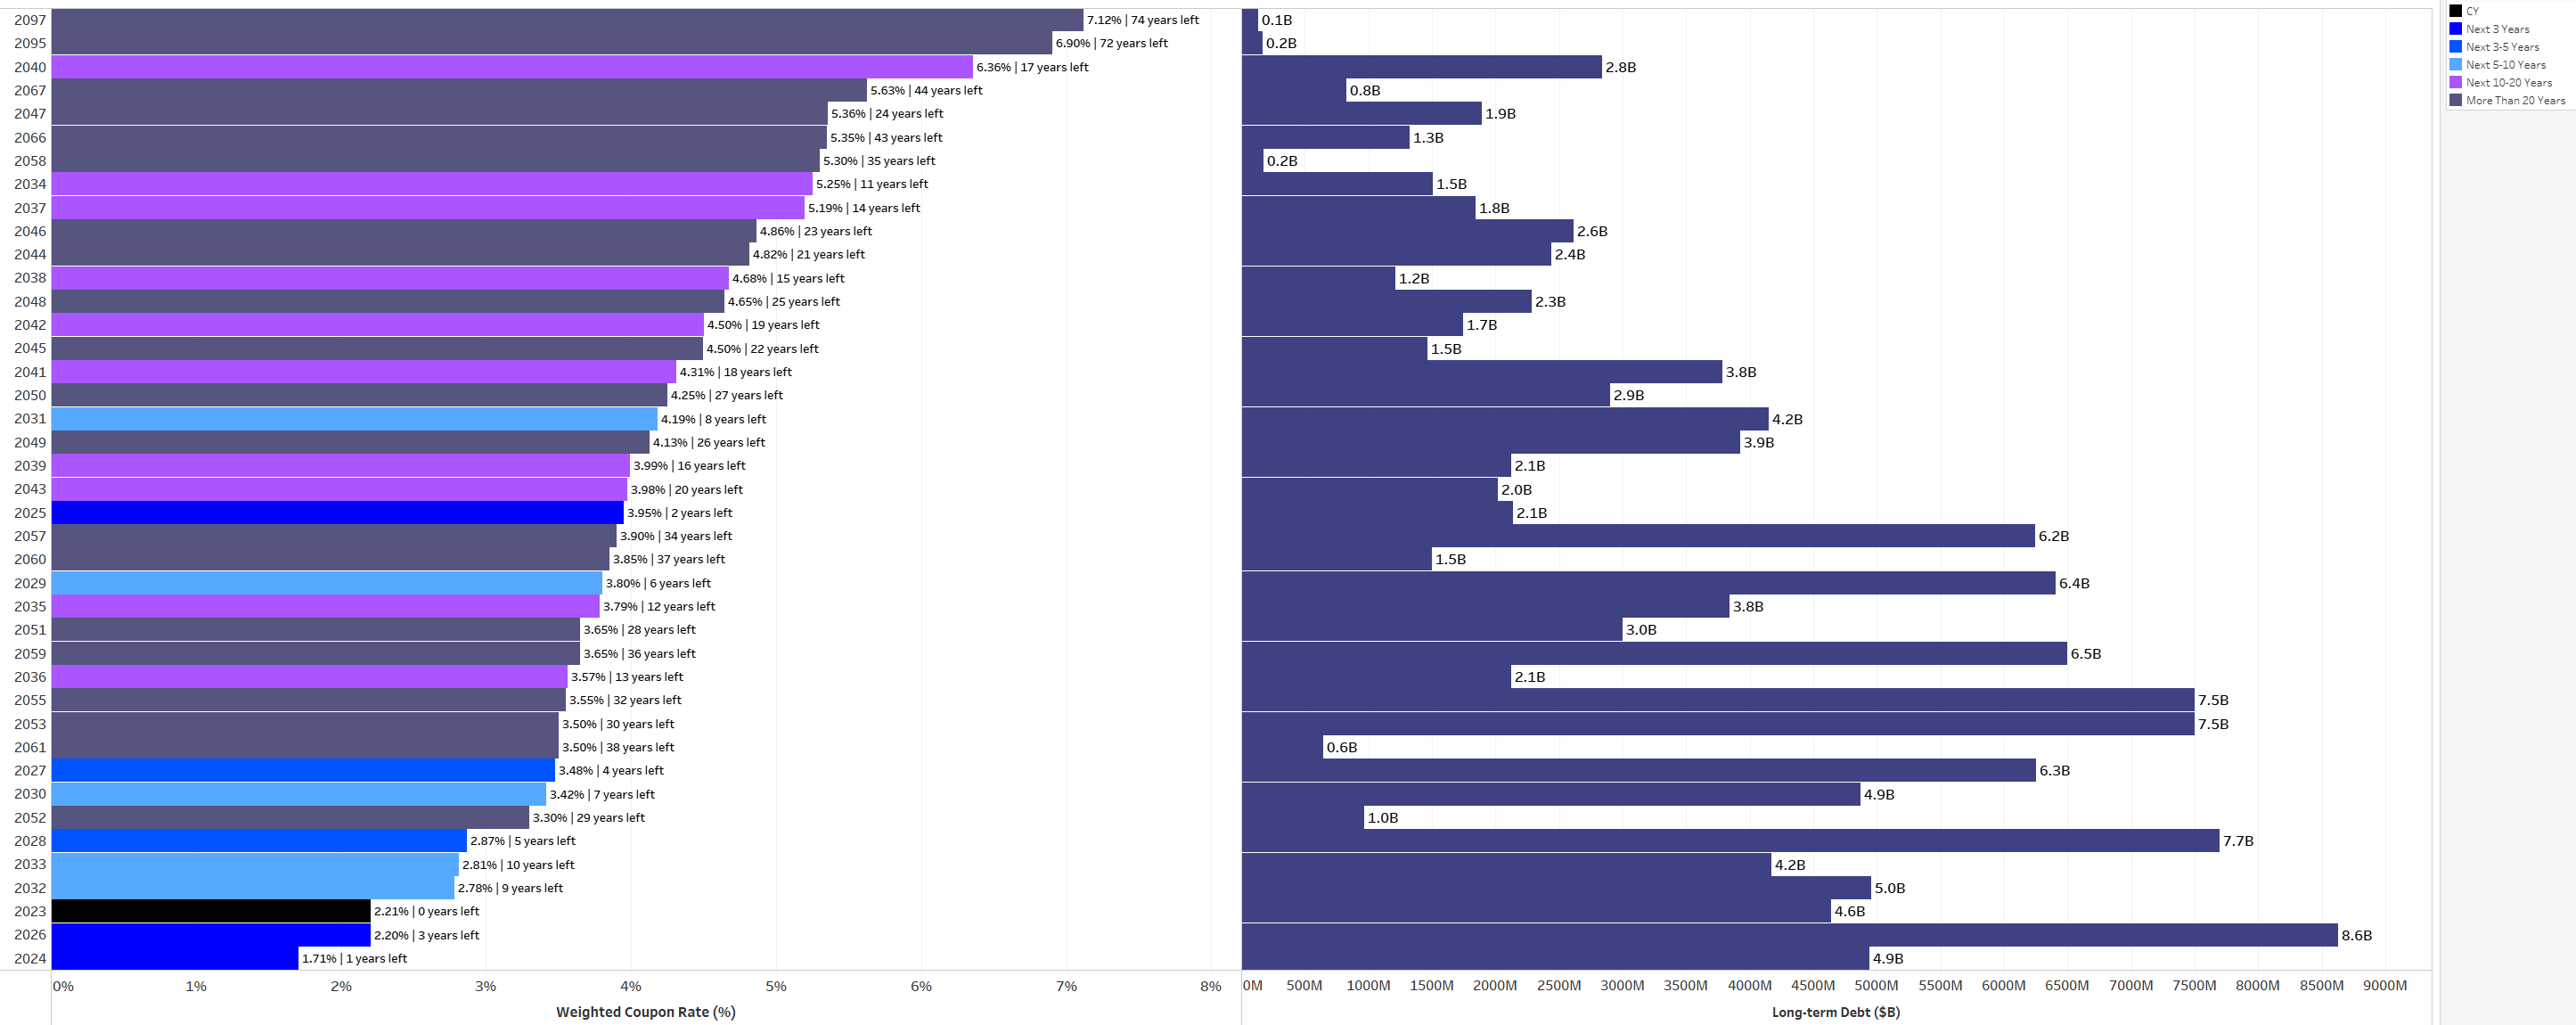
While AT&T’s fixed rate debt will have to be repaid over a very long time period, its remaining floating rate debt matures between 2023 and 2025, commanding a minor share of 5% of overall debt and 38.5% over that time period.
AT&T Fixed and Floating Rate Debt (Designed by author)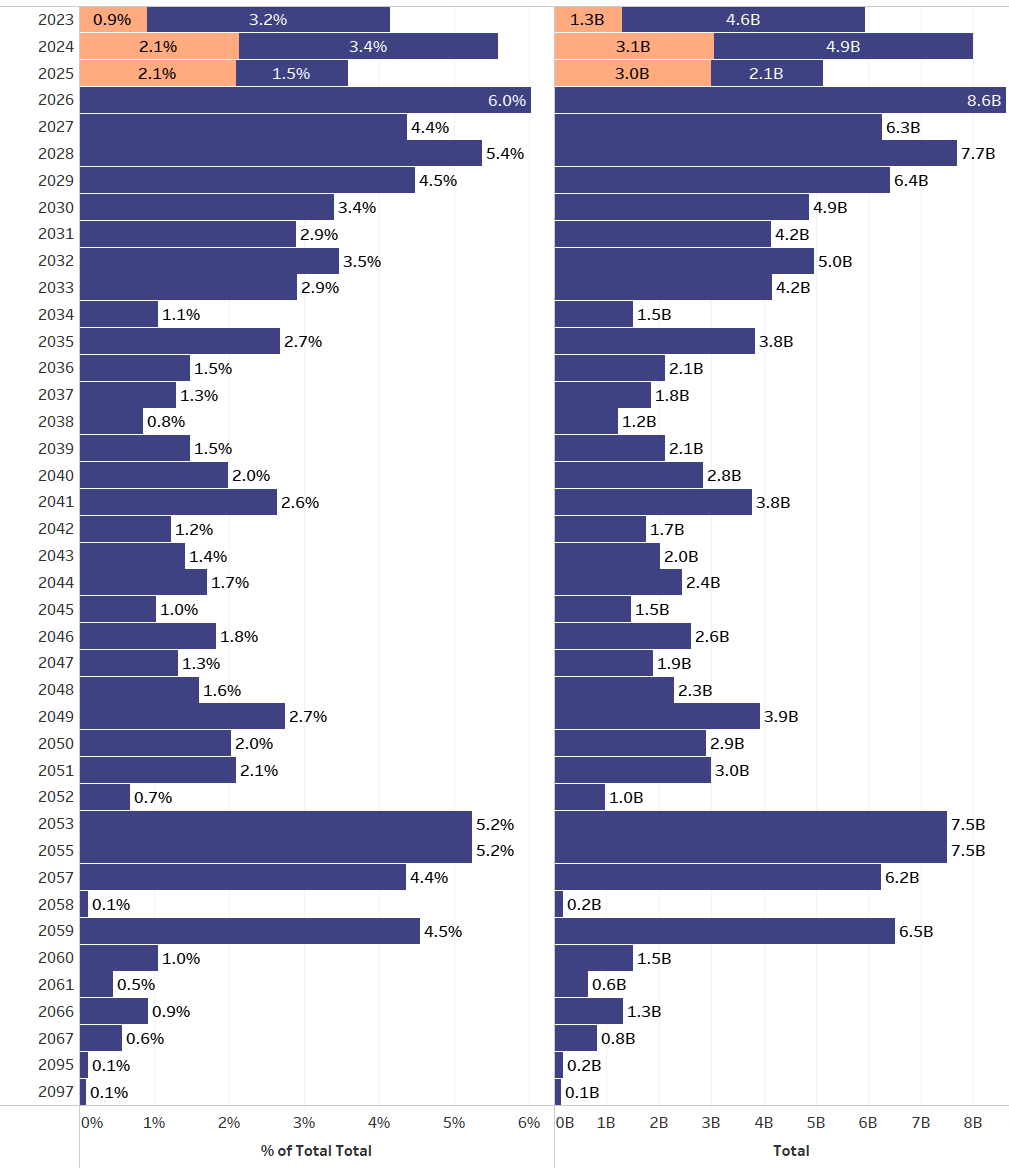
Having explored what AT&T’s current debt schedule looks like, let’s now compare it to previous points of time to better understand how AT&T has been managing its debt as it navigated the aftermath of the pandemic amid an inflationary and high interest rate environment.
Following the spin-off of Warner Media and merger with Discovery, AT&T’s debt schedule reflects these structural changes very clearly. For instance, by the end of Q3/2021 AT&T’s total debt was recorded at $171B and has dropped massively to $143.3B following the merger. Most of the debt that was repaid was initially due over the next five years, i.e. from 2022 to 2026 with further reductions spreading relatively evenly between 2028 to 2042. As a result AT&T was basically able to get itself a lot breathing room over the near-term as total debt over the next five years dropped from $58B to $42B.
AT&T – Change in Debt Schedules Q4/2022 Update vs Q3/2021 Update (Designed by author)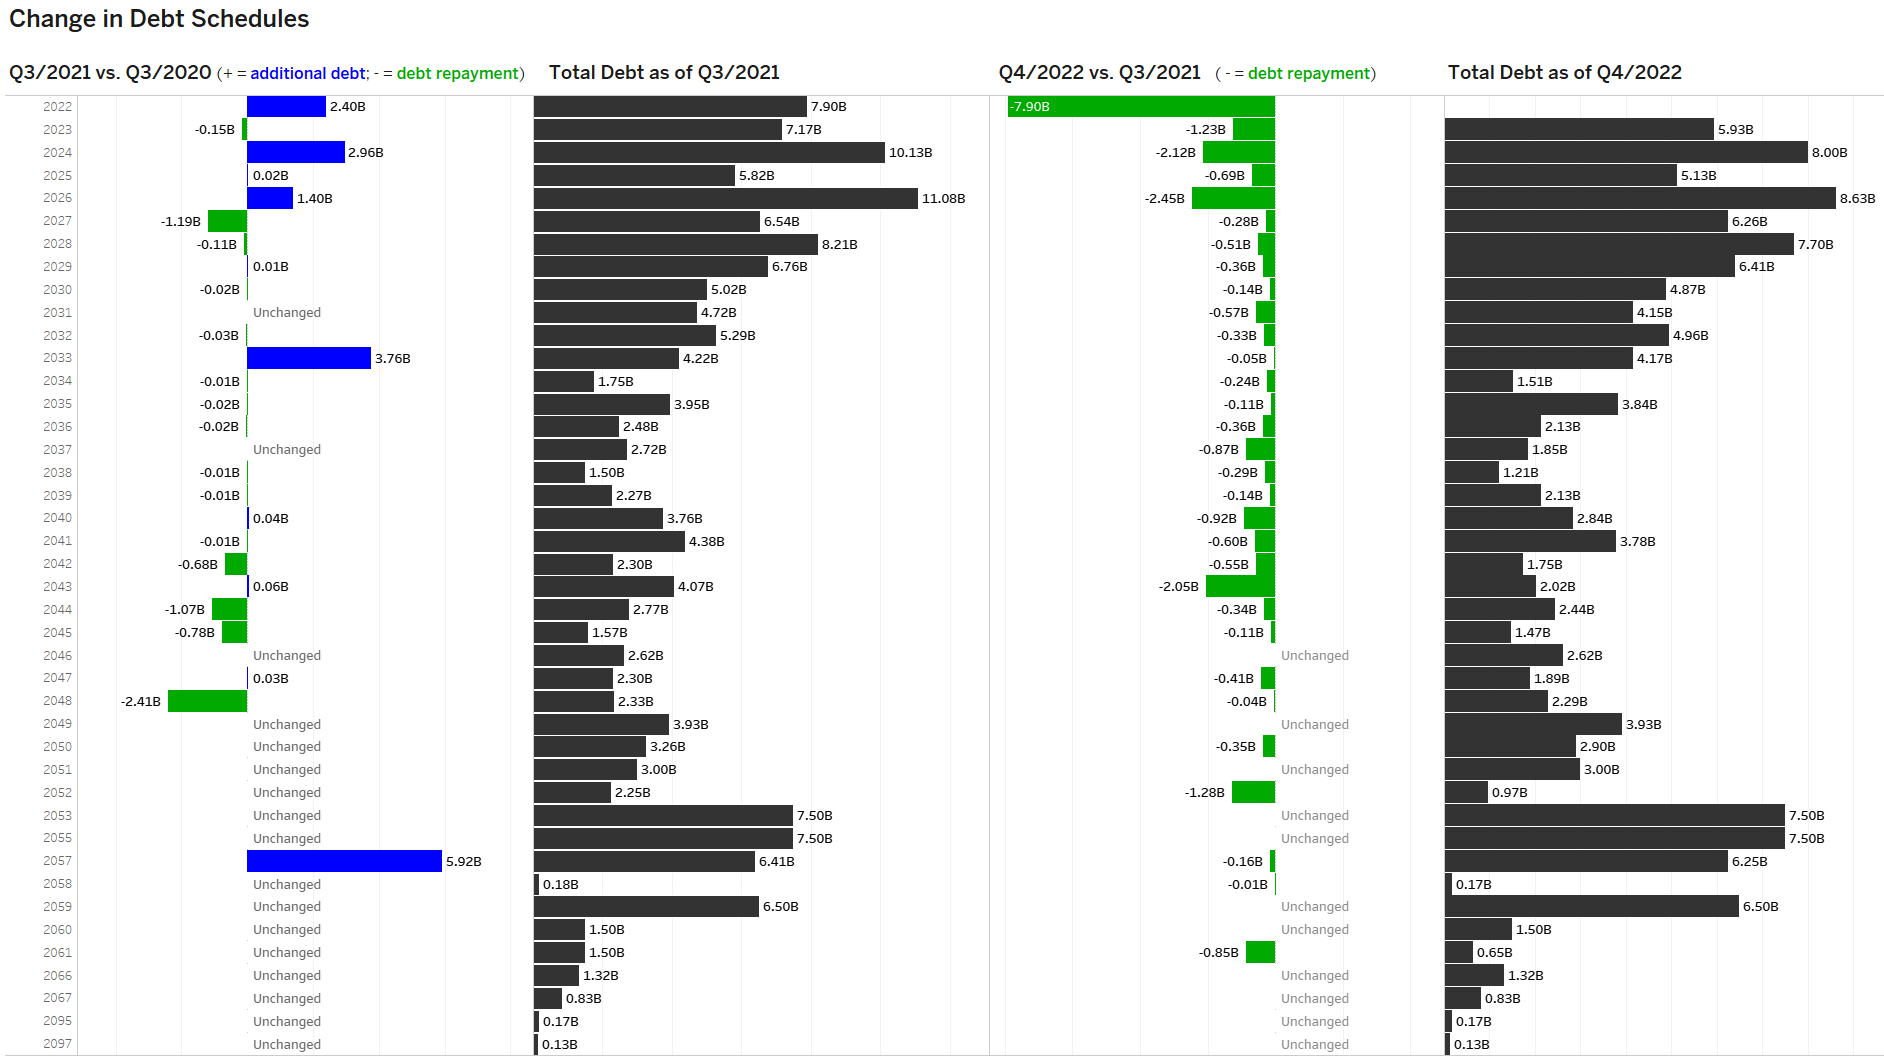
Another way to illustrate this is by plotting debt composition data into pie charts segmented by debt maturity buckets:
- By the end of Q1/2020, 48.2% of total long-term debt was due within the next five years
- By the end of Q3/2020, 33.8% of total long-term debt was due within the next five years
- By the end of Q3/2021, 33.9%% of total long-term debt was due within the next five years
- By the end of Q4/2022, 29.0% of total long-term debt was due within the next five years
AT&T – Change in Debt Composition over Time (Designed by author)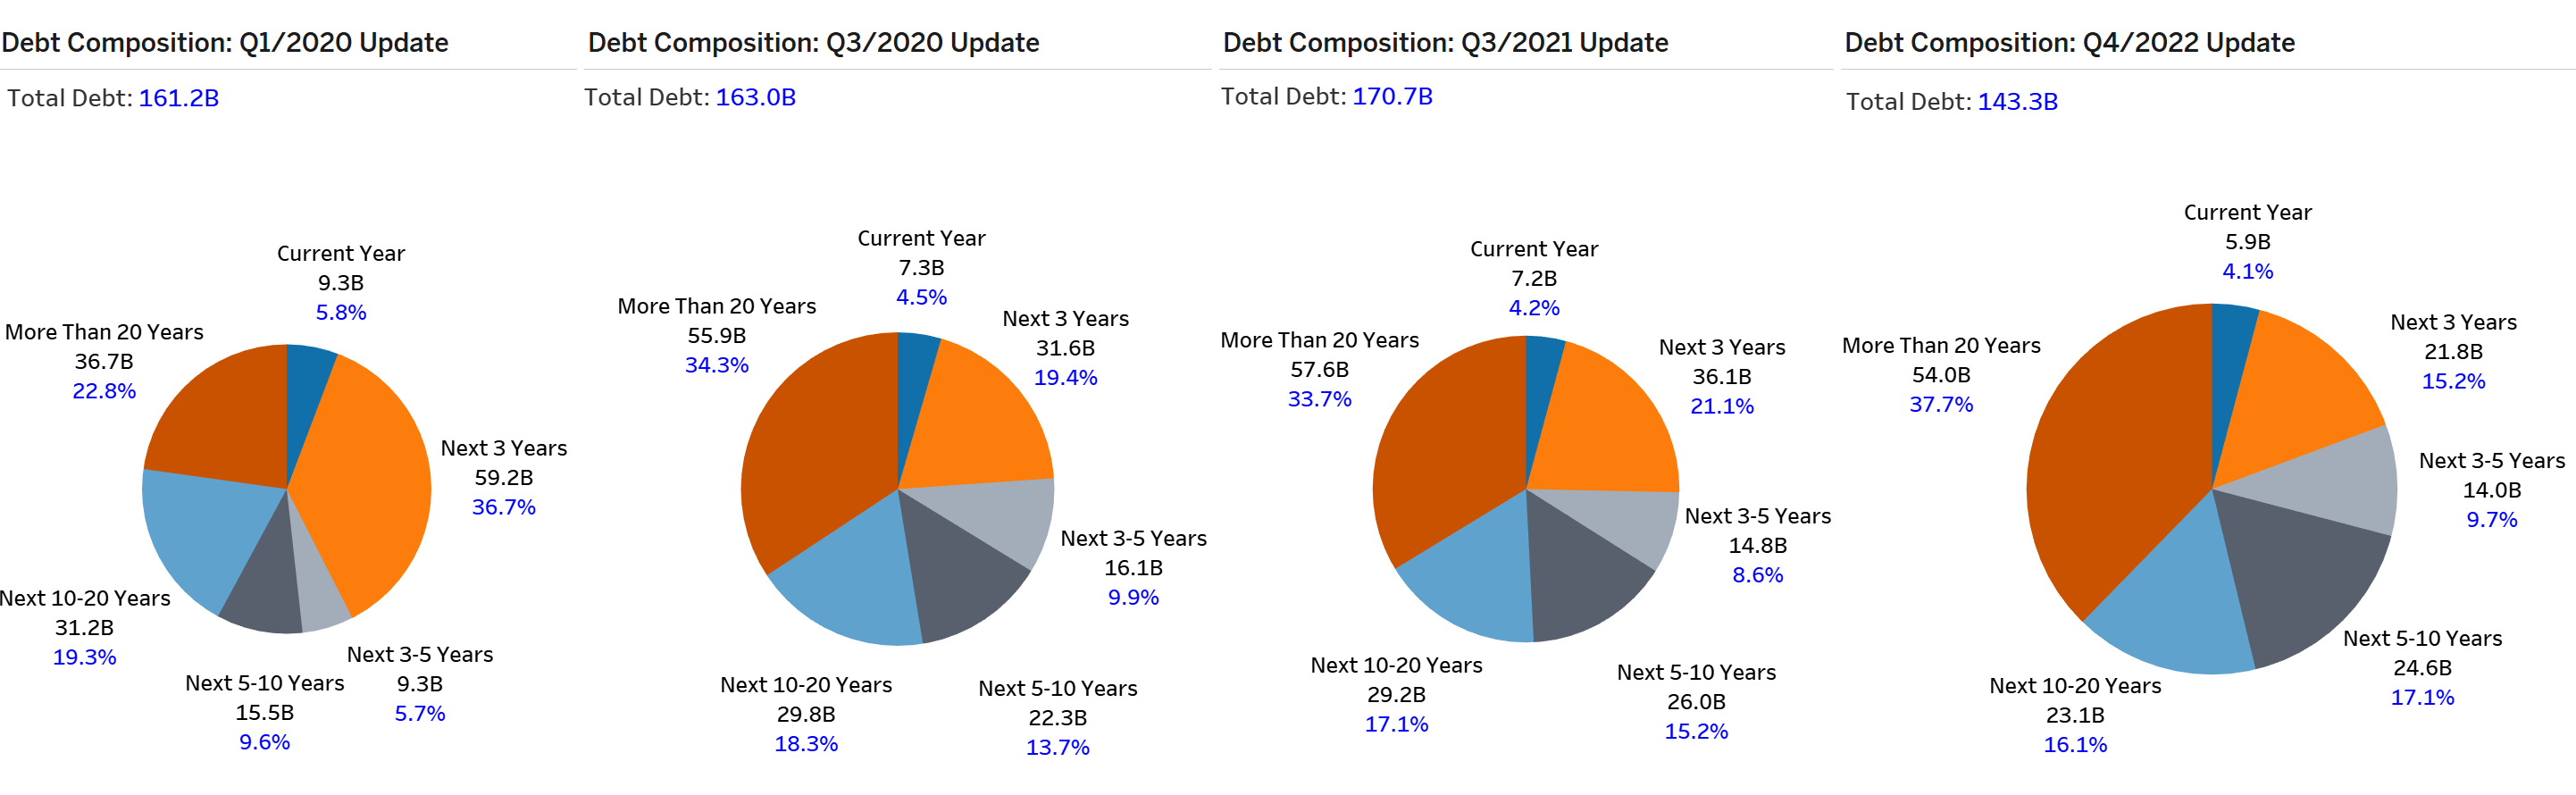
Regarding the 5-10-year debt bucket, the share has increased steadily from 9.6% as of Q1/2020 up to 17.1% as of Q4/2022. As a result, it becomes blatantly obvious, both mathematically and visually, that the bulk of that refinanced debt has been pushed decades into the future and, thus, shouldn’t really give any headache to investors. Additionally, most of the debt that was repaid following structural changes was maturing within the next five years and thus further explains why the 5-10 year debt bucked has been increasing fast. Over two decades, more or less anything can happen, and thus, the best thing to do is focus on what is next, and by next, I mostly mean the next five years. That period “only” covers less than a third of maturing total long-term debt but can still lead to some new insights.
What level of risk does AT&T’s debt level pose?
From 2023 to 2027, AT&T will have to pay back debt of $41.7B. To model what level of risk that debt level poses to AT&T over the next five years, we’ll model three scenarios:
- Base: For 2023, AT&T is guiding for $16B in FCF despite a record low FCF generation in Q1. The market is not buying this and although I am siding with management due to several special effects in Q1, and I have modeled a permanent reduction in FCF of roughly 7% for this period which results in around $14.9B in FCF. EBITDA is projected to marginally grow by 2% every year from a base of $41.5B with dividends remaining flat.
- Optimistic: FCF comes in in-line with management expectations of $16B for 2023 and then grows at a 3% clip; EBITDA grows by 3% annually; stays steady in 2022 at around $26B and then grows by 3% annually; dividends will remain flat in order to focus as much as possible on deleveraging or alternatively building a cash war chest in case of higher than expected capex
- Pessimistic: FCF declines sharply in 2023 to $12.5B well below management’s expectations and then gradually recovers to eventually reach $16B as late as 2027; adjusted EBITDA remains flat the entire period; the dividend will remain stable as management feels it must not do any further damage to AT&T’s long-held status as a popular dividend stock
All scenarios are fairly conservative in my view and should basically show that even under a scenario of substantial FCF collapse starting in 2023, followed by a gradual recovery, AT&T’s debt level remains comfortably manageable. In 2022 the new AT&T generated FCF of $14.1B and will be expected to have a similar level of FCF generation between 2023 to 2027 in the base scenario.
Generally, over the next five full years we’ll see that total debt declines from $143.3B to $109.6B. Based on the debt schedule AT&T will have to redeem around $40B in debt between 2023 and 2027 but at the same time is projected to generate around $34.2B in FCF after dividends which would be sufficient to cover its debt obligations even if we assume that management’s expectations of $16B FCF will never be realized.
To put differently, if the conservative and lackluster base scenario materializes, AT&T can still generate sufficient FCF to cover its debt obligations without having to cut or suspend its dividend.
In that scenario AT&T’s current net debt to EBITDA multiple of 3.5 is projected to come downs as low as 2.4x by the end of 2027 and thus below the 2.5x level which is generally regarded as a somewhat safe level of debt.
BASE scenario
AT&T – BASE Scenario 2023-2027 (Modeled by author)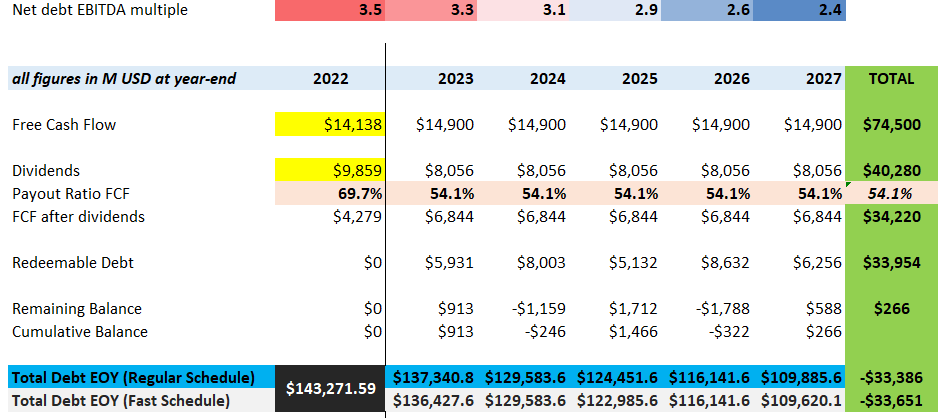
Under the pessimistic scenario FCF is expected to drop sharply in 2023 as AT&T will not be able to fully recover from its weak first quarter of 2023. As FCF gradually recovers over the years, it will eventually reach the 2023 goal of $16B by the end of 2027. In that scenario total accumulated FCF is expected to fall short by $2.2B and not sufficient to cover total redeemable debt of $2.2B which means that AT&T will have to turn to the debt markets mostly in 2023 and 2024 for a total of $4B in new debt.
As FCF recovers AT&T is projected to generate around $1.8B in excess FCF between 2025 to 2027 and thus can manage to service all its maturing debt with very minor impact on its business. The dividend will be kept stable whereas the net debt EBITDA multiple will reach a low of 3.0x by the end of 2027 which is not necessarily a comfortable level, but a manageable level. If that materializes it is almost a given that the stock will see further weakness but neither the business nor the dividend will be at risk even though markets would certainly not be happy about such a slow deleveraging process and declining/stagnating business.
PESSIMISTIC scenario
AT&T – PESSIMISTIC Scenario 2023-2027 (Modeled by author)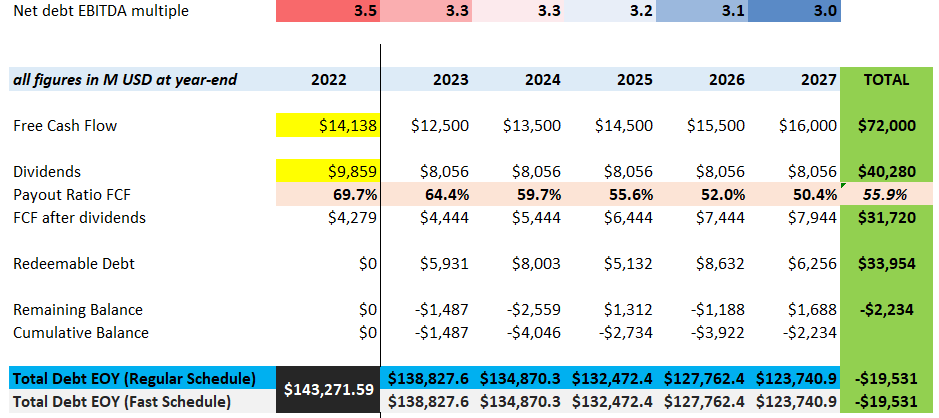
In the optimistic scenario, things obviously look much better even though it is not a truly optimistic scenario as optimism and AT&T apparently have lost credibility judging by the stock price development in 2023 so far.
We are modeling moderate annual growth of 3% for EBITDA and FCF over the next five years and factor in zero dividend growth. Based on these assumptions the projected 5-year FCF after dividends amounts to $44.79B which compares favorably against redeemable debt obligations of $33.9B.
AT&T will generate excess FCF in every single year and can build up a buffer of almost $11B in liquidity that can be used for accelerated debt redemption, buybacks, investments or to account for unknown and uncertain events.
As the dividend will remain untouched, the dividend payout ratio will drop into the mid-40s and thus the stock will be primed to resume dividend growth thereafter at the latest. Deleveraging is progressing quickly and by the end of 2027 the net debt EBITDA multiple has come down to 2.3x.
OPTIMISTIC scenario
AT&T – OPTIMISTIC Scenario 2023-2027 (Designed by author)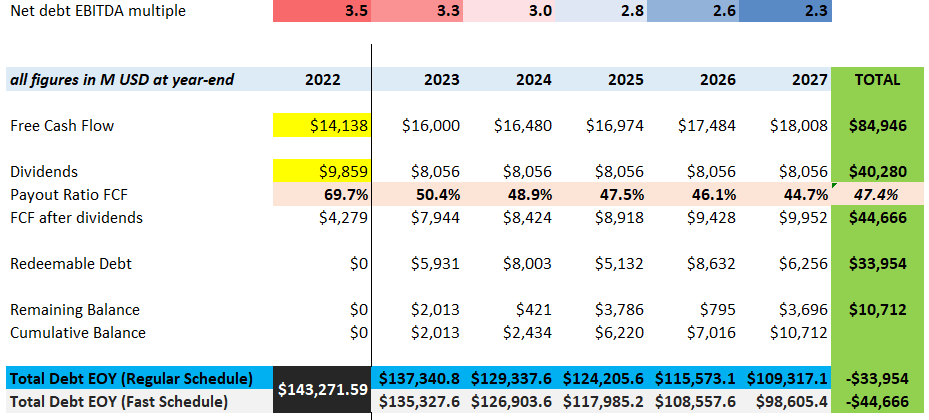
Investor takeaway
Following a thorough analysis of AT&T’s debt situation by the end of Q4/2022, it becomes clearer than ever before that not only can AT&T comfortably service its debt, but in fact, it could also repay large parts of its debt within a few years and still continue paying its hefty dividend.
Following the spin-off of Warner Media, AT&T’s absolute debt level has been reduced significantly while its overall net debt to EBITDA ratio has actually climbed and is currently around 3.3x to 3.5x. That level of debt is high, but manageable even in a high-rate environment as the majority of that debt is fixed.
The market’s pessimism towards AT&T is misplaced, and I believe it has got it wrong. Even in a pessimistic scenario, which is unlikely given management’s guidance, AT&T could still maintain its dividend and bring down its leverage level to 3.0x. In the base scenario, leverage will be reduced substantially to 2.4x over the next five years, which should make investors appreciate the stock’s value unless management embarks on another costly acquisition spree, which would sustainably break trust with investors.
The decision to invest in AT&T should not be based solely on its debt but rather on its business performance. As long as AT&T remains the cash generator we are used to, debt shouldn’t be the problem.
Despite markets racing towards all-time highs, AT&T’s stock price remains in a catastrophic state reaching fresh multi-decade lows as its dividend yield is approaching the 7% yield area despite the company still boasting a very safe, approximately 60% payout ratio.
Existing AT&T shareholders who may have lost faith in the stock price but not in the company’s business should exercise patience. I believe that the hard part is behind us, and AT&T’s valuation has reached absurdly low levels.
Analyst’s Disclosure: I/we have a beneficial long position in the shares of T either through stock ownership, options, or other derivatives. I wrote this article myself, and it expresses my own opinions. I am not receiving compensation for it (other than from Seeking Alpha). I have no business relationship with any company whose stock is mentioned in this article.
I am not offering financial advice but only my personal opinion. Investors may take further aspects and their own due diligence into consideration before making a decision.
Seeking Alpha’s Disclosure: Past performance is no guarantee of future results. No recommendation or advice is being given as to whether any investment is suitable for a particular investor. Any views or opinions expressed above may not reflect those of Seeking Alpha as a whole. Seeking Alpha is not a licensed securities dealer, broker or US investment adviser or investment bank. Our analysts are third party authors that include both professional investors and individual investors who may not be licensed or certified by any institute or regulatory body.