Summary:
- Besides improving financials and guidance as reported in its Q3, I also see other bullish indicators.
- AT&T stock has broken out key resistance levels recently and cleared more space for further price gain.
- Despite recent rallies, T stock remains attractively valued, especially when adjusted for growth and yield.
- With a ~10x P/E, its PEGY ratio is still below 1x, considering a 6% growth potential and 4.75% dividend yield.
yuriz
T stock has broken out
I have turned bullish on AT&T stock (NYSE:T) stock about 1 year ago, have published a few bullish articles on the stock. For example, my most recent article on the stock was published on Nov 5, 2024, and argued for an upgraded rating to STRONG BUY. That article is tilted “AT&T: Q3 Marks An Inflection Point” focused on the following updates provided in its 2024 FY Q3 earnings report (ER):
AT&T recently provided guidance for its free cash flow target and also its deleverage plan. Given the updated guidance, I expect its growth CAPEX allocation to drastically improve in the next 1~2 years. I further expect such an improvement to be an inflection point for its stock prices. The improvement could fundamentally change the prevailing market sentiment and T’s growth CAPEX allocation.
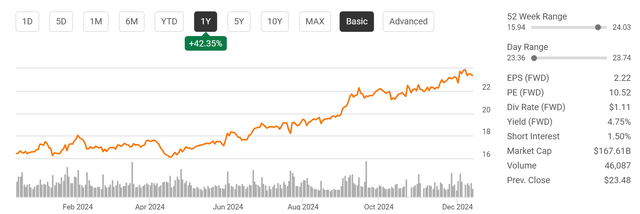
Based on the stock price performance since the Q3 earnings (see the next chart below), I feel the inflection point is materializing. The stock price has gained more than 42% in the past year and now hovers near its 52-week peak. Against this backdrop, the goal of this article is to explain why this is time to let your profit run. My last article has concentrated on business operations, especially its CAPEX allocation. In this article, I will concentrate on the technical trading patterns and also its near-term growth outlook. I will argue that A) technically, the stock has broken out key resistance levels and have created more upside space, and B) in terms of valuation, the stock is still attractively valued when adjusted for its growth potential. Before leaving this chart, note that the stock is still yielding 4.75% currently despite the large price rallies – a point I will revisit later.
T stock: recent technical trading patterns
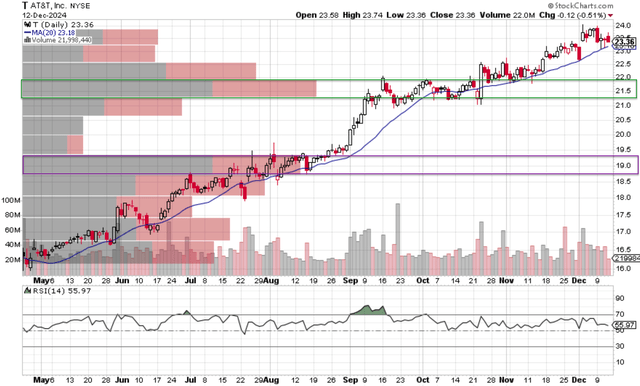
The key resistance levels for the stock were the prices near $19 and $21.5 in my view, judging by the price-volume data from its recent trading. These levels were highlighted by the purple and green rectangles in the following chart, respectively. Trading activities in these two price ranges have accumulated the second highest and highest trading volumes in the past 6 months as seen. T’s current stock price of $23.36 now sits comfortably above both levels. Thus, I have good reasons to believe that the larger number of traders in these price windows have either turned into or been replaced by more optimistic ones.
Besides the above technical signs, other technical indicators also suggest upside potential in its near-term. To start, T stock prices have been staying consistently above its 20-day moving average (MA20) in recent months, a strong bullish signal for its positive momentum. Additionally, the stock has been consistently forming higher highs and higher lows, which is another classical bullish sign. Now, if you switch your attention to the bottom panel that displays its Relative Strength Index (RSI), you will see that its RSI has stayed consistently above a reading of 50 in recent months. An RSI reading above 50 is generally considered as a sign of buying pressure. The RSI is currently at 55.97.
T stock: still attractive valued despite price rallies
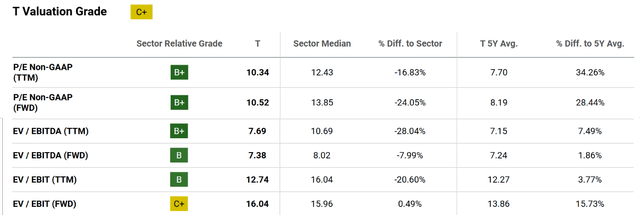
Admittedly, T stock’s current valuation is no longer as attractive as when I first turned bullish on the stock (when the stock was prices at around 7x P/E only). In terms of P/E ratio (on a Non-GAAP and TTM basis), it now trades at around metric, which is more than 34% higher than its 5-year average P/E. However, the current P/E ratio alone can be misleading in at least two ways, in my opinion.
Firstly, its current P/E is still at a substantial discount compared to the sector average (and the discount ranges from 16% to 24% depending on the metric you choose).
Secondly and more importantly, the use of P/E ignored T’s recent debt reductions. When its valuation is measured by enterprise values (EV), the comparison changes quite dramatically. For example, as you can see from the following figure below, its EV/EBITDA and EV/EBIT ratios are 7.69 and 12.74 currently (on TTM basis). They are only slightly above their historical averages by about 7% and 2%, respectively.
T stock: growth potential and growth-adjusted valuation
I also firmly believe that valuation also always needs to be contextualized by growth potential. My approach for estimating organic growth for mature companies like T is detailed in my earlier articles, and I will only quote the final results below:
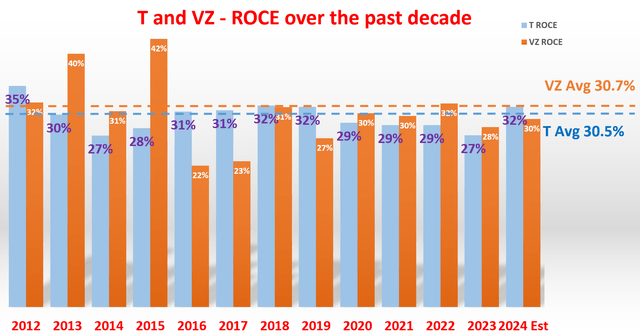
The approach involves the return on capital employed (“ROCE”) and the reinvestment rate (“RR”). The ROCE for T is around 30.6% for 20254 by my estimate as seen in the chart below. Looking ahead, I expect an effective RR of about 20%. With these inputs, T’s organic growth rate would be 6% (30.6% ROCE x 20% RR = 6% growth).
With a 6% growth rate and ~10x P/E, the usual PEG (P/E growth) ratio works out to be around 1.66x, above the 1x ideal threshold by a good margin. However, bear in mind that T pays a quite generous cash dividend. Thus, I think the PEGY ratio is a more appropriate method to adjust for growth because of the following reasons Peter Lynch promoted:
For dividend stocks, Lynch uses a revised version of the PEG ratio – the PEGY ratio, which is defined as the P/E ratio divided by the sum of the earnings growth rate and dividend yield. The idea behind the PEGY is very simple and effective (most effective ideas are simple). If a stock pays out a large part of its earnings as dividends, then investors do not need a high growth rate to enjoy healthy returns. And vice versa. And similar to the PEG ratio, his preference is a PEGY ratio of 1x or below.
For T, its current yield is about 4.75% as mentioned at the beginning of this article. Plugging in a P/E of ~10x and projected growth rate of ~6%, the PEGY ratio works out to be slightly below 1x.
Other risks and final thoughts
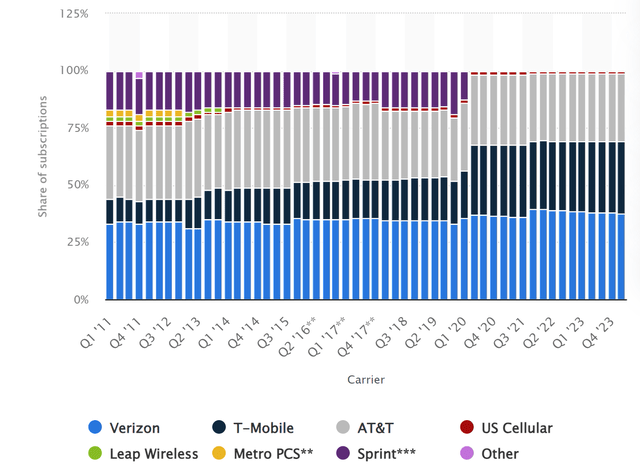
In terms of downside risks, the primary risk is competition – and also fragmentation, in my view – in the telecommunications landscape. To make the situation even more challenging for T, it is still playing to catch up despite its recent progress in my assessment. As an example, the following chart shows the market share of subscriptions among the top wireless network carriers. Currently, the pie is largely shared by T-Mobile (TMUS), Verizon (VZ), and T. TMUS and VZ (especially TMUS) used to have a noticeably smaller share than T in the past. It remains to be seen if T can rebuild its leading share to minimize the fragmentation.
All told, I am optimistic about T’s prospects with its better focused model and strong capital allocation flexibility after the WarnerMedia spinoff. Overall, I see an asymmetric risk/reward profile under current conditions. Thus, I do not believe my STRONG BUY thesis has run its course already. In addition to the encouraging financials (the focus of my last article), this article highlighted two other bullish considerations: its recent technical trading patterns and also its attractive valuation, especially when adjusted for growth and yield.
Analyst’s Disclosure: I/we have no stock, option or similar derivative position in any of the companies mentioned, and no plans to initiate any such positions within the next 72 hours. I wrote this article myself, and it expresses my own opinions. I am not receiving compensation for it (other than from Seeking Alpha). I have no business relationship with any company whose stock is mentioned in this article.
Seeking Alpha’s Disclosure: Past performance is no guarantee of future results. No recommendation or advice is being given as to whether any investment is suitable for a particular investor. Any views or opinions expressed above may not reflect those of Seeking Alpha as a whole. Seeking Alpha is not a licensed securities dealer, broker or US investment adviser or investment bank. Our analysts are third party authors that include both professional investors and individual investors who may not be licensed or certified by any institute or regulatory body.
Join Envision Early Retirement to navigate such a turbulent market.
- Receive our best ideas, actionable and unambiguous, across multiple assets.
- Access our real-money portfolios, trade alerts, and transparent performance reporting.
- Use our proprietary allocation strategies to isolate and control risks.
We have helped our members beat S&P 500 with LOWER drawdowns despite the extreme volatilities in both the equity AND bond market.
Join for a 100% Risk-Free trial and see if our proven method can help you too. You do not need to pay for the costly lessons from the market itself.


