Summary:
- While T may have recorded bottom line and Free Cash Flow beats in FQ2’23, it appears that fear is more powerful than greed, due to the sluggish stock movement afterward.
- Either the stock is priced for failure, or the elevated interest environment remains a great headwind to its short-term execution, depending on when the Fed pivots.
- It remains to be seen what the eventual verdict may be, since we remain confident about FY2023 FCF targets of $16B and FY2025 net debt to EBITDA ratio of 2.5x.
- However, given the massive pessimism embedded in T’s valuations/ stock prices, we are uncertain if there is a floor to its decline in the near term.
- With so many other stocks that offer either capital gain through stock price appreciation, or sustainable income with stable stock performance, investors should beware of this potential value trap.
alexsl
The T Investment Thesis Remains Mixed – Not For The Faint Hearted
We previously covered AT&T (NYSE:NYSE:T) in July 2023, discussing the impact of the Amazon (AMZN) rumors and Wall Street Journal’s lead-lined cable expose. Combined with the lumpy Free Cash Flow generation, it appeared then that there might be no floor to the stock’s downward spiral.
For now, T generates FQ2’23 Free Cash Flow of $4.2B (+320% QoQ/ +200% YoY), exceeding the consensus estimates of $3.77B. This is an optimistic cadence, since the telecom is now nearer to its FY2023 Free Cash Flow guidance of $16B, with $5.2B reported in H1’23 (+20.9% YoY) and the balance weighted toward FQ4’23, similar to its FQ4’22 trend.
Combined with the telecom’s projected moderation in capital expenditures from FY2024 onwards, down from the peak of $24B in FY2023 (+22.3% YoY) and $19.62B in FY2022 (+18.7% YoY), we believe much of Mr. Market’s pessimism on T’s lumpy Free Cash Flow generation may moderate moving forward.
This cadence will be significantly aided by the Fed’s supposed pivot from 2024 onwards, with market analysts already pricing in a peak terminal interest rate of 5.25%/ 5.50% and zero hikes in H2’23.
As a result, we may see T’s elevated interest rate headwind lift as well, with the weighted average interest rate on the outstanding short-term borrowings of $15.26B (+10.9% QoQ/ +145.7% YoY) moderate from the 5.9% reported in FQ2’23 (+0.2 points QoQ).
This is on top of the weighted average interest rate on its long-term debt portfolio remaining stable at 4.1% (inline QoQ/ +0.1 point YoY) by the latest quarter, similar to FY2019 levels of 4.4%.
Then again, T’s EBITDA of $11.59B in FQ2’23 (+1.3% QoQ/ -6.5% YoY) remains underwhelming, despite the stable top lines of $29.91B (inline QoQ/ YoY) and expanding gross margins of 60.5% (+1.4 points QoQ/ +2.1 YoY), thanks to the higher ASPs and expanded ARPUs.
Much of the profitability headwind is attributed to its accelerating operating expenses of $11.17B (+1.5% QoQ/ +18.9% YoY).
Therefore, while the T management may have guided for “increasing use of free cash flows after dividends to reduce debt, and at a faster pace,” we believe its long-term prospects are mixed, despite the optimistic adds in the postpaid phone subscription and Fiber internet service.
While its net debt to EBITDA target of 2.5x may be easily achieved by H1’25, down from the current ratio of 2.88x, based on the current net debt of $133.76BM (inline QoQ/ +1.3% YoY) and annualized EBITDA of $46.36B (+1.3% QoQ/ -6.5% YoY), we are not so certain about its eventual stock recovery.
So, Is T Stock A Buy, Sell, or Hold?
T 1Y EV/Revenue and Market Cap/ FCF Valuations
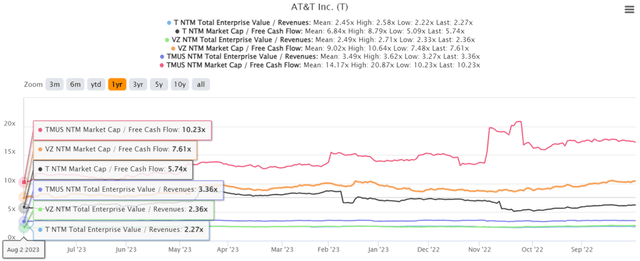
The pessimism is visibly embedded in T’s valuations, at NTM EV/ Revenues of 2.27x and NTM Market Cap/ FCF of 5.72x, compared to its 1Y mean of 2.45x/ 6.86x and 3Y pre-pandemic mean of 2.24x/ 10.45x.
With the stock also trading below its telecom peer’s median Market Cap/ FCF at 9.70x, Verizon’s (VZ) at 7.61x, and T-Mobile’s (TMUS) at 10.23, it appears that Mr. Market is not convinced about T’s FY2023 Free Cash Flow guidance.
This is the real dilemma really, since we remain optimistic about T’s H2’23 weighted Free Cash Flow generation.
On the one hand, T investors that continue dripping from existing dividends may have accumulated more shares, thanks to the depressed stock prices. In addition, we believe that capital gains or losses are only recorded if the stocks are sold.
Combined with the telecom’s sustained dividend payouts, we suppose there is still some decent aspects to investing here, since T’s lower share prices also trigger expanded forward dividend yields of 7.64%, compared to its 4Y average of 6.98% and sector median of 3.34%.
On the other hand, with so many other stocks that offer either capital gain through stock price appreciation, or sustainable income with stable stock performance, we are uncertain if T is a wise investment for new investors.
Its prospects are also impacted by the pessimistic market sentiments surrounding T’s growing debt of $127.61B (+3.3% QoQ/ -2.1% YoY) by the latest quarter.
T 3Y Stock Price
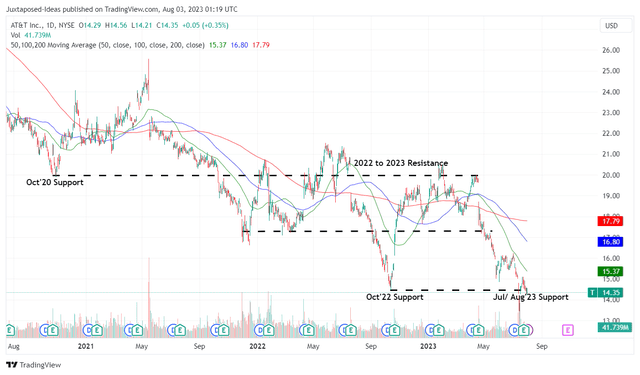
While T may have recorded bottom line and Free Cash Flow beats in FQ2’23, it also appears that fear is more powerful than greed, due to the sluggish stock movement after the recent earnings call, further retesting the October 2022/ July 2023 support levels.
This is a surprising development for us, since we have bullishly looked forward to the stock’s recovery nearer to its pre-FQ1’23-plunge levels of $19s in April 2023, explaining our previous article’s Buy rating.
Therefore, with our optimism tamped down from the mixed prospects and massive pessimism baked in its stock valuations/ prices, we prefer to exercise some caution here and change our rating on T to a Hold (Neutral). With the stock heavily shorted during the worst of the lead-cable worries, volatility may be a constant after all.
Naturally, those who choose to hold T must also be aware that its Free Cash Flow generation remains lumpy, with the debt headwind unlikely to lift until its Free Cash Flow improves from FY2024 onwards. These two issues alone may signal the reduced probability of the stock’s short-term recovery.
Investors should beware of this potential value trap.
Analyst’s Disclosure: I/we have a beneficial long position in the shares of AMZN either through stock ownership, options, or other derivatives. I wrote this article myself, and it expresses my own opinions. I am not receiving compensation for it (other than from Seeking Alpha). I have no business relationship with any company whose stock is mentioned in this article.
The analysis is provided exclusively for informational purposes and should not be considered professional investment advice. Before investing, please conduct personal in-depth research and utmost due diligence, as there are many risks associated with the trade, including capital loss.
Seeking Alpha’s Disclosure: Past performance is no guarantee of future results. No recommendation or advice is being given as to whether any investment is suitable for a particular investor. Any views or opinions expressed above may not reflect those of Seeking Alpha as a whole. Seeking Alpha is not a licensed securities dealer, broker or US investment adviser or investment bank. Our analysts are third party authors that include both professional investors and individual investors who may not be licensed or certified by any institute or regulatory body.


