Summary:
- AT&T’s Q3 earnings report shows strong growth in broadband and wireless segments, despite some declines in overall revenue and legacy wire line services.
- Subscriber additions and ARPU growth in both mobility and broadband segments highlight AT&T’s potential for sustainable long-term growth.
- Comparative valuations indicate AT&T is attractively priced, especially in price-book metrics, making it a compelling investment relative to industry peers.
- Recent price movements and technical indicators suggest continued upside potential, maintaining my “strong buy” rating with a 5.08% dividend yield.
jetcityimage
When I last covered AT&T Inc. (NYSE:T) in my article “AT&T: Surging Higher on Stronger Outlook”, the stock was starting to rally quite strongly and eventually would go on to post gains of over 35.63% in less than six months. Given the stock’s rocky history over the last two years, it was not surprising to see that some readers were a bit skeptical of AT&T’s ability to maintain the rally and continue moving higher. However, given the broad strength that the company has exhibited in prior earnings reports, I thought the bullish outlook was appropriate even though we had not yet received the company’s third quarter earnings release.
AT&T: Surging Gains in 2024 (Income Generator via Trading View)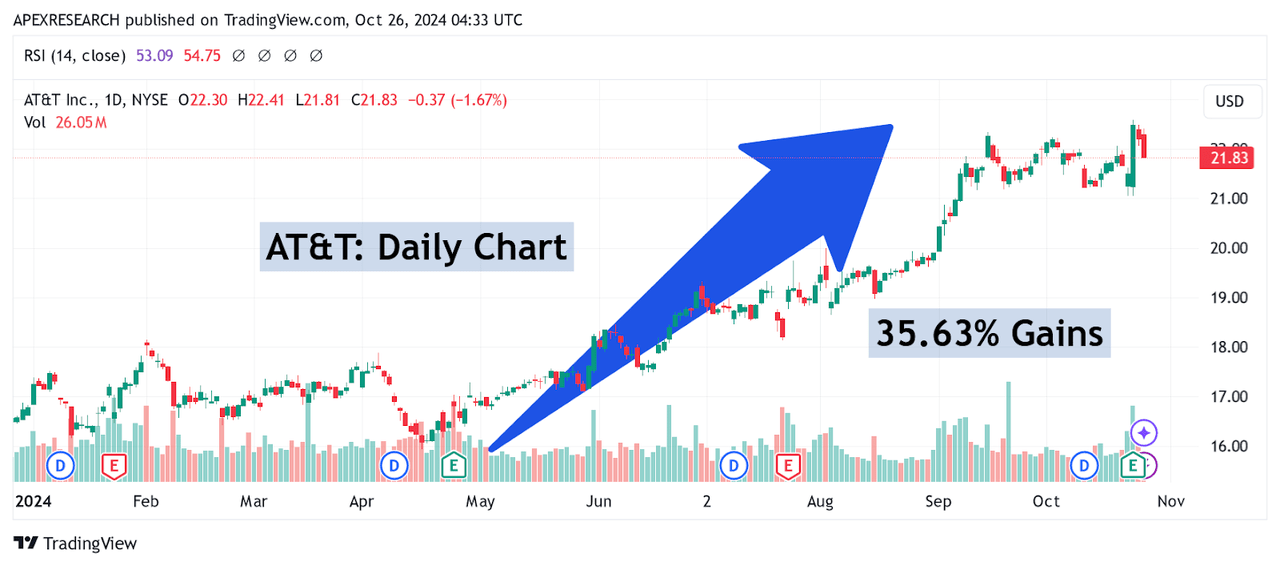
Since then, we have received this important earnings update, and given the evidence of stability that is present in the figures, I think the increase in potential long-term upside now warrants a rating outlook upgrade for the stock. For the third quarter period, AT&T recorded adjusted earnings of $0.60 per share, which did surpass analyst estimates ($0.57 per share) but these figures still indicate annualized declines of -6%. Revenues were a bit weaker (at $30.2 billion), missing consensus estimates calling for $30.44 billion, and these figures indicate relatively flat annualized growth rates of -0.5% for the period. Despite these largely lackluster figures, I found the earnings report to be quite strong in terms of the broad evidence of sustainable growth in the broadband and wireless segments.
AT&T: Q3 2024 Earnings Figures (AT&T: Q3 2024 Earnings Presentation)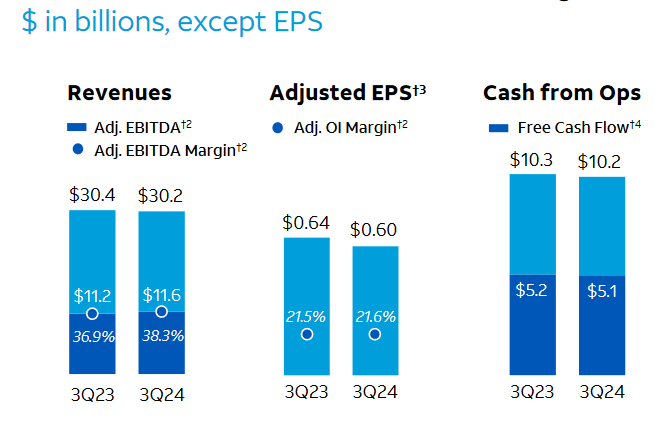
AT&T’s quarterly figures show 429,000 additions from post-paid consumer plans (surpassing estimates of close to 393,400 subscribers), but it should be noted that the company generated 403,000 additions for postpaid phones. Clearly, AT&T is benefiting from premium-tier unlimited subscriber plans that include additional user features (such as more data that can be used for internet hotspots). Overall, ARPU within the postpaid mobile segment rose to $57.07 (which indicates annualized gains of 1.9%). As a result, the company was able to generate $21.1 billion in total mobility revenue (indicating annualized gains of 1.7%). Within this segment, revenues from mobility services were particularly strong, at $16.5 billion (indicating annualized gains of 4%), even while mobile hardware sales were much weaker, at $4.5 billion (indicating annualized losses of -5.7%).
AT&T: Q3 2024 Earnings Figures (AT&T: Q3 2024 Earnings Presentation)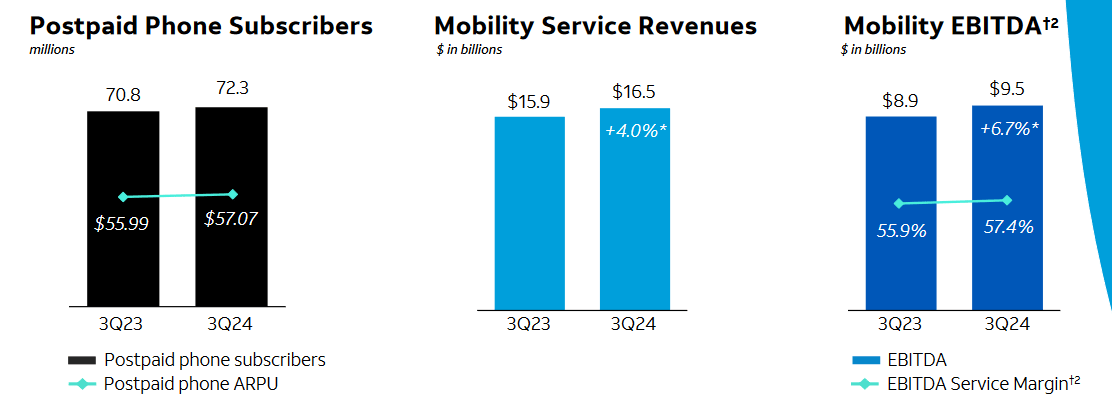
On the broadband side, additional strength was seen as the company gained 135,000 users in their Internet Air services and 226,000 new fiber users. Ultimately, AT&T’s Q3 figures show one million more fiber users than the company had during the same period the prior year (at 9 million total). On the negative side, AT&T saw losses of nearly 200,000 users in non-fiber services, but this is largely due to the fact that bandwidth needs have increased dramatically over the last few years and these users may have upgraded to high-speed alternatives.
AT&T: Q3 2024 Earnings Figures (AT&T: Q3 2024 Earnings Presentation)
For the broadband segment, AT&T’s ARPU figure grew to $68.25 (which indicates annualized growth of 5.1%) and ARPU from fiber customers grew to $70.36 (indicating annualized gains of 3.2%). For these reasons, AT&T was able to generate some of its most impressive quarterly growth figures, with revenues from the retail broadband segment coming in at $2.8 billion (indicating annualized gains of nearly 6.5%) and revenues from fiber users coming in at $2.8 billion (which translates to a massive annualized growth rate of nearly 17%).
AT&T: Q3 2024 Earnings Figures (AT&T: Q3 2024 Earnings Presentation)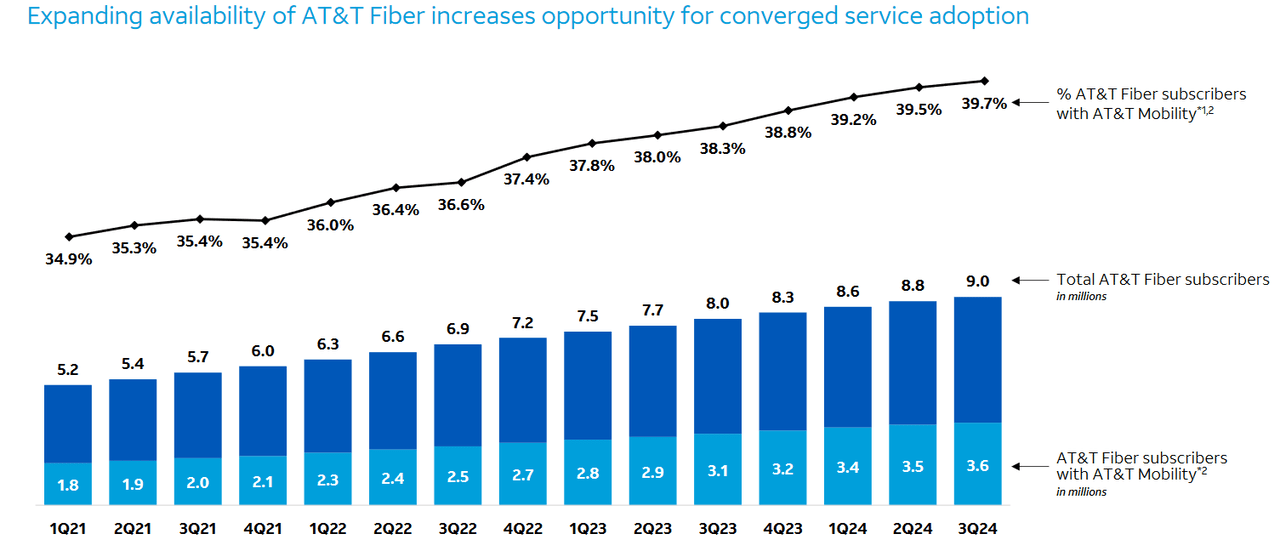
On the negative side, it is also important for investors to understand that revenues from the company’s wire line segment experienced significant -11.8% declines on an annualized basis (at $4.6 billion). Additionally, the company’s strength in subscriber additions might, in some ways, obscure the massive business wire line impairment charge ($4.4 billion) that was absorbed by AT&T, and this is just another major indication that the legacy voice segment is deteriorating in ways that might be irreversible.
AT&T: Comparative Forward Price to Earnings Ratios (YCharts)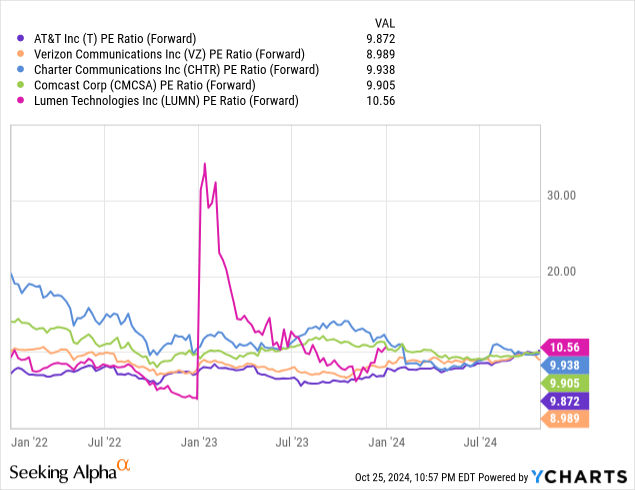
When looking at AT&T’s forward price-earnings ratio of 9.872x, we can see that this is largely in line with industry averages because those averages have nearly flat-lined this year. As examples, Charter Communications, Inc. (CHTR) is currently trading at 9.938x forward earnings, while Comcast Corp. (CMCSA) is seen at 9.905x. Lumen Technologies, Inc. (LUMN) is trading with a slightly higher forward price-earnings ratio of 10.56x, and the cheapest stock in this industry grouping is Verizon Communications Inc. (VZ), which has a forward PE valuation of 8.989x.
AT&T: Comparative Forward Price to Sales Ratios (YCharts)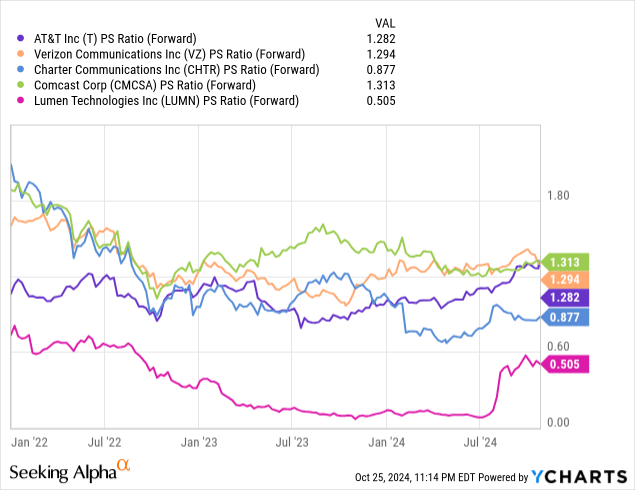
However, if we look at the comparative valuations of these companies through the lens of the forward price-sales metric, there are more substantive differences that start to emerge. Specifically, AT&T is trading in the middle of this peer group at 1.282x. Based on this metric, the most attractive stocks in this group would be Charter Communications (at 0.877x) and Lumen Technologies (at 0.505x). Conversely, the most expensive stocks here would be Verizon Communications (at 1.294x) and Comcast Corp. (at 1.313x).
AT&T: Comparative Forward Price to Book Ratios (YCharts)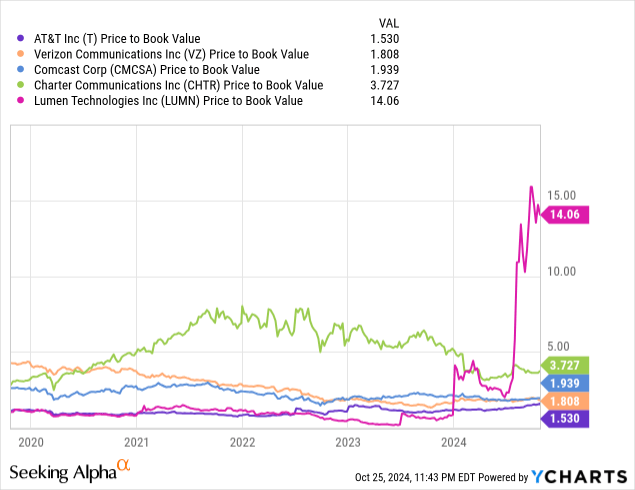
Finally, we should also have a look at the comparative price-book valuations, while AT&T is currently trading with a ratio of 1.53x. From this perspective, AT&T is actually the cheapest stock in this grouping because Verizon is currently trading with a price-book ratio of 1.808x, and Comcast is now seen at 1.939x. Other alternatives are trading at much higher valuations, with Charter Communications now trading at 3.727x and Lumen seen at much more elevated levels (at 14.06x). Based on these figures, I think the comparative price-book valuation gives us the most informative perspective because these industry peers diverge much more sharply when viewing this specific metric.
AT&T Key Support and Resistance Zones (Income Generator via Trading View)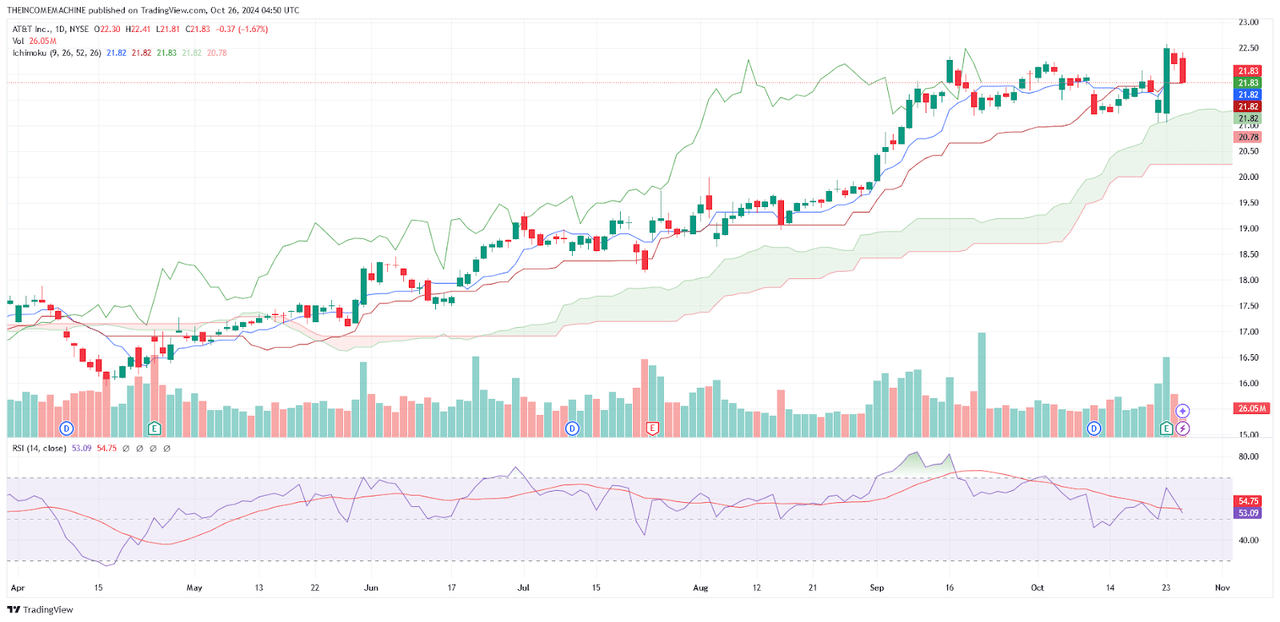
Recent movements higher in share prices have been supported by AT&T’s strong subscriber growth and the attractive relative valuations that can be seen when comparing the company with other stocks in the same industry group. Rallies from the October 23rd trading session have also broken through important resistance levels that suggest the stock’s longer-term uptrend remains viable, with the potential for continued upside heading into the final months of the year. Specifically, resistance zones found near $22.34 (marking the highs from September 16th, 2024) have been broken during these recent surges in price action, and this shows that a stable series of higher highs and higher lows has been in place since April 16th (which is when the major trend low at $15.94 was established). Additionally, indicator readings in the relative strength index shown on the daily charts currently rest near 53.1. Interestingly, this reading has held near the midpoint of this indicator histogram since roughly the 10th of October, and this suggests that share prices could still see fairly sizable rallies higher before entering into overbought territory (as defined by the 70 level).
AT&T: Potentially Bearish Pivot Points (Income Generator via Trading View)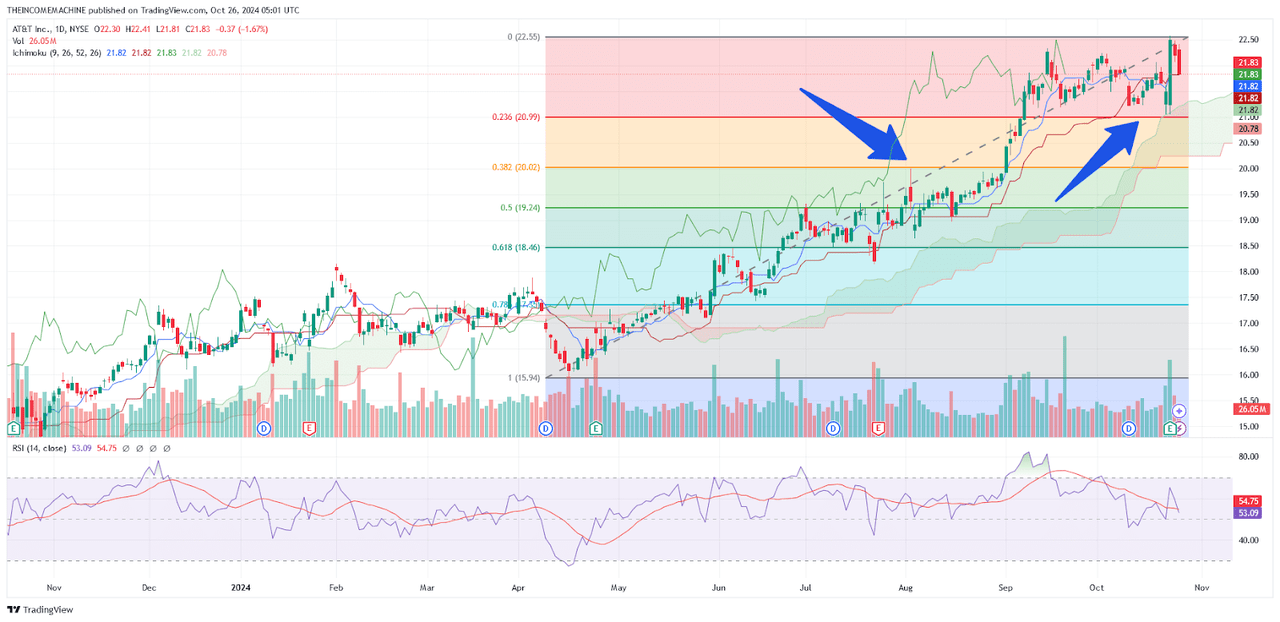
Ultimately, I would need to see share prices break below $21.05 in order to start reversing my bullish outlook. Specifically, this area marks the stock’s price low from October 22nd, 2024, and this price region matches quite closely with the 23.6% Fibonacci retracement zone in the move from the April 16th lows of $15.94 to the near-term highs at $22.58 (which is located just below $21 per share). If we do see this important support zone break to the downside, I would then view price action as entering into consolidation territory, and I would begin to expect sideways trend activity. However, price declines below the $20 level might actually signal the potential for a deeper retracement because this area marks the 38.2% Fibonacci retracement of the aforementioned price move as well as a prior resistance zone from August 2nd, 2024 that would now be expected to work as support. If these declines are seen, I will need to reassess my current outlook because this would provide stronger evidence that the stock’s current uptrend might be coming to an end. Until I see this type of bearish evidence start to develop, I will continue to hold my long position in this stock while collecting a very attractive 5.08% dividend yield and maintaining my current “strong buy” rating for this classic income generator into the final months of this year.
Analyst’s Disclosure: I/we have a beneficial long position in the shares of T either through stock ownership, options, or other derivatives. I wrote this article myself, and it expresses my own opinions. I am not receiving compensation for it (other than from Seeking Alpha). I have no business relationship with any company whose stock is mentioned in this article.
Seeking Alpha’s Disclosure: Past performance is no guarantee of future results. No recommendation or advice is being given as to whether any investment is suitable for a particular investor. Any views or opinions expressed above may not reflect those of Seeking Alpha as a whole. Seeking Alpha is not a licensed securities dealer, broker or US investment adviser or investment bank. Our analysts are third party authors that include both professional investors and individual investors who may not be licensed or certified by any institute or regulatory body.
