Summary:
- Analysis requires patience and a focus on fundamentals, even when unpopular.
- TELUS Corporation initially outperformed AT&T Inc., but eventually AT&T caught up and outperformed by 22%.
- We examine that switch call and see whether we would make a similar bet today.
jetcityimage/iStock Editorial via Getty Images
A lot of the success of analysis comes down to waiting. This involves focusing on fundamentals and taking a longer term. Such views can often be unpopular when the trend is not your friend. Such was the case when we drew a hard line in our comparison between TELUS Corporation (TU) and AT&T Inc. (NYSE:T). While both operated in oligopolistic markets, we felt the valuation justified Selling TELUS and Buying AT&T. One of the biggest hints that we were on the right track was the comment stream where the title was treated as a punchline to a hilarious joke. We look at how that played out and whether we would make a similar call today on the two telecom giants.
The Total Return Metric
You can see from the chart below, that trade idea was off to a very rocky start. TELUS was really having none of our logic, and within 5 months after that article, it had outperformed AT&T by over 30%.
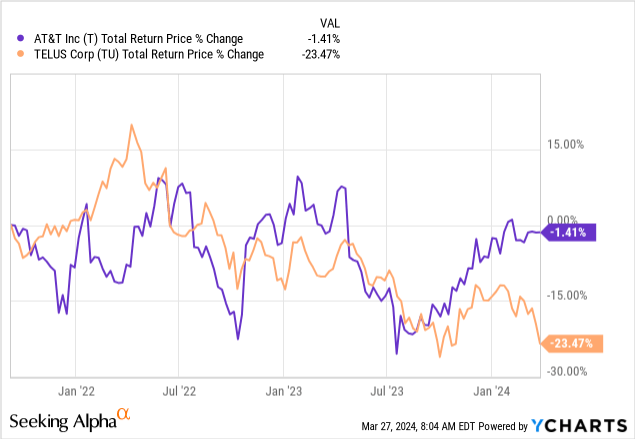
So, our timing was really off, but soon the exceptionally bloated valuations of TELUS began to feel the burden of risk-free rates moving up. The two stocks caught up and traded in sync till September 2023. In other words, two years after the initial call, there was nothing to show for it. So, that is the “patience” part we were referring to. We finally got that tremendous alpha, and AT&T has now outperformed TELUS by 22%.
Current Metrics
Our call was based on fundamental valuations, and TELUS was expensive across a host of metrics. Let’ see how they have moved over time. Our favorite in this space is the EV to EBITDA number. We like this as capex cycles vary and earnings and free cash flow, while important, don’t necessarily make great comparatives at any one point in time. We felt that the Canadian telecoms were at the more aggressive part of the capex cycle and hence this was even more important.
At the start, TELUS was 2 multiples more expensive on EV to EBITDA. We will stress here that two multiples of EBITDA is a lot in these low-growth sectors. That can be the difference between 10 year total annualized returns of 0% and 6%.
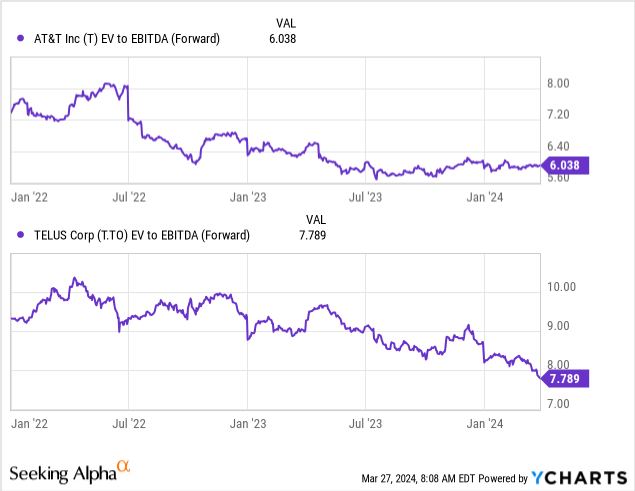
Both multiples have come in and come in sharply. TELUS is now approaching where AT&T was at the beginning of this exercise. But interestingly enough, the differential today still is very close to where it was in September 2021. So based on this one, we can argue that both are actually cheaper today, but AT&T still remains far cheaper.
Dividend Yield
This will be a sore spot for AT&T investors but we will poke at it anyway. AT&T reduced its dividend after our article was out, in conjunction with the Warner Bros. Discovery (WBD) spinoff. But that exercise, which was out in the open around the time we wrote our thesis, is also why AT&T underperformed so painfully in the initial phase. Today, TELUS is bordering on a 7% yield and AT&T actually yields less.
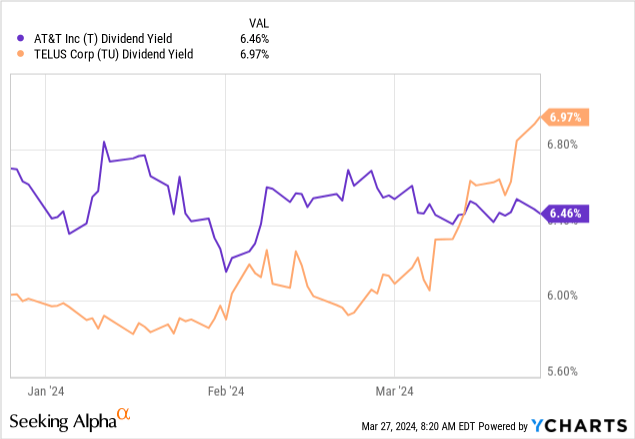
So from a strict income perspective, AT&T has lost the battle. But there is more to the story. AT&T’s dividend coverage is phenomenal. We see the company at close to a 14% free cash flow yield, and the last guidance alluded to this as well.
When you combine all these factors, we expect to deliver free cash flow in the $17 billion to $18 billion range this year. This is greater than 2x our current annual common dividend
Source: AT&T Q4-2023 Conference Call Transcript.
TELUS barely covers the dividend via free cash flow yield this year, and that is a huge improvement over where it has been in 2022 and 2023. But we are looking at that trough in free cash flow per share in the rearview mirror, and things should improve here on out. Based on consensus 2025 estimates, TELUS is closer to an 8.3% free cash flow yield. Enough for the dividend and some debt paydown.
If you are looking for a strictly higher yield, TELUS has some merit, but it really lacks the safety of the AT&T dividend. The latter would hold up even in a bad recession.
The Macro
The two operate in different markets, but the setups are similar. Oligopolies tend to function with a similar model and don’t price themselves into oblivion trying to grab market share. Where AT&T has the advantage today is that Canadian telecoms are actually trying a very aggressive market share grab. This is beginning to show up in the Average Revenue Per User (ARPU) for TELUS. TELUS actually had a different type of advantage and that was with the unprecedented levels of immigration over the last two years into Canada.
WOWA As Shared On X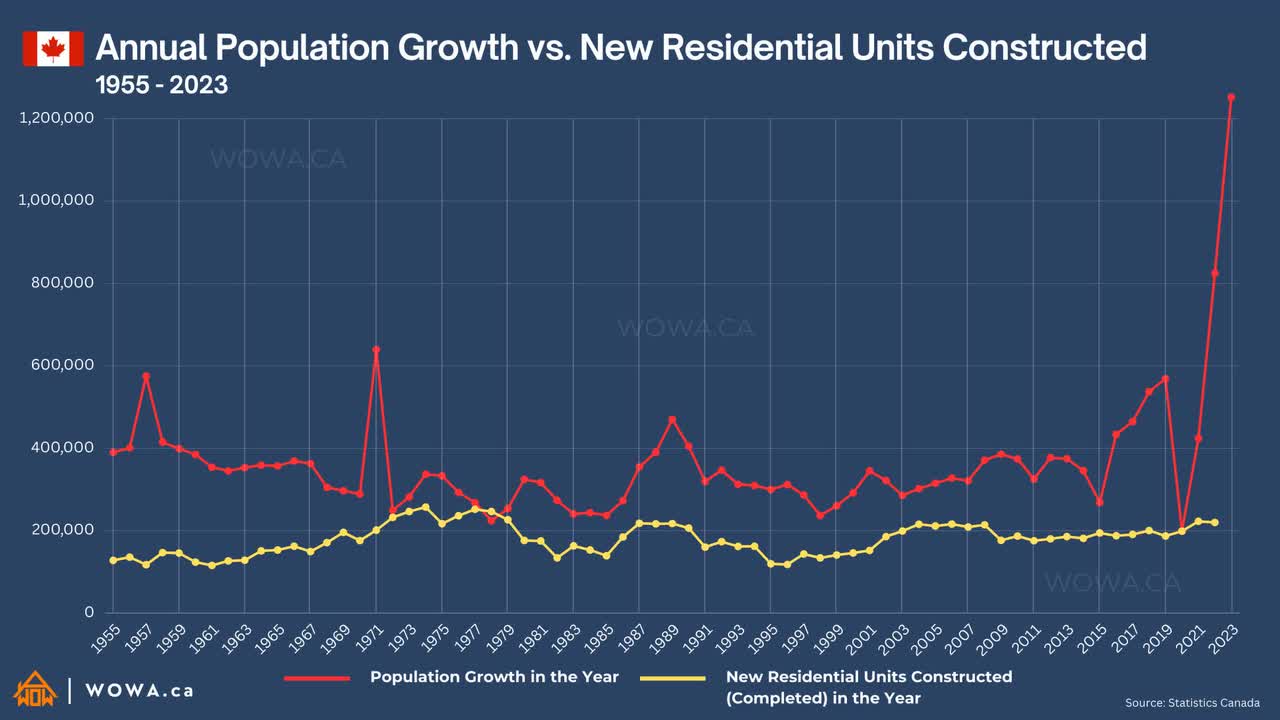
That tailwind appears to be receding. The Liberal Party is being beaten mercilessly in the polls on this issue and is finally taking concrete steps to help solve the issue. Canada also is more vulnerable to the rate hikes that were put in, as we don’t believe in that silly concept of locking mortgages for 30 years. 5 is about as high as we can count. So, this will be quite challenging over 2024 and 2025 as mortgage rates adjust up and spending gets crimped. Overall, the macro is slightly better for AT&T in our opinion.
AT&T Vs. TELUS: Total Returns
Below is the ratio chart of AT&T’s total returns to that of TELUS. When it is going up, AT&T is outperforming and vice versa.
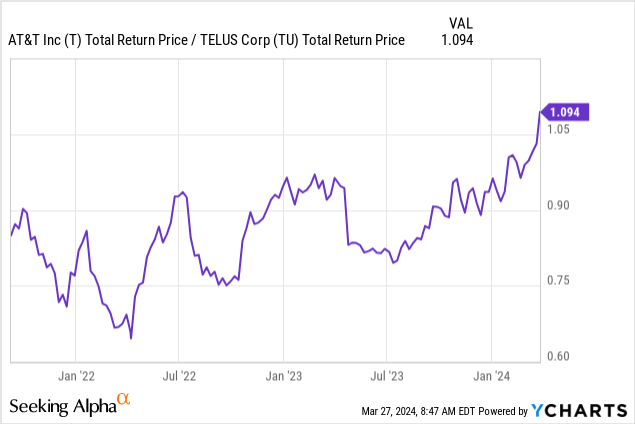
Currently we think a pause may be in order on this one. But longer term we don’t see the move as over. AT&T and TELUS are likely to converge at 7X or at 8X EV to EBITDA multiples. In the former case, TELUS likely moves lower and AT&T moves up. In the latter case AT&T moves up a lot more than TELUS.
Verdict
If you are looking from a relative valuation perspective, AT&T still maintains a sizeable lead over TELUS. This is despite the 22% outperformance. If history is any guide, extreme examples of undervaluation move to the opposite ends of the spectrum (pun intended). So it would not surprise us to see AT&T at 9X EV to EBITDA and TELUS at 6X EV to EBITDA in 5 years. So our trade is alive and well.
That said, as a standalone, TELUS is looking far better than it did two years back. Valuation is reasonable and we think the pricing wars will die down soon. With the 7% yield plus another 5% off covered calls, we can make a reasonable setup for a 12% yield on this with relatively lower total return risk. We are doing that for our portfolio and despite expecting AT&T to be the winner, we are now long both.
The Preferred Shares
As bullish as we continue to be on AT&T and its common shares, we have a completely different take on the two sets of preferred shares.
1) AT&T Inc. 5% DEP RP PFD A (NYSE:NYSE:T.PR.A)
2) AT&T Inc. 4.7% DEP SHS PFD C (NYSE:NYSE:T.PR.C)
The two preferred shares are both rated as BB+ by S&P and are an odd setup for their relative ratings. In general, even in today’s market, you would want BB+ securities to be yielding at least 6.5%. Currently, they both yield 5.7%, which is incredibly low. Brookfield Renewable Partners L.P. 5.25% PFD CL A (BEP.PR.A) which are actually rated as investment grade (BBB-), yield 7.11%. Agree Realty Corporation 4.250% DEP PFD A (ADC.PR.A) yield 5.85% and are also rated the same. You can get shorter term investment grade bonds yielding over 6.5%. We rate both the preferred shares as a Sell.
Please note that this is not financial advice. It may seem like it, sound like it, but surprisingly, it is not. Investors are expected to do their own due diligence and consult with a professional who knows their objectives and constraints.
Analyst’s Disclosure: I/we have a beneficial long position in the shares of T, T:CA either through stock ownership, options, or other derivatives. I wrote this article myself, and it expresses my own opinions. I am not receiving compensation for it (other than from Seeking Alpha). I have no business relationship with any company whose stock is mentioned in this article.
Seeking Alpha’s Disclosure: Past performance is no guarantee of future results. No recommendation or advice is being given as to whether any investment is suitable for a particular investor. Any views or opinions expressed above may not reflect those of Seeking Alpha as a whole. Seeking Alpha is not a licensed securities dealer, broker or US investment adviser or investment bank. Our analysts are third party authors that include both professional investors and individual investors who may not be licensed or certified by any institute or regulatory body.
Are you looking for Real Yields which reduce portfolio volatility?
Conservative Income Portfolio targets the best value stocks with the highest margins of safety. The volatility of these investments is further lowered using the best priced options. Our Enhanced Equity Income Solutions Portfolio is designed to reduce volatility while generating 7-9% yields.
Take advantage of the currently offered discount on annual memberships and give CIP a try. The offer comes with a 11 month money guarantee, for first time members.
