Summary:
- AT&T’s stock has surged over 50% from its all-time lows, with technical analysis indicating strong bullish momentum and potential for further gains.
- Daily, weekly, and monthly moving averages show increasing bullish momentum, despite some near-term resistance and pullbacks.
- Key indicators like MACD and RSI confirm the uptrend, suggesting that the current rally is more sustainable than previous bear rallies.
- AT&T stock is undervalued based on stabilized financial results, with potential for multiple expansion, justifying a buy rating.
JamesBrey
Thesis
AT&T Inc.’s (NYSE:T) multiyear comeback has started with a bang. The stock has rocketed over 50% from its all-time lows and from my technical analysis, it could be just the beginning. In the analysis below, I determine that in the short and intermediate term, AT&T stock is like dynamite as its uptrend sees increasingly strong bullish momentum with key indicators confirming the bull run. In the longer run, while there is some overhead resistance, there are significant signs that the long-term bottom is in. In addition, when looking at AT&T’s fundamentals, it is clear that its stock is undervalued as the stabilization of their financial results should justify higher valuation multiples. Therefore, after analyzing both the technical picture as well as the fundamentals, I initiate AT&T stock at a buy rating.
Daily Analysis
Chart Analysis
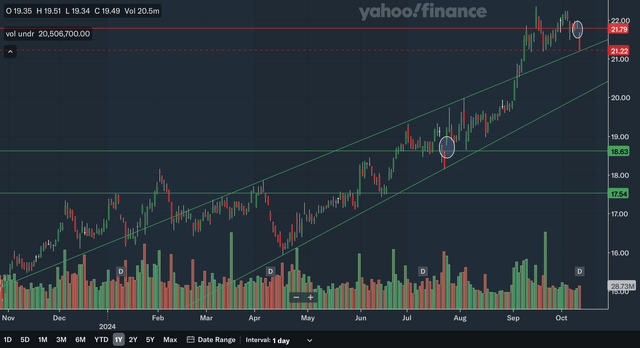
In the daily chart, you can see that AT&T has had a remarkable run-up as of late. It broke the upper channel line at the beginning of September, showing that its uptrend is accelerating. It has pulled back a bit very recently and there is a gap that I have circled at around $21.80 which could be resistance for the stock in the near future. The upper channel line should be support and is rapidly advancing. The bottom channel line would be the next level of support and is currently nearing $20.50. There is another gap that I have circled at around $18.60, this time on the uptrend, and should therefore be support. Lastly, there is a support zone in the mid-17s as that area has been support/resistance a total of five times in the past year, showing it is significant. Overall, I believe the daily chart shows that AT&T’s bull run is strong with plenty of support underneath. In my view, while there may be some resistance with the recent gap, the strength of the uptrend will likely see AT&T break that level in the not-so-distant future.
Moving Average Analysis
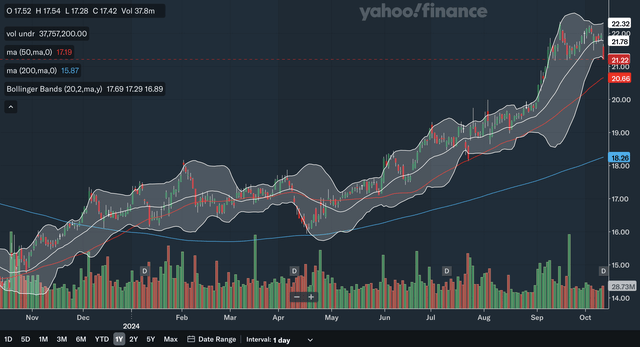
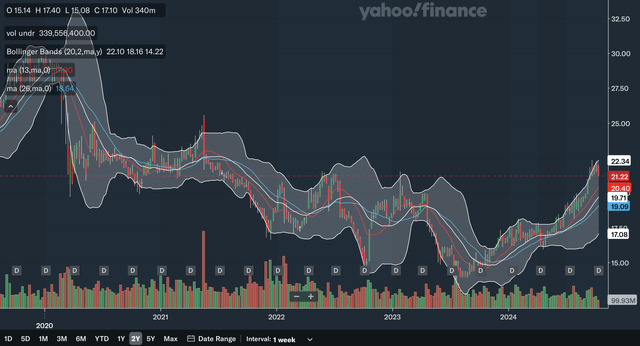
The 50-day SMA and the 200-day SMA had a golden cross back in December of last year, and the stock has basically not stopped surging since. The 50-day SMA is continuing to widen the gap with the 200-day SMA, showing that the bullish momentum is strengthening. The stock currently trades above both moving averages, with the 50-day SMA’s support quite near the current stock level. For the Bollinger Bands, the stock is currently at the lower band, showing that it is near-term oversold and could be due for a rebound. The stock did break the 20-day mid-line of the Bollinger Bands, which should have acted as support in the uptrend. However, the stock did the same in July and was able to recover quickly and resume the bull run. From the daily moving averages, I believe they reflect a strong uptrend for AT&T and increasing bullish momentum.
Indicator Analysis
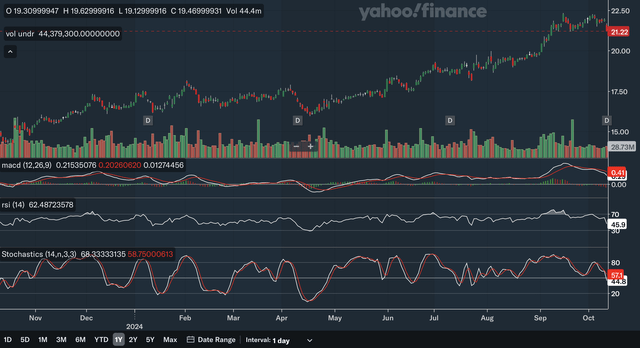
The MACD’s bearish crossover with the signal line reflects the current consolidation and minor pullback of the stock. The MACD did confirm the recent 52-week high as the MACD, in September, hit its highest level in the past year. The current widening of the gap between the MACD and the signal line is a bit of a concern as it shows the pullback gaining a bit of momentum. As for the RSI, it also confirms the recent 52-week high as it also recorded its highest reading in the past year. The confirmation of these two key indicators shows that the uptrend is highly intact for AT&T. Lastly, for the stochastics, currently the %K line is below the %D line after a bearish crossover earlier this month. Again, this indicator reflects the current consolidation and recent pullback and is not a major red flag in the big picture. In my view, the daily indicators show some near-term weakness, but the more important signal is the MACD and RSI confirming the uptrend.
Takeaway
I believe the daily analysis, as a whole, shows that AT&T stock is in a good position to advance in the short term. The chart shows that there is plenty of support underneath the stock, while the moving averages show increasing bullish momentum. Lastly, the indicators confirm the uptrend’s reliability. Therefore, in my view, the near-term technical outlook is bright.
Weekly Analysis
Chart Analysis
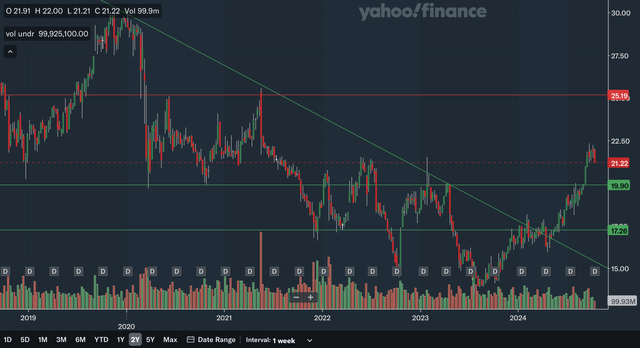
The weekly charts show that AT&T’s stock broke out of an intermediate term downtrend earlier this year. The downtrend line was in effect all the way back in 2019 and so the break of this line is very significant. The area of resistance I identified is in the mid-20s as this level was resistance back in 2020 and 2021. The nearest area of support would be at around 20, which is a psychologically important price. The zone has been support/resistance a total of six times during the past few years, showing it is highly significant. The next level of support would be in the 17s, as this area was support in 2021 and 2022, and was resistance earlier this year. Lastly, there is also the former downtrend line that could provide support but is quickly dropping out of range. Overall, I believe AT&T stock is in a good place for the intermediate term as well. There is support underneath the stock, and potential resistance is still quite far above.
Moving Average Analysis
The 13-week SMA and the 26-week SMA had a bullish crossover in late 2023 and the stock has been ripping higher ever since. Similar to the daily MAs, the 13-week SMA is currently widening the gap with the 26-week SMA, reflecting increasing bullish momentum. The stock is trading above both of the moving averages, with the 13-week SMA providing very nearby support. The stock recently hit the upper band of the Bollinger Bands, showing it was a bit overbought. Therefore, the recent pullback is a healthy one for AT&T and the 20-week mid-line should also provide support. In my view, these weekly moving averages reflect a strong intermediate term uptrend for AT&T as they show building bullish momentum.
Indicator Analysis
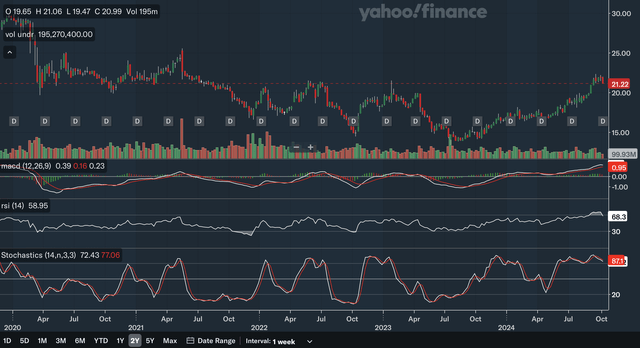
Currently, the MACD is above the signal line, which is a bullish signal. However, the gap between the two is shrinking, as shown by the histogram. This is not too surprising given that the stock is currently experiencing an overbought pullback. The intermediate term MACD also confirms the uptrend, as it has hit its highest levels since at least back in 2019. For the RSI, it also confirms the uptrend, as it has also recorded its highest reading in the past few years. The stock was in the overbought 70 zone earlier this year, and so the recent pullback is again not surprising. Lastly, for the stochastics, the %K line is below the %D line within the overbought 80 zone, which is bearish. However, as you can see, the stochastics has not dropped below 80 since July, showing that AT&T is in a sustained uptrend. From these weekly indicators, I believe AT&T’s intermediate uptrend is confirmed despite the near-term pullback.
Takeaway
I believe the intermediate term technical outlook for AT&T is strong. The charts show that resistance remains far above current levels, while the moving averages show once again that the uptrend’s momentum is strong. The indicators do reflect the near-term pullback, but nonetheless confirm that the intermediate term uptrend is valid.
Monthly Analysis
Chart Analysis
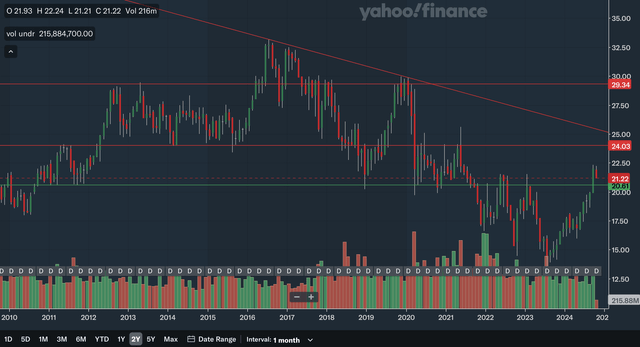
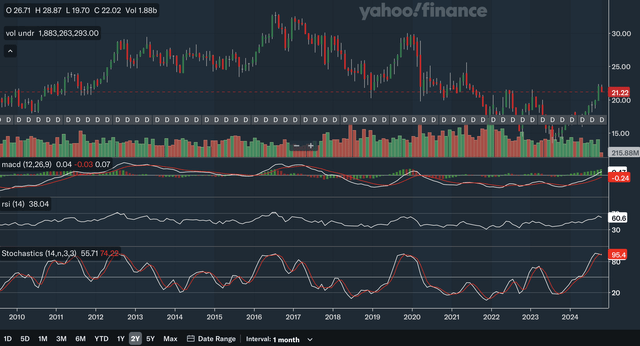
The monthly chart shows that there is some important resistance above AT&T. The nearest level of resistance would be at around 24 as that area was solid support from 2013-2015 and resistance in 2020 and 2021. The next source of resistance would be the downward trend line that has been in effect since 2016. This could be concerning as the trend line continues to slope downward, potentially pressuring the stock in the upcoming years. The final area of resistance I identified is near 30 as that area was resistance in 2012, 2013, and 2019. The only area of support is at around 20. This support zone was identified in the weekly analysis, but as you can see here, its significance stretches back for more than a decade. I believe from the monthly chart, it is clear that there is more resistance than support. The resistance remains quite far above if you are in the short or intermediate time frames, but in the longer term, it could cause limited significant upside.
Moving Average Analysis
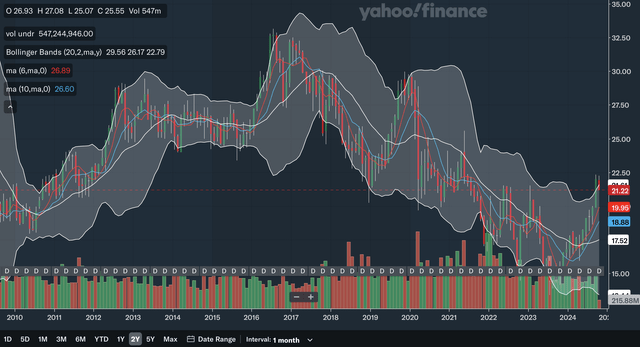
The 6-month SMA had a bullish crossover with the 10-month SMA very early this year and once again, the stock has surged since that signal. After a brief period of the SMA’s gap narrowing, the 6-month SMA is pulling further away from the 10-month SMA again, showing a resurgence in bullish momentum. The stock trades above the two SMAs currently. It is also at the upper band of the Bollinger Bands and is pulling back, once again reflecting that the stock is correcting from an overbought position. As shown in the chart analysis above, AT&T is still in a longer-term downtrend. Since the Bollinger Bands’ 20-month mid-line should act as resistance in a downtrend, the stock being able to break above that line earlier this year could serve as an indication that the longer-term downtrend is in its final stages. Overall, the moving averages show a bright picture as there is strong momentum and the breakout over the Bollinger Bands’ mid-line potentially shows the bottom is in.
Indicator Analysis
The MACD line is a healthy margin above the signal line and in fact, the histogram shows that gap is continuing to widen. The bullish crossover occurred in late 2023 and the stock surged since that signal. In addition, while the stock is at around the same level as the 2022 and 2023 peaks, the MACD is significantly stronger than in those periods. This shows that this time, the stock has more momentum and has the potential to run much higher. It is a similar story for the RSI. It has recorded its highest reading since 2016, showing just how much momentum AT&T stock has had. Lastly, for the stochastics, the %K just dipped below that %D very recently, flashing a bearish signal. However, both lines have been relatively flat after the crossover, potentially voiding that signal. The stochastics also shows that the recent run is different than those in 2022 and 2023 as its peak eclipses those seen in those periods. Overall, I believe the main message here is that all three of the key indicators show that this bull run is strong and could be much more sustainable than the bear rallies in 2022 and 2023.
Takeaway
The monthly analysis shows a bit of a more mixed picture. The charts show that there is significant resistance above, particularly for longer-term investors, while the moving averages show increasing upward momentum. The Bollinger Bands also signals that the bottom may be in for AT&T in the longer run. Lastly, the indicators show that bullish momentum is significantly higher than in previous bear rallies, showing this run could be more sustainable. I believe the longer-term outlook is still net positive, but investors should keep an eye out for potential resistance.
Fundamentals & Valuation
The next earnings report for AT&T is scheduled for release on Oct 23. In their latest earnings report for Q2, they reported revenues of $29.8 billion, down 0.4% YoY from $29.9 billion. On the brighter side, they did report an increase in total service revenues and growth in mobility service and broadband revenues. They also reported an adjusted EPS of $0.57, down 9.5% YoY from $0.63. The highlight of their earnings could be the FCF figure as they post $4.6 billion, up 8.7% from the year ago period. In terms of operational highlights, they had a 593,000 total net adds for the U.S. Postpaid segment and 239,000 net adds in the AT&T Fiber segment. Currently, AT&T has a 5.23% dividend yield, which is good, but the five-year growth rate is at -6.35%.
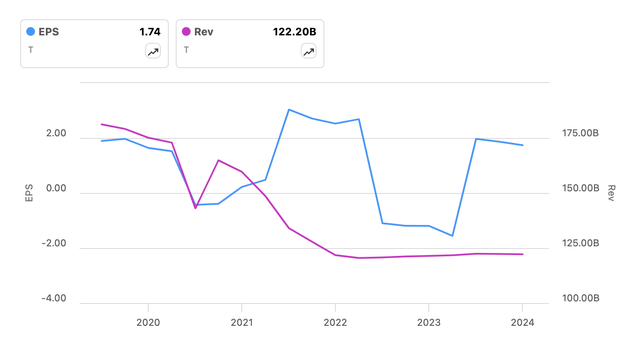
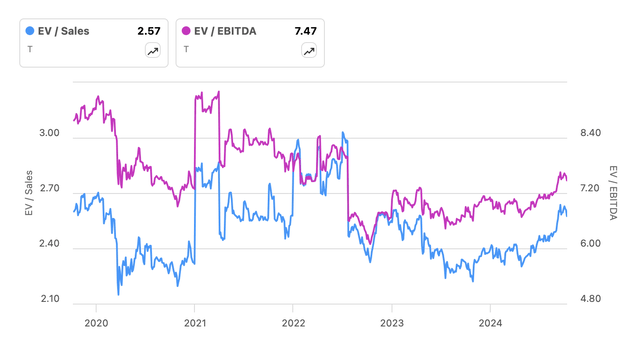
The EV/S and EV/EBITDA ratios have rebounded from the lows seen in 2023, but they remain significantly below five-year highs. The EV/S ratio is currently at around 2.5, much lower than the levels of around 3.0 set in 2022, while the EV/EBITDA is currently at around 7.5, down significantly from levels of over 9 seen in 2021. As shown in the revenue and EPS chart above, in 2021 AT&T had a major collapse in revenue while in 2022, there was a collapse in EPS. Currently, both AT&T’s revenue and EPS have steadied since that decline. AT&T’s EV/S ratio is at around the same level as in 2021 when its revenue was collapsing and showing negative growth, while its EV/EBITDA is at lower levels than in 2022 when its EPS was falling off a cliff. Therefore, I believe with the stabilization of both revenue and EPS that is currently occurring, AT&T is undervalued. In my view, AT&T should experience multiple expansion as investors should find comfort in the stabilization in their financial results. Seeking Alpha has a B+ valuation rating on AT&T and confirms my evaluation that the stock is undervalued.
Conclusion
AT&T stock is dynamite waiting to explode. The technicals confirm that its stock is currently in an overbought correction but make no mistake, the uptrend is gaining momentum, especially in the near and intermediate terms. The stock is undergoing a healthy pullback and consolidation before likely moving higher again. As for the longer term, while there seems to be some overhead resistance, the Bollinger Bands signal that the longer-term bottom may be in and key indicators show that the current rally is likely to be much more than a bear rally. Lastly, as discussed above, the fundamentals show that AT&T is currently undervalued as the stabilization of its earnings results should help it command higher valuation multiples. From my analysis, I conclude that AT&T stock deserves a buy rating.
Analyst’s Disclosure: I/we have no stock, option or similar derivative position in any of the companies mentioned, and no plans to initiate any such positions within the next 72 hours. I wrote this article myself, and it expresses my own opinions. I am not receiving compensation for it (other than from Seeking Alpha). I have no business relationship with any company whose stock is mentioned in this article.
Seeking Alpha’s Disclosure: Past performance is no guarantee of future results. No recommendation or advice is being given as to whether any investment is suitable for a particular investor. Any views or opinions expressed above may not reflect those of Seeking Alpha as a whole. Seeking Alpha is not a licensed securities dealer, broker or US investment adviser or investment bank. Our analysts are third party authors that include both professional investors and individual investors who may not be licensed or certified by any institute or regulatory body.

