Summary:
- AT&T’s stock experienced a 4% decrease following the announcement of an exclusive wireless plan collaboration between Amazon and DISH Network.
- The deal between DISH and Amazon could have significant implications for AT&T’s future earnings and drive down telecom prices in the United States.
- Despite challenges, AT&T has a 7% dividend yield and a 15% free cash flow yield, making it an appealing choice for investors.
- As such, we currently rate AT&T as a buy.
Brandon Bell
Introduction
AT&T Inc. (NYSE:T), a major American telecommunications powerhouse, provides a wide range of services, from wireless communications to internet and telephone services. Renowned for its nationwide 5G coverage and high-speed fiber internet, AT&T is a significant player in the industry.
However, a recent collaboration between Amazon (AMZN) and DISH Network (DISH), unveiling an exclusive $25 per month unlimited wireless plan for Amazon Prime members, had a tangible impact on AT&T’s stock.
The aftermath was evident as AT&T’s stock experienced a 4% decrease on the first trading day following the announcement – a decline not unique to AT&T but part of a broader market sell-off.
If you are unfamiliar with what happened, here is a brief overview: Amazon wanted to include free phone services for their Prime members and were in talks with various companies. This included AT&T, Verizon (VZ), and DISH. In the end, DISH ended up partnering with Amazon.
The implications of the Amazon-DISH Network partnership extend beyond the immediate stock fluctuation for AT&T. The deal can potentially drive down telecom prices in the United States, likely contributing to the observed drop in AT&T’s stock value. Given that the telecom industry is very interconnected regarding products and prices, the deal between DISH and Amazon could have big implications for AT&T’s future earnings.
Ycharts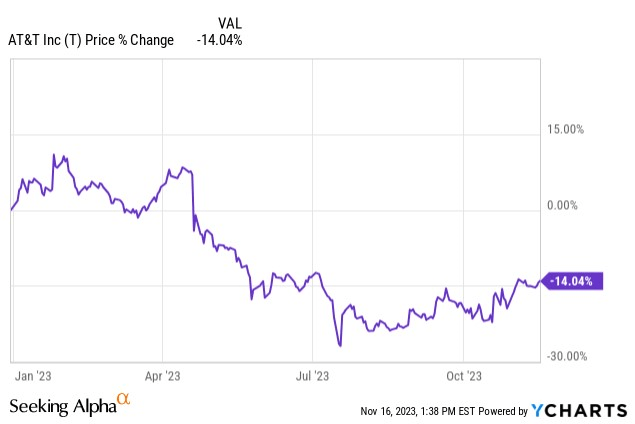
The market has overlooked AT&T recently, leading to a 14% YTD decline, which might appear excessive. Moreover, the stock has witnessed a substantial 46% drop from its peak in November 2018.
Despite these challenges, AT&T stands out with a 7% dividend yield and an enticing 15% free cash flow (FCF) yield, making it an appealing choice for investors.
Ycharts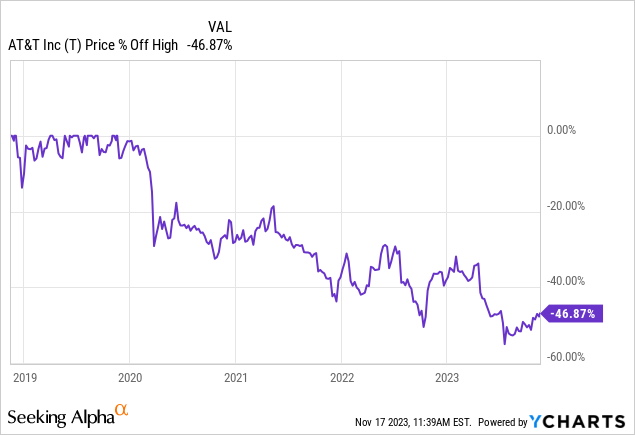
In this article, we will talk about AT&T’s most recent earnings and its historical financials. In addition, we’ll explore strategies for maximizing income from your T shares if you’re already part of the club.
Historical Financials
To begin with, we want to give you an overview of AT&T’s historical financials, which may explain why the market seems to have ditched this stock.
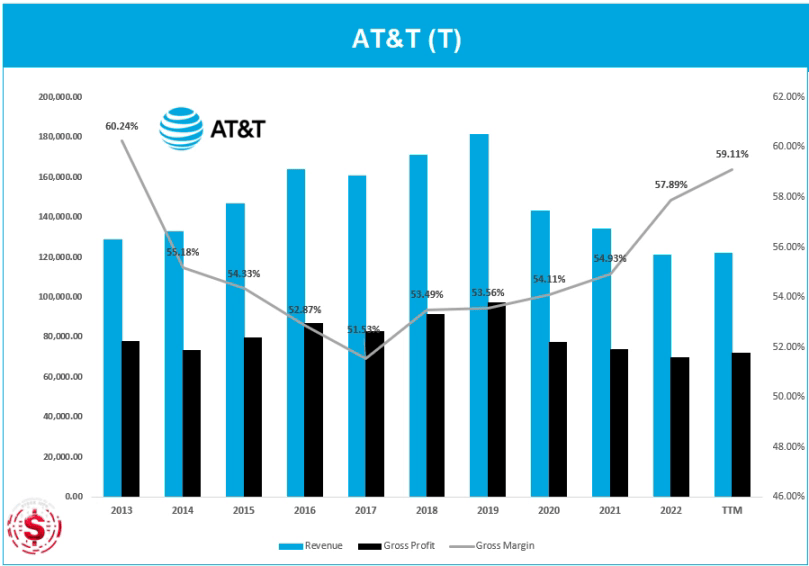
First of all, looking at the evolution of both revenue and gross profits, it’s evident they have had a difficult time retaining the success of 2019 in 2020-2022. Their profits have fallen significantly from almost $169B to nearly $121B between 2021 and 2022.
Such a drop in revenue is usually a relatively big warning sign. However, this is mainly due to the separation of AT&T’s US pay-TV businesses in the third quarter of 2021. This has improved their gross profit margin substantially since then, and we are hopefully in for a continuation for Q4 2023, and into 2024. We see this as a positive for AT&T’s business, at least on the top line of their operations.
If we look at different metrics based on AT&T’s income statement, we have put in some thresholds that we determine to be good (green), satisfactory (yellow), and bad (red).
The main takeaway is that in the past five years, AT&T has had a decent top-line margin, staying well above 50% over the period included. Things become a little uglier once we dive deeper. AT&T has a very high selling general & admin expenses (SG&A) margin. This metric includes all everyday operating expenses or running a business that are not included in the production of goods or delivery of services, for example, rent, advertising, salaries, etc.
This metric is far too high compared to the 30% we consider “acceptable” for a business like AT&T. In addition, their depreciation margin has been, and continues to be, far too high for their good, although it has come down in the past two years.
Stock Info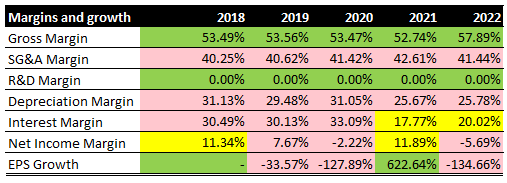
Furthermore, their interest margin has reached a satisfactory level. However, it has been substantial in the past. AT&T also recorded a negative net income margin twice in 2020 and 2022. While 2020 may be self-explanatory, as COVID-19 and the corresponding restrictions caused hardship for many companies. However, a negative net income in 2022 is a little head-scratching, especially after a relatively strong year in 2021.
The explanation for the net loss in 2022 lies in a number of reasons. For one, there was an increase in bad debt expenses. Eliminating Connect America Fund Phase II (CAF II) government credits also contributed to the negative net income.
If you are not familiar with CAF II, it is essentially a government fund that grants telecom companies a sum of money so that they can expand their coverage and services to rural America – AT&T did not receive anything from this fund in 2022.
In addition, the decrease in interest expense in 2022 was primarily due to lower debt balances and higher capitalized interest associated with spectrum acquisitions, partially offset by higher interest rates. Although the decrease was expected by management, the market has not been overly impressed.
To finish the income statement, we want to point out that AT&T’s EPS growth has been abysmal in the past couple of years. You don’t want to see these inconsistencies when you pick stocks for your long-term portfolio, but as we will see later, there are things to like.
Looking briefly at some metrics based on AT&T’s balance sheet, we again see unfavorable measures. The main point is that AT&T has built up a lot of debt relative to their equity, as seen from the adjusted debt-to-equity ratio.
Although we are talking about a company with a $113B market cap that probably can handle this level of debt it is necessary to see some improvement.
In addition, AT&T has heavily declining retained earnings, which can be good and bad. It could be viewed as favorable since it can mean the company has used much of its built-up earnings to pay dividends.
Unfortunately, this is not true for AT&T, as their dividend has decreased in the past two years.
Stock Info
Finally, AT&T’s free cash flow was on a steady uptrend until it was halved between 2021 and 2022, primarily due to the spin-off we discussed earlier.
In addition to many of our other dissatisfactions about their historical metrics, AT&T has a very high CapEx margin, calculated relative to their net income.
Stock Info
Looking at how the company has grown, we know that the spinoff is a big reason for the revenue fall, operating cash flow, and FCF. When arguing for the inclusion of this stock into your long-term dividend portfolio, seeing a 5-year dividend CAGR of -5.30% is not what you want to see.
Stock Info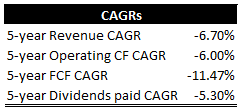
Although the numbers paint a bleak picture of AT&T, we will highlight the positives in the following sections and why now might be a good time to add or start a position in your long-term portfolio.
Q3 Earnings: Future Looking Bright?
AT&T’s most recent earnings are proving to be what we need to see from them. The company has added over half a million net users to its 5G network product. They have a $55.99 phone average revenue per unit (ARPU), up 0.6 percent compared to the same quarter last year.
AT&T Q3 earnings report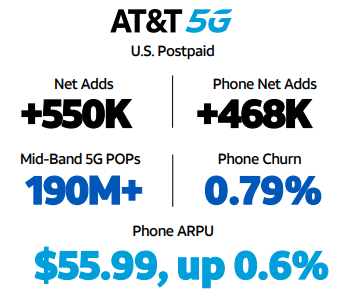
In addition, and this is where they truly shined, they added 8 million subscribers to their fiber network and 296 thousand net. Their fiber segment currently has an ARPU of $68.21, up 8.9% compared to the same quarter last year.
AT&T Q3 earnings report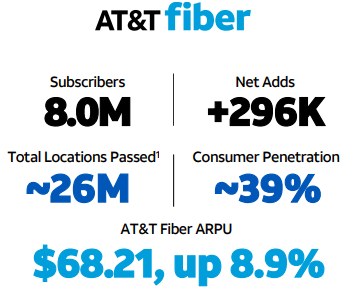
This has visibly affected their revenues and EBITDA, as seen in the table below. For all the trouble AT&T has been through the last couple of years, it’s encouraging to see their year-over-year FCF rose significantly from Q3 2022 to Q3 2023.
AT&T Q3 earnings report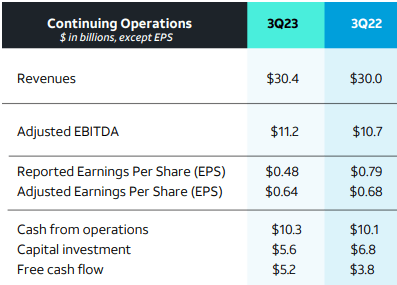
AT&T’s broadband business has been on a roll, significantly boosting its free cash flow in the third quarter. The telecom giant reported a free cash flow of $5.2 billion in Q3’23, a substantial increase from $4.2 billion last quarter. This impressive figure for Q3’23 includes a payment of $0.9 billion to DIRECTV.
So far this year, AT&T’s free cash flow has reached $10.4 billion. Comparatively, the company generated $8.0 billion in free cash flow in the same period last year. This means AT&T has generated an additional $2.4 billion in total free cash flow year-to-date compared to last year.
This improvement in free cash flow has significant implications for AT&T’s dividend stability and coverage ratio. Simply put, the company’s dividend is much better protected than at the start of the year.
Looking Ahead and Valuation
When buying AT&T, you are not just buying a company with a rather attractive dividend yield profile and solid position in the market. You are also buying a company with a very good FCF yield at over 15% based on FY2023 earnings.
When combining a stock that trades at a 7% dividend yield and a 15% FCF yield, you see the attractiveness of adding AT&T to your long-term retirement portfolio.
Stock info with OpenBB
In addition, the market expects AT&T’s EPS to rise steadily to $2.50 by 2027, in which FCF per share and dividends per share remain relatively unchanged. As for the expected dividend yield, the market is currently pricing in a relatively steady growth from 7.12% by the end of 2023 to 7.65% in 2027.
We are not saying that we know anything the market does not. Nonetheless, the market does not believe that AT&T is going anywhere. However, as we saw from their FY2022 topline and the betterments in their Q3 2023 earnings, we believe there could be a slight mismatch in T’s stock price.
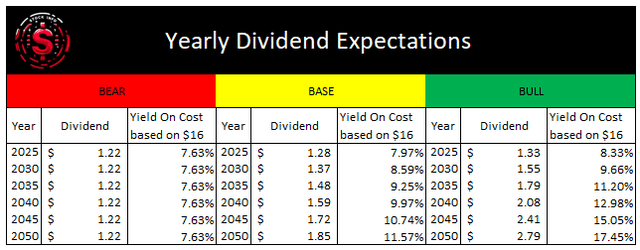
We also attempt to model dividend yields, and our calculations, assuming a stock price of $16, show a dividend yield closer to 8% by 2025 in our base case.
In each of the three scenarios, we assume different dividend growth rates, with 0% in the bear case, 1.5% in the base case, and 3% in the bull case. These assumptions are based on previous dividend growth we have seen for AT&T through time.
As mentioned, AT&T has been lowering its dividend payouts due to relatively poor performance. However, there is a real possibility that this could start going another way, and we see a more aggressive dividend policy from the company.
Compounding On Steroids
As income investors, we all appreciate the compounding effect of reinvesting dividends. But what if I told you there’s a way to generate even more income using options? This is where covered calls come into play, but that’s not all. We’ll also discuss cash-secured puts.
Together, these two strategies form a short strangle. We want to clarify that you don’t need to be a dividend investor for this strategy to work. It is an excellent tool for anyone who wishes to generate additional income from their shareholdings.
A short strangle is typically used to capitalize on a stock trading within a specific range over a certain period. In this case, it’s a strategy for income-seeking investors to generate additional income while holding shares.
Imagine you’re comfortable buying 100 shares of AT&T at $15 per share on January 19th, 2024. At the time of writing, this cash-secured put would yield $0.75 per share or $75 in total, as each option contract in the US market has an underlying 100 shares. Alongside the cash-secured put, we also write a covered call. Suppose we’re okay with selling 100 AT&T shares at $18 per share. Setting the same expiration date (January 19th, 2024) would yield around $0.90 or $90.
We would have collected an additional $165 on top of the dividends. This is based on a 100-share example. If you own 1000 shares of T, you could apply this strategy five times, thereby collecting $1,650.
Assuming you can apply this options strategy a little over five times a year while keeping the expiration date of the options you write eight weeks out, you could generate an additional $825 in income per 100 shares each year.
Combined with the expected $1.11 dividend for this year, this would yield $9.36 per share. Not too bad at all. Remember that these premiums will not always be as high as now. The January 19th contracts seem to have increased quite a bit on the last trading day of this previous week. Thus, the dollars per share mentioned here might be unrealistic in the long run. However, the point still stands.
This strategy is flexible and can be adjusted according to your needs. For instance, if you think the share price of AT&T is too high, you can sell more covered calls. On the other hand, you can sell more cash-secured puts if you believe T shares are undervalued. Currently, the stock is relatively low compared to its historical price range.
Remember, you don’t have to hold these contracts until expiration; you can manage them as you see fit. Be sure to roll the contracts in time if you don’t want to let go of 100 shares or buy an additional 100 due to a change in fundamentals.
It is important to be careful when writing options covering your holdings since black swan events can make this messy fast. In addition, be sure you pick strike prices that aren’t too close to the current stock price. If market sentiment for AT&T suddenly becomes overly optimistic, the stock can increase significantly, and you will be forced to sell at a significantly lower price.
Conclusion
In summary, AT&T faces challenges with a 14% YTD decline and a considerable drop from its 2018 peak. Despite revenue fluctuations due to the separation of its US pay-TV businesses, recent earnings show promise.
User additions to its 5G and fiber networks have boosted free cash flow to $10.4 billion YTD, strengthening dividend stability and setting the stage for a potential rebound.
Looking forward, AT&T’s projected EPS rise and the market’s expectation of consistent dividend yield growth hint at undervaluation. To increase your returns from AT&T shares, strategic moves like covered calls and cash-secured puts offer income opportunities amid ongoing transformations and shifting market sentiment.
AT&T remains an attractive stock for your long-term portfolio with a solid 7% dividend yield and an enticing 15% FCF yield. Hence, we rate AT&T a buy at its current price.
Analyst’s Disclosure: I/we have no stock, option or similar derivative position in any of the companies mentioned, but may initiate a beneficial Long position through a purchase of the stock, or the purchase of call options or similar derivatives in T over the next 72 hours. I wrote this article myself, and it expresses my own opinions. I am not receiving compensation for it (other than from Seeking Alpha). I have no business relationship with any company whose stock is mentioned in this article.
Seeking Alpha’s Disclosure: Past performance is no guarantee of future results. No recommendation or advice is being given as to whether any investment is suitable for a particular investor. Any views or opinions expressed above may not reflect those of Seeking Alpha as a whole. Seeking Alpha is not a licensed securities dealer, broker or US investment adviser or investment bank. Our analysts are third party authors that include both professional investors and individual investors who may not be licensed or certified by any institute or regulatory body.

