Summary:
- AT&T’s 7.3% dividend yield is deemed safe with a low probability of being revised downwards, making it attractive for dividend-seeking investors.
- The company faces stagnant EBITDA growth and increased competition from Verizon, T-Mobile, and Amazon, limiting its potential for price appreciation.
- AT&T should be viewed as a pure dividend income stock with limited capital appreciation potential, and there may be better alternatives for investors seeking similar yields with more favorable growth outlooks.
energyy
Recently, there has been a lot of chatter around AT&T Inc. (NYSE:T) dividend driven by the consistently plummeting share price and narrowing margin of safety due to poor dividend coverage.
In the trailing three year period, T has diverged from the S&P 500 drastically. The spread in price performance stands at ~73%. Granted, if we factor in the dividends, then on a total return basis, the picture becomes a bit better (yet, still rather negative – i.e., 61% spread).
As a result of share price correction, the valuation has reached its 5-year historical low. Currently, T trades at a TTM P/E of 5.9x implying a discount of 28% relative to the 5-year historical average. On a forward looking basis, the multiple is at a very similar discount – i.e., 27%.
At the same time, the consensus estimate for T’s dividends remains stable indicating an average yield of 7.3%.
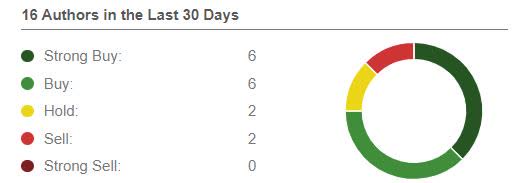
Furthermore, it seems that there is still a positive consensus among Seeking Alpha analysts to be long T.
Seeking Alpha
Now, considering this backdrop I think it is fair to state that there is a disconnect between what the market thinks and what majority of T’s analysts have factored into their thinking on the Company’s future performance. The same thing, clearly, applies to the dividend. Namely, if T decided to revisit its dividend policy, the odds are high that a negative share price reaction would follow.
The objective of this article
Given the above, I think that there would be a merit to take a look on the dividend coverage purely from the fundamental (analysis) perspective. So, my focus is on T’s dividend and assessing whether the Company has sufficient cash generation and right capital structure to accommodate the future distributions.
The overall goal is to take a look at some of the most important drivers of sustainable dividends and really understand where there could be a mismatch between the expectations of the market and the majority of Seeking Alpha analysts.
Stagnant FCF, yet relatively healthy dividend coverage
It is not a secret that T since 2018 has been delivering subpar results. Looking at the topline, the 5-year CAGR stands at -5.3% despite significant investments in the 5G space and some notable acquisitions. On the EBITDA level, there is also a negative rate of change, yet not that poor given T’s success on the cost optimizations.
However, in the more recent period, T has struggled even more, registering a negative 3-year CAGR in EBITDA of ~6%.
Optically, the past 5 quarters do not provide any reason to be optimistic. T has channeled ~60% of it EBITDA into massive CapEx program to maintain its competitive position and expand into the 5G (& IoT) space. While there are some positive movements to observe in the quarterly EBITDA figures, other items, which constitute FCF metric offset that. So, just by looking at these consolidated financials, I do not see that T has managed to revert back to a growth territory.
Here, many bears have referred to the unacceptable dividend coverage for Q1, 2023. T distributes ~$2 billion in quarterly dividends, which compared to the Q1, 2023 FCF results in a 200.6% payout ratio. Clearly, unsustainable.
Nevertheless, if we sum together the FCF generated over the past four quarters, and divide this with the annualized dividend payment (based on the most recent distribution level), the payout ratio is relatively healthy- at ~65%. This is a more correct approach to calculate the dividend coverage because it adjusts for timing effects primarily on the working capital and CapEx.
Headwinds for FCF, but not that material
Assuming that T manages to protect its cash generation on the EBITDA level, there still will be some challenges stemming from the surging interest expense.
As of Q1, 2023, T carried close to $137.5 billion of interest bearing debt that translated to a quarterly interest expense of $1.7 billion. However, this expense item is set to increase.
AT&T Intellectual Property
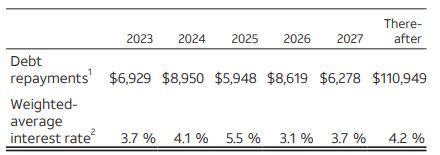
In the next three year period, T will have to refinance from ~ $6 to $9 billion of debt on an annual basis. The table above highlights the relevant cost of financing levels for each portion of the maturing debt.
While it depends on the maturity, embedded optionality and other financing specific factors, the prevailing average cost of financing for T’s bonds stands at 5.8%.
This means that each incremental financing (freshly attracted to fund CapEx or rollover maturing portions of debt) will be subject to more unfavourable financing levels, that, in turn, will inflict damage on the FCF.
On average we are talking about ~ 200 basis points of spread in cost of financing that will be associated with refinancings in 2023-2025 period.
If we model a scenario in which T rolls over all of the maturing debt until 2025 at the prevailing interest rate level, the quarterly interest expense component would increase by roughly $110 million (or by 6% compared the most recent quarterly figure).
The impact is insignificant and pose no elevated treat on T’s ability to cover future dividends.
In fact, an assumption of full refinancing is incorrect since T has clearly articulated its strategy to deleverage. In 2022 alone, T repaid close to $25 billion of debt. In future I do not expect T to make so aggressive repayments, but I would be confident in stating that a notable chunk of the maturing debt will be covered with remaining FCF after dividend payments.
By applying the same logic on TTM dividend vs FCF calculus, T manages to retain ~ $4.2 billion in cash after servicing the preferred and common stock holders. Again, it would be safe to assume that a significant chunk of these proceeds will be allocated towards debt reduction activities, which will help offset the headwinds on the interest expense front.
Finally, early in 2022, T communicated that it will trim down on the CapEx starting from 2024. The CapEx 2024 guidance was set at $20 billion, which is ~$4 billion less compared to the 2023 guidance.
It is hard to judge whether this guidance will materialize given the inflationary dynamics, but we should feel confident that there will be a decline in the CapEx spend.
So, assuming constant cash generation (based on Q1, 2023 and Q4, 2022 results) but with an adjusted CapEx to $5.25 billion and normalized working capital level, the FCF payout ratio lands at a very healthy level of 41%.
In closing
For dividend-seeking investors T provides attractive conditions, where 7.3% yield can be deemed safe with very limited probability of being revised downwards.
However, I am skeptical on T’s potential to deliver abnormal returns via price appreciation going forward. Below are some of the considerations:
- Stagnant EBITDA despite some growth in the topline and massive CapEx spend.
- Retained cash flows redirected towards balance sheet optimization rather than accretive M&A or future growth.
- Intensified competition through bold investment programs carried out by closest peers – Verizon Communications Inc. (VZ) and T-Mobile US, Inc. (TMUS).
- An additional competitor with strong competitive position and balance sheet entering the mobile service space – Amazon.com, Inc. (AMZN).
In my humble opinion, T should be viewed as pure dividend income stock with no notable capital appreciation potential. While the dividend is safe, there are better alternatives for dividend-seeking investors to capture similar yield, yet with more favourable growth outlook.
Analyst’s Disclosure: I/we have no stock, option or similar derivative position in any of the companies mentioned, and no plans to initiate any such positions within the next 72 hours. I wrote this article myself, and it expresses my own opinions. I am not receiving compensation for it (other than from Seeking Alpha). I have no business relationship with any company whose stock is mentioned in this article.
Seeking Alpha’s Disclosure: Past performance is no guarantee of future results. No recommendation or advice is being given as to whether any investment is suitable for a particular investor. Any views or opinions expressed above may not reflect those of Seeking Alpha as a whole. Seeking Alpha is not a licensed securities dealer, broker or US investment adviser or investment bank. Our analysts are third party authors that include both professional investors and individual investors who may not be licensed or certified by any institute or regulatory body.


