Summary:
- Investors were left in utter disbelief as AT&T’s latest earnings release revealed a free cash flow of $1B, a staggering $1.5B below its previously projected estimates.
- Despite management’s reassurance that AT&T’s full-year free cash flow outlook would reach a minimum of $16B, the market remained skeptical, battering T with a more than 10% sell-off.
- The jaw-dropping decline in T has significantly improved its valuation and is now edging closer to our preferred buy levels, but still not quite.
Brandon Bell
We updated investors in our previous update in March that AT&T Inc. (NYSE:T) stock wasn’t “cheap enough,” even though buyers attempted to lift its recovery higher. We also reminded investors that “buying a piece of T is only attractive at the right valuation. And now’s not the time.”
Yesterday’s (April 20) 10% selloff likely sent these buyers sprawling for cover, as management delivered a shocking miss in its free cash flow or FCF. Accordingly, AT&T posted an FCF of just $1B, against previous estimates of $2.5B.
However, management attempted to assure investors it has not changed its full-year FCF outlook for FY23, maintaining it at $16B. As a result, it suggests that AT&T needs to post an average of $5B in FCF over the next three quarters to meet its outlook.
We believe the significant markdown in its stock yesterday reflected inherently higher execution risks, spooking investors worried about its history of poor capital allocation decisions.
While the company highlighted that the timing of working capital changes and higher capital spending in Q1 is not expected to be repeated every quarter, investors are likely not convinced.
We expect Wall Street analysts’ estimates to be revised downward to reflect its execution challenges amid a more challenging macroeconomic environment.
Management highlighted its notable achievements in Q1, including low churn, still strong postpaid phone subscribers of 424K, and additions of 272K fiber subscribers.
Moreover, the company posted its “best-ever first quarter” in operating income for its mobility segment, as revenue increased by 5.2%.
As such, the $6B in corporate operating income didn’t look as bad as yesterday’s selloff suggested, nearly 10% higher than in FQ1’22.
Moreover, management accentuated that its capital spending of $6.4B in Q1 will likely be lower in the following quarters.
As such, investors should expect much improved FCF metrics moving forward, as management articulated that the impact on its FCF from “the timing of capital investments, device payments, and incentive compensation peaked in the first quarter.”
Based on our blended fair value estimate of about $21.3, the current levels have an implied upside of more than 20%, better than the previous levels in March.
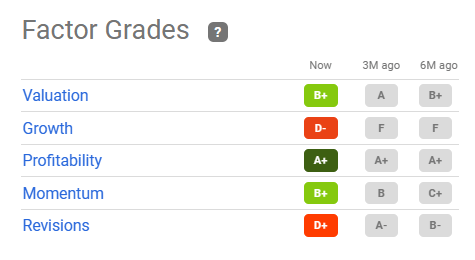
T quant factor ratings (Seeking Alpha)
Seeking Alpha Quant ratings suggest that T’s valuation isn’t aggressive, as it’s given a B+ grade.
Morningstar kept its fair value estimate of $25, suggesting that T’s valuation is likely reasonable. We also gleaned that its NTM EBITDA multiple of 6.8x aligns with its 10Y average and is below its peers’ median of 7x (according to S&P Cap IQ data).
As such, we parsed that T’s valuation has moved closer to our buy levels, considering that we will need at least a 25% discount to its blended fair value estimate, given its execution risks and narrow economic moat.
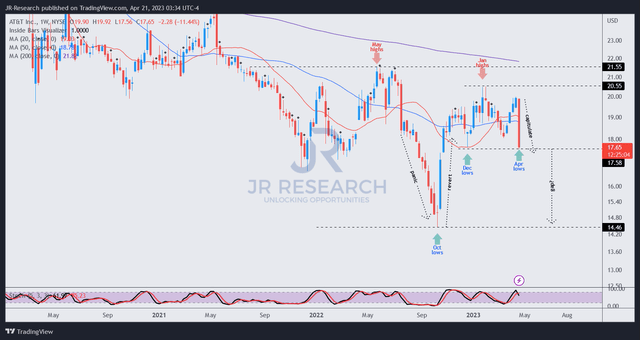
T price chart (weekly) (TradingView)
T’s price action suggests that the capitulation move started yesterday, as it closes in against its March lows, re-testing the conviction of buyers who bought the dips then.
A successful re-test to take out the dip buyers will be constructive, as market operators use AT&T’s FCF malaise to squeeze out bottom-fishers who bought in March.
However, T’s valuation is still slightly off our preferred buy zone, requiring at least a 25% discount from its $21 level, suggesting a maximum buy level of $16.
Moreover, there was a momentum surge from its previous mean-reversion from its October lows that needs to be digested. Hence, a failure to hold March levels could see T sellers forcing buyers to sell further in a panic to close that gap toward its October lows before a more constructive bottoming process is found.
As such, while T’s valuation has improved markedly from late March, it’s still not within our preferred buy zone for a favorable risk/reward profile from the valuation and price action perspective.
Rating: Hold (Reiterated).
Important note: Investors are reminded to do their own due diligence and not rely on the information provided as financial advice. The rating is also not intended to time a specific entry/exit at the point of writing unless otherwise specified.
We Want To Hear From You
Have additional commentary to improve our thesis? Spotted a critical gap in our thesis? Saw something important that we didn’t? Agree or disagree? Comment below and let us know why, and help everyone in the community to learn better!
Analyst’s Disclosure: I/we have no stock, option or similar derivative position in any of the companies mentioned, and no plans to initiate any such positions within the next 72 hours. I wrote this article myself, and it expresses my own opinions. I am not receiving compensation for it (other than from Seeking Alpha). I have no business relationship with any company whose stock is mentioned in this article.
Seeking Alpha’s Disclosure: Past performance is no guarantee of future results. No recommendation or advice is being given as to whether any investment is suitable for a particular investor. Any views or opinions expressed above may not reflect those of Seeking Alpha as a whole. Seeking Alpha is not a licensed securities dealer, broker or US investment adviser or investment bank. Our analysts are third party authors that include both professional investors and individual investors who may not be licensed or certified by any institute or regulatory body.
A Unique Price Action-based Growth Investing Service
- We believe price action is a leading indicator.
- We called the TSLA top in late 2021.
- We then picked TSLA’s bottom in December 2022.
- We updated members that the NASDAQ had long-term bearish price action signals in November 2021.
- We told members that the S&P 500 likely bottomed in October 2022.
- Members navigated the turning points of the market confidently in our service.
- Members tuned out the noise in the financial media and focused on what really matters: Price Action.
Sign up now for a Risk-Free 14-Day free trial!

