Summary:
- In July, I wrote in an article that I was waiting for AT&T’s dead cat bounce to sell my current holding.
- In this article, I want to give a brief update and look at the upcoming Q3 numbers that the company will release on October 19.
- AT&T has shown some strength compared to the market in the last three months, indicating a possible recovery rally.
- In the medium term, I still see significant upside potential fed by fundamental valuation and the associated price recovery (the dead cat bounce).
Justin Sullivan
In July, I wrote in an analysis that I was waiting for AT&T’s (NYSE:T) dead cat bounce to sell my current holding. In this article, I want to briefly update my readers and look at the upcoming Q3 numbers the company will release on October 19 before the stock markets open.
Regarding my existing AT&T holding, I can let the cat out of the bag quickly: I haven’t sold my AT&T yet because (we’ll stick with the cat) there hasn’t been a dead cat bounce yet. Therefore, the shares remain dormant in my portfolio as underperformers, and I continue collecting the dividends.
To give you a quick overall heads-up, my investment thesis before the quarterly figures is outlined below:
I do not expect any nasty surprises before/with the quarterly figures. Instead, the market has already priced in all possible known potential downers. For long-term investors, I still don’t see any real reason to buy the stock right now since there is hardly any long-term fantasy for above-average returns for AT&T that could justify a stock purchase. Besides that, there’s also no point in hoping for a positive earnings surprise to lift the stock for quick gains, as AT&T’s business is relatively static and hardly allows surprises.
Still, AT&T stock gets a Buy rating for investors with a mid-term investment horizon. I believe that the stock is a mid-term bet with an upside potential mainly driven by fundamental valuation and a possible price recovery (the dead cat bounce) based on a reasonable risk/reward ratio. Of course, I cannot predict when this upside potential will materialize. Currently, however, we see a certain share price strength compared to the market. So it could be that AT&T stock has found its bottom and will start a recovery rally in the coming months.
Peer comparison
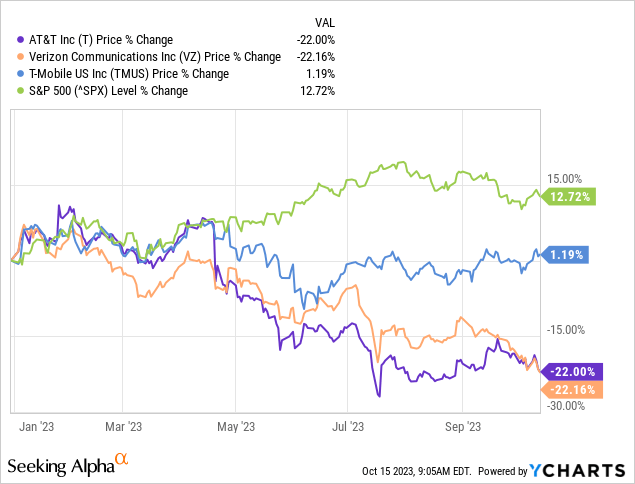
AT&T’s performance was clearly underwhelming year to date, as it has been over the long term. Like its competitor Verizon (VZ), AT&T showed a performance of minus 22 percent this year. T-Mobile US (TMUS) is doing much better. However, all three stocks have underperformed compared with the S&P 500 (SPY).
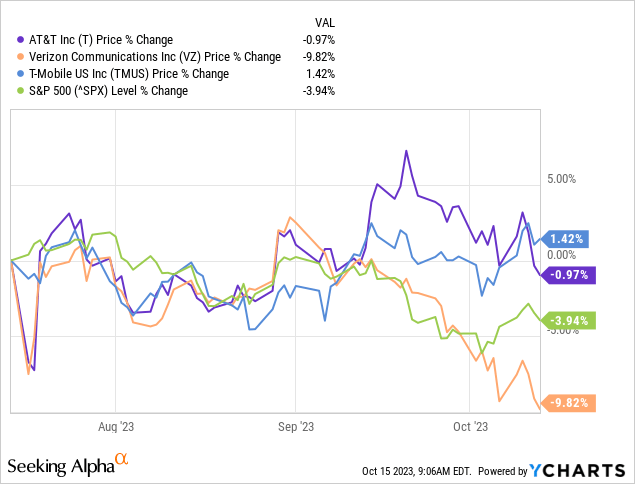
In the last three months, however, the picture has changed somewhat. Interestingly, AT&T and T-Mobile US have shown some strength in tandem, while the S&P 500 has fallen by almost 4 percent. Conversely, Verizon has decoupled and is trading 10 percent lower than three months ago. At least in this very short-term view, my decision in the summer not to sell AT&T was correct.
Balance sheet discussion
The debt problem is a nagging issue at AT&T. That something has changed for the better due to the spinoff of Warner Bros. Discovery (WBD) is unfortunately not the case.
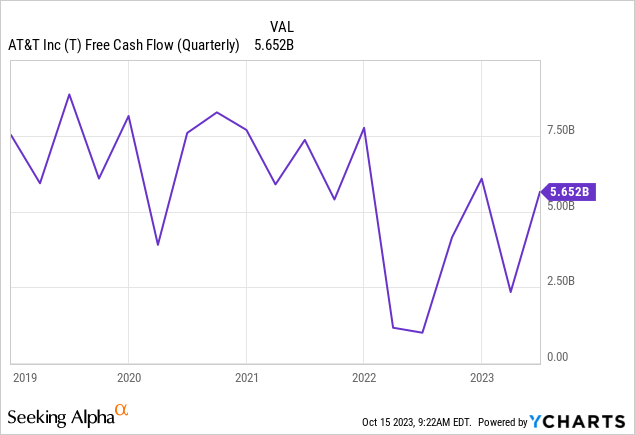
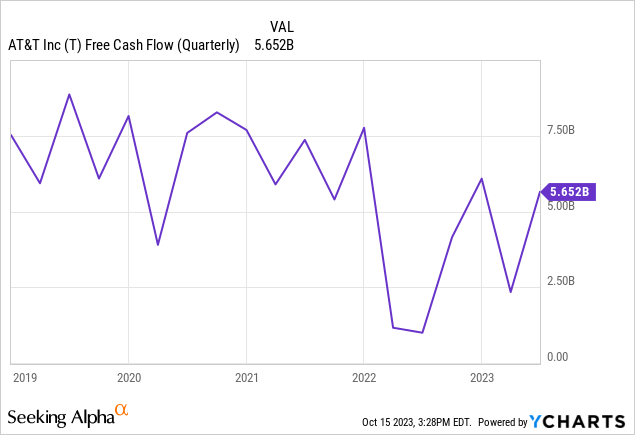
At the end of fiscal 2021, total debt was $175 billion, reduced to slightly below $136 billion by the end of 2022. The spinoff played a significant role, as Warner Bros. took on some of AT&T’s massive debt and paid AT&T $40.4 billion in cash. However, in the first six months of the current fiscal year, total debt increased again to $142.280 billion, although at the same time, there was an improvement in the FCF, which increased to $5.65 billion in Q2 2023.
In the Q2 earnings call, CFO Pascal Desroches explained why debt rose sharply in Q2 and referred to onetime effects:
The short answer is that, we had approximately $4 billion of onetime items and discrete obligations to payoff. These included our WarnerMedia post-closing adjustment payment, our final NFL Sunday Ticket payment and redeeming in full the $8 billion preferred interest in our Mobility to subsidiary. We partly funded this with $7 billion of issuances for other preferred subsidiary shares. Additionally, net debt reflects about $1.5 billion of mark to market impacts from foreign exchange.
In that respect, it will be interesting to see if there was an improvement in the current quarter, as AT&T aims to reduce net debt to adjusted EBITDA to about 2.5 by the end of 2025.
How were AT&T’s previous earnings?
The latest Q2 earnings provided few surprises. Revenue was up 0.9 percent compared to Q2 2022, and alongside that, AT&T posted non-GAAP EPS of $0.63. As expected, FCF had improved compared to Q1 2023. While it was $1 billion FCF in Q1 2023, AT&T generated over $4.2 billion in Q2, which was $400 million or more than 10 percent above analyst estimates. However, to reach the FY2023 target of $16 billion FCF, AT&T will have to stretch quite a bit to reach the remaining $11 billion in Q3 and Q4. Therefore, besides the progress in paying down debt situation, FCF will be a key metric that investors will look at in the Q3 figures.
Risks elaboration
In my view, the most significant risks at AT&T are the as yet incalculable consequences of the lead-covered copper cables that AT&T and Verizon laid in the ground all over the USA decades ago. However, there has been some calm since the summer. At the moment, I believe that the uncertainties are primarily priced in. As long as there is no news on this (possible investigations by authorities, claims for damages, etc.), this point should continue to weigh on the share but not pull it down significantly. Conversely, this is still an incalculable risk, and investors should be aware of the potentially devastating consequences. Bayer (OTCPK:BAYZF) or 3M (MMM) have shown how much litigation can determine share price performance.
Another risk is the rise in interest rates, which could make it increasingly difficult for AT&T to finance its capital-intensive business. For example, interest expenses were $6.2 billion in 2022. The numbers are expected to continue to rise for 2023. For example, interest expenses were $3.3 billion in the first half (1HY 2022: $3.128 billion). The decisive factor will likely be how strongly the FCF grows in parallel so that the debt does not increasingly deprive AT&T of breathing space.
What to expect from AT&T’s Q3 earnings and will AT&T beat earnings estimates?
On the debt side, I expect AT&T to have settled all of the long-term notes and debentures outstanding in September. That should be a total of almost $4 billion.
AT&T debt list Q2’23 (AT&T investor relations)
Management also explained in Q2 why the balance sheet will continue to improve in Q3 and Q4:
After this payment, we will be in a position in which, we’ve satisfied all non-recurring near-term financial obligations. The majority of our debt is fixed at very low rates and we have refinanced or refunded some of our near-term debt maturities at really attractive rates. At the same time, capital investment will be coming down from all-time peak levels. This will increase cash and give us more cash to reduce net debt/ So going forward, from now until the first half of 2025, we expect to increasingly use our free cash flows after dividend to reduce debt at a faster pace. By the end of this year, we expect to reduce net debt by around $4 billion, excluding any potential FX impacts which will put us at about the three times range for net debt to adjusted EBITDA.
Consensus EPS estimates are $0.62, and consensus revenue estimates are $30.24 billion. This would equate to YoY revenue growth of 0.65 percent and EPS growth of minus 8.62 percent.
On FCF, AT&T earned $0.75 per share in Q3 2021 and $0.58 in Q3 2022 (Q1 2023: $0.33; Q2 2023: $0.79). It’s hard to make a prediction here. Historically, however, Q4 is the strongest in terms of FCF (Q4 2022: $0.85; Q4 2023: $1.08), so Q3 may not bring in the most significant chunk of the missing $11 billion. However, I expect FCF to be above Q2 2023.
Will AT&T beat these estimates?
In the last two years, AT&T has beaten EPS estimates eight times. Regarding revenue, however, there were five misses and only three beats, but overall, misses and beats on revenue were insignificant and rarely more than 1 percent. On EPS, too, investors should expect a variance in the shallow double-digit percentage range at most.
Earnings Surprise (EPS) – Actual vs Consensus (Seeking Alpha)
Key metrics to watch
In addition to the general operating numbers (revenue, profit, postpaid phone growth, fiber subscribers, wireless service revenue, ARPU, etc.), the following numbers are particularly relevant to me. Once, I will look at whether AT&T made a step in Q3 to reduce net debt to adjusted EBITDA ratio to about 2.5 by the end of 2025. Management once again emphasized the commitment in the Q2 earnings call:
We remain committed to achieving the 2.5 times range for net debt to adjusted EBITDA in the first half of 2025.
Personally, I am also interested in how interest expense will develop. I expect an increase here compared with the prior-year quarter, as shown above.
But the needle at the end will move FCF. Q3 FCF could well be the hit-or-miss metric, and anything that makes the $16 billion FCF for FY 2023 (YoY growth of 14 percent) look more likely will be gratefully received by investors.
AT&T stock valuation and stock forecast
With a P/E ratio of less than 6, AT&T is valued so low that it almost causes value investors physical pain not to invest in the stock. From a fundamental perspective, everything speaks for a buy.
Firstly, investors receive a dividend yield of 7.7 percent, which would be safe with an FCF of $16 billion (dividend expenses for FY 2022 were under $10 billion).
Secondly, given the predictable and static business model, it is also not to be expected that profits and FCF will massively and surprisingly collapse in the next few years. Analysts even expect annual EPS and sales to improve slightly by 2026.
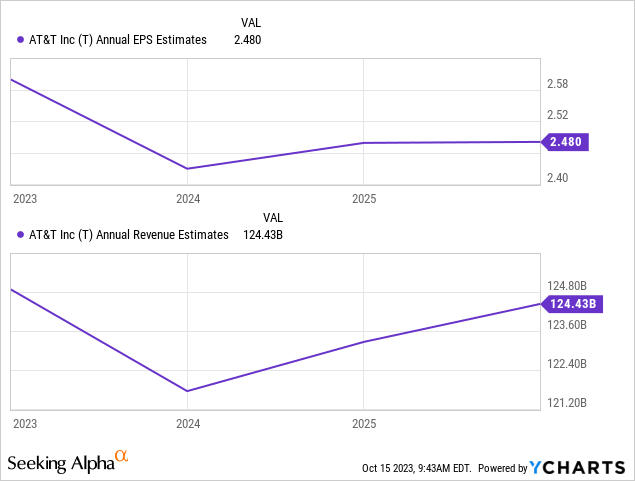
Currently, investors get an EPS of $2.43 per year and an FCF of about $2.32 per year for a $14.36 investment, with only a tiny downside potential for both earnings and FCF as well as the share price.
In this respect, my thesis from the last article remains intact with regard to the price potential:
On average and based on adjusted earnings, the market has valued AT&T at a fair P/E multiple of 13.3 over the past ten years. Based on average adjusted earnings per share of approximately $2.30 and $2.50 expected for 2025, the P/E ratio would be only slightly above 6, thus far below the historical average, suggesting a significant upside potential of at least 50 percent.
Even if we discount the fair multiple with regard to a potential market entrance by Amazon, AT&T’s fundamental valuation is still quite attractive.
Let’s take a look at other ratings before the AT&T Q3 numbers (here, too, optimism prevails):
- AT&T has a Quant rating of “HOLD”, with a 3.42 rating score.
- Both Wall Street and Seeking Alpha analysts rate the AT&T stock “BUY,” with SA analysts giving the stock a 3.83 rating while Wall Street analysts rate it with 3.64.
Conclusion
The picture from my July article continues to be accurate. The AT&T share is a dead cat. In the medium term, however, I see significant upside potential fed by fundamental valuation and the associated price recovery (the dead cat bounce), although it is uncertain when this will occur. Personally, I do not believe that the Q3 numbers on October 19 will move the needle in any direction. Nevertheless, the key metrics debt and FCF described above should give a significant pointer into the future.
Despite the weak market environment, I am also somewhat surprised that AT&T maintains some share price strength relative to the market. This suggests that the market sees hardly more opportunities to price in any more negatives into the stock. For a share price recovery, this is a good setup, in my view, which is why I am changing my rating to buy. However, please note that this buy rating is only for a mid-term investment horizon of a few quarters. I still lack conviction in AT&T’s business model for long-term investors with an investment horizon of decades.
Analyst’s Disclosure: I/we have a beneficial long position in the shares of T either through stock ownership, options, or other derivatives. I wrote this article myself, and it expresses my own opinions. I am not receiving compensation for it (other than from Seeking Alpha). I have no business relationship with any company whose stock is mentioned in this article.
Seeking Alpha’s Disclosure: Past performance is no guarantee of future results. No recommendation or advice is being given as to whether any investment is suitable for a particular investor. Any views or opinions expressed above may not reflect those of Seeking Alpha as a whole. Seeking Alpha is not a licensed securities dealer, broker or US investment adviser or investment bank. Our analysts are third party authors that include both professional investors and individual investors who may not be licensed or certified by any institute or regulatory body.
