Summary:
- AT&T continues to face competition from T-Mobile US.
- Customer lifetime value has seen a decline over the past couple of years.
- I take the view that an increase in this metric will be necessary to justify further upside at this time.
Brandon Bell
Investment Thesis: I take the view that while AT&T (NYSE:T) has the capacity to maintain its dominant position in the United States, growth in customer lifetime value as well as evidence the company can compete against T-Mobile will be necessary to see further upside.
In a previous article back in August 2022, I made the argument that AT&T could see a rebound in upside going forward on the basis of a reduction in churn rates as well as growth in overall revenue.
As someone who has been long the stock for over six years, even I will admit that the lack of return on the stock has been frustrating – a high dividend yield notwithstanding.
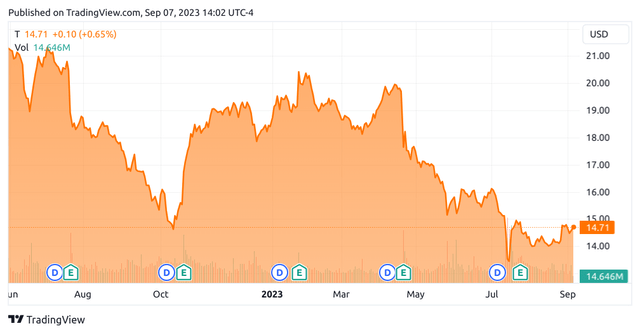
We can see that since my last article, the stock has descended further to a price of $14.71 at the time of writing:
TradingView.com
The purpose of this article is to assess whether AT&T still has the ability to see a rebound in growth from here taking recent performance into consideration.
Performance
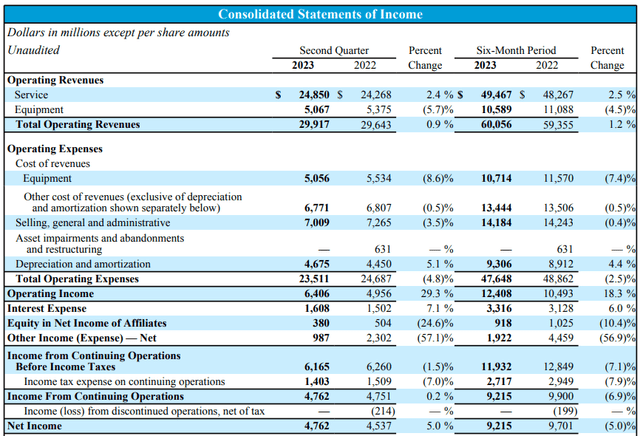
When looking at the most recent earnings results for AT&T, we can see that while operating revenues saw a modest gain – on account of growth across the Service segment – net income growth was up by 5% as compared to the same quarter last year due to a decline in expenses.
AT&T: Financial and Operational Schedules & Non-GAAP Reconciliations – 2nd Quarter Earnings 2023
In my previous article, I had remarked that AT&T’s performance had been improving in that the company was seeing a lower postpaid phone churn rate over the past five years.
AT&T Average Churn By Year
| Year | Churn Rate (%) |
| 2018 | 0.90 |
| 2019 | 0.95 |
| 2020 | 0.79 |
| 2021 | 0.76 |
| 2022 | 0.80 |
Source: Average churn rate calculated by author – original figures sourced from historical AT&T quarterly earnings reports.
With that being said, we see that churn increased slightly for 2022 – and the average churn rate for the first two quarters of this year has also been 0.80%.
However, it is also notable that postpaid phone-only ARPU has increased from $54.81 in Q2 2022 to $55.63 in Q2 2023.
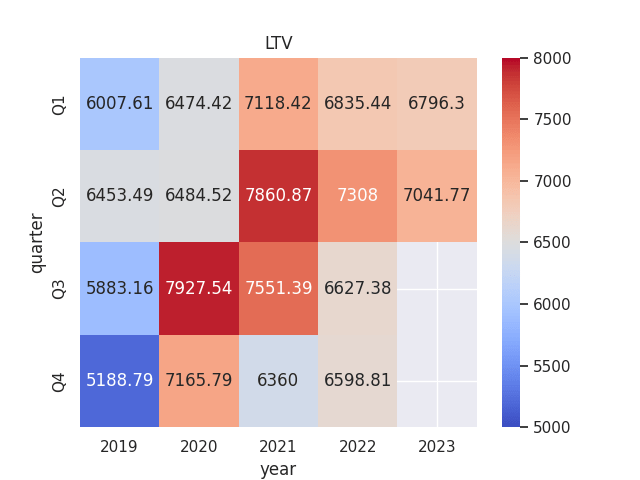
To better assess whether AT&T’s ARPU and churn rate figures are improving – I decided to calculate customer lifetime value across the postpaid phone segment over a five-year period. This was calculated as ARPU/churn rate for each quarter from 2019 to the present:
Heatmap generated by author using Python’s seaborn visualisation library. ARPU and churn rate figures sourced from historical AT&T quarterly reports.
The reason I decided to calculate this metric was to get a better sense of whether the total revenue that AT&T can expect from a customer over their lifetime is increasing or decreasing. For instance, AT&T may see a higher churn rate in a particular year – but this could be outweighed by higher revenue across its remaining customers.
In the heatmap above, we can see that customer lifetime value peaked in 2020 and 2021 – during the COVID-19 pandemic. For Q1 and Q2, we can see that LTV has been decreasing since 2021 – even though it remains higher than figures we saw in 2019 pre-pandemic.
When looking at the long-term debt to total assets ratio of AT&T, we can see that while this ratio has increased slightly over the past three years – the company’s long-term debt itself has declined:
| Dec 2020 | Dec 2021 | Jun 2022 | Dec 2022 | Jun 2023 | |
| Long-term debt | 153775 | 151011 | 129747 | 128423 | 128012 |
| Total assets | 525761 | 551622 | 426433 | 402853 | 408453 |
| Long-term debt to total assets ratio | 29.25% | 27.38% | 30.43% | 31.88% | 31.34% |
Source: Long-term debt and total assets figures (in millions of US dollars) sourced from historical AT&T Financial and Operational Schedules reports. Long-term debt to total assets ratio calculated by author.
Additionally, the company’s quick ratio (calculated as total current assets less inventories less prepaid and other current assets over current liabilities) has seen an overall drop since December 2020 – notwithstanding a slight improvement in the ratio since the previous quarter.
| Dec 2020 | Dec 2021 | Jun 2022 | Dec 2022 | Jun 2023 | |
| Total current assets | 52008 | 59997 | 34485 | 33108 | 36672 |
| Inventories | 3695 | 3464 | 3241 | 3123 | 2348 |
| Prepaid and other current assets | 18358 | 17793 | 15764 | 14818 | 15492 |
| Current Liabilities | 63438 | 85588 | 49189 | 56173 | 54159 |
| Quick ratio | 0.47 | 0.45 | 0.31 | 0.27 | 0.35 |
Source: Figures (in millions of US dollars) sourced from historical AT&T Financial and Operational Schedules reports. Quick ratio calculated by author.
With a quick ratio less than 1, this indicates that AT&T does not possess sufficient liquid assets to cover its current liabilities.
My Perspective
Speaking from the standpoint of someone who is long AT&T, my view is that while revenue and net income continue to rise modestly – the fact that the drop in churn is showing signs of bottoming and that we are seeing a gradual drop in customer lifetime value as compared to the pandemic years of 2020 and 2021 could be a signal that inflation and broader macroeconomic concerns are affecting growth for AT&T in this regard.
I had previously pointed out in my prior article that while AT&T pays a high dividend yield – inflation has been increasing the frequency of late bill payments for the company – which could stand to affect free cash flow growth going forward.
However, this has not been the case, as we can see that free cash flow growth over the past year has been vibrant:
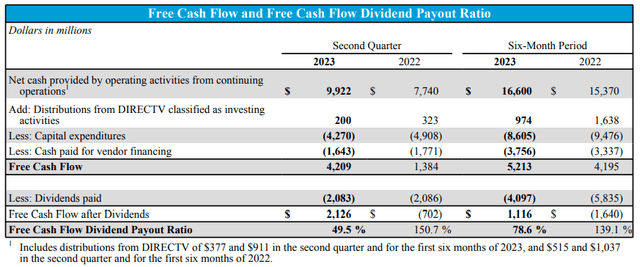
AT&T: Financial and Operational Schedules & Non-GAAP Reconciliations – 2nd Quarter Earnings 2023
While this is encouraging, I take the view that AT&T needs to see growth in customer lifetime value before we can see meaningful upside from here. In my view, a key determinant of whether the company will be able to achieve this will be the extent to which it can cope with growing competition from T-Mobile (TMUS) – which in the most recent quarter saw a lower churn rate than both AT&T and Verizon (VZ).
With T-Mobile having continued to attract a greater customer base since its merging with Sprint – it is likely that AT&T will need to continue significant promotional activity to keep customers from switching, and this could also mean significant price competition.
We can also see that over the past three years – earnings growth for T-Mobile has also significantly surpassed that of AT&T in the last year:
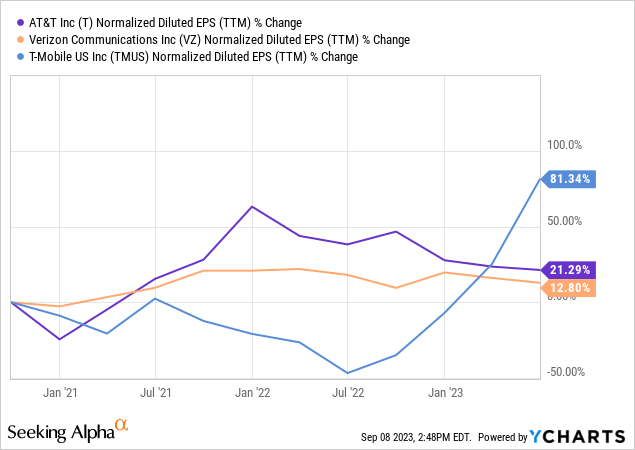
ycharts.com
There is a possibility that this could reflect the influx of new customers following the Sprint merger and we could see a plateau from here.
AT&T still has the most reach, covering an estimated 55% of the United States, with T-Mobile covering 35%. While T-Mobile is reported to have the fastest median speeds across the country while AT&T has the slowest, this may be influenced by the fact that AT&T has a greater presence in rural areas – which would be expected to see lower speeds in any case.
Ultimately, I take the view that AT&T has the capacity to maintain its dominant position in the U.S. market in spite of T-Mobile’s growth. However, I take the view that customer lifetime value needs to see growth from here before the stock can follow suit.
Conclusion
To conclude, AT&T has seen continued growth in cash flow and a lower churn rate as compared to pre-pandemic years, in spite of the same showing signs of rising once again.
I take the view that AT&T can ultimately maintain its dominant position and intend to continue holding the stock. However, I would need to see clear evidence of growth in customer lifetime value as well as increased evidence that the company can maintain a low churn rate as compared with T-Mobile before adding further to my position.
Analyst’s Disclosure: I/we have a beneficial long position in the shares of T either through stock ownership, options, or other derivatives. I wrote this article myself, and it expresses my own opinions. I am not receiving compensation for it (other than from Seeking Alpha). I have no business relationship with any company whose stock is mentioned in this article.
This article is written on an "as is" basis and without warranty. The content represents my opinion only and in no way constitutes professional investment advice. It is the responsibility of the reader to conduct their due diligence and seek investment advice from a licensed professional before making any investment decisions. The author disclaims all liability for any actions taken based on the information contained in this article.
Seeking Alpha’s Disclosure: Past performance is no guarantee of future results. No recommendation or advice is being given as to whether any investment is suitable for a particular investor. Any views or opinions expressed above may not reflect those of Seeking Alpha as a whole. Seeking Alpha is not a licensed securities dealer, broker or US investment adviser or investment bank. Our analysts are third party authors that include both professional investors and individual investors who may not be licensed or certified by any institute or regulatory body.
