Summary:
- AT&T’s financial performance in Q3 of its 2023 fiscal year exceeded expectations, with revenue increasing by 1% and strong growth in postpaid subscribers and Connected Devices users.
- Earnings per share were lower than the previous year due to certain factors, but adjusted earnings per share beat forecasts.
- The company reported positive metrics such as a decline in net debt and increased guidance for EBITDA and free cash flow, indicating a positive outlook for the business.
Brandon Bell
Nobody is perfect, especially when it comes to investing. We all make mistakes, including not only missing out on opportunities but also buying companies that end up being worth less than we thought. These challenges are what make a big win that much sweeter. And it’s that sweetness that I’m currently experiencing when it comes to telecommunications conglomerate AT&T (NYSE:T). Back in July of this year, after shares of the company took a beating, I made the proclamation that “the bears have lost, but they don’t know it yet.” That article demonstrated robust financial performance provided by management covering the second quarter of the company’s 2023 fiscal year. While not everything that management reported was positive, the overall picture was bullish and I felt comfortable enough to claim that, while the stock was still near multi-year lows, the worst was behind it.
Fast forward to today and the picture is looking even better. Before the market opened on Oct. 19, the management team at the enterprise reported financial results covering the third quarter of the company’s 2023 fiscal year. This sent shares up 6.6% for the day, though at one point they were up around 8%. As the largest holding in my portfolio, accounting for over 17% of my invested assets, you can imagine how elated I was by this development. This move higher was instrumental in pushing the performance of the stock since the aforementioned article is up 7.6% at a time when the S&P 500 is down 6.6%. Although this is a nice disparity, the data reported by management during the third quarter earnings release suggests to me that the ride higher is just getting started.
The picture continues to improve
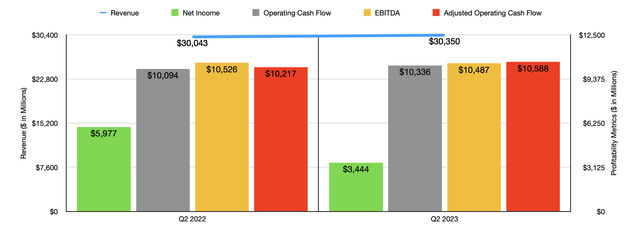
By pretty much every account, the third quarter of the 2023 fiscal year was a fantastic time for AT&T and its investors. Let’s take revenue to begin with. During the quarter, sales totaled $30.35 billion. That represents an increase of 1% over the $30.04 billion reported one year earlier. Overall revenue for the quarter actually came in at $110 million above what analysts had forecasted. It’s really difficult to pin down one primary driver behind this growth. The fact of the matter is that there were multiple.
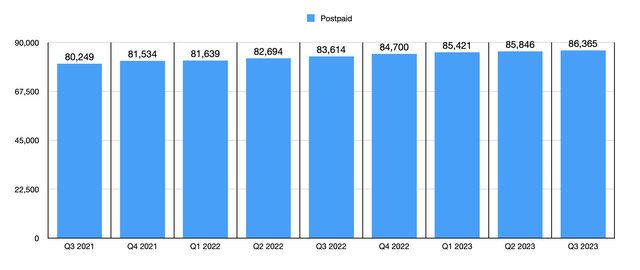
Mobility revenue, for instance, managed to jump about 2% year over year, climbing from $20.28 billion to $20.69 billion. The company benefited from continued growth in post-paid subscribers. These came in at 86.37 million. That’s up 3.3% over the 83.61 million reported one year earlier. And in the span of a single quarter, the company added 550,000 subscribers to the postpaid category. Postpaid phone subscribers jumped a similar 2.6%, but that makes sense because they make up the vast majority of the postpaid category. Reseller subscribers skyrocketed 21.3% from 5.85 million last year to 7.10 million this year.
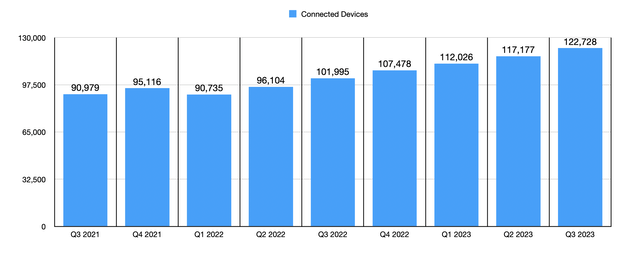
But what was most impressive to me was the continued growth in the number of Connected Devices users. This is a part of the company that I have written about previously. During the quarter, the number of subscribers came in at 122.73 million. That’s an astounding 20.3% above the nearly 102 million reported one year earlier. It also translates to a sequential gain of 5.55 million. Every quarter, I think to myself that eventually Connected Devices growth will slow or grind to a halt. And every quarter it defies expectations.
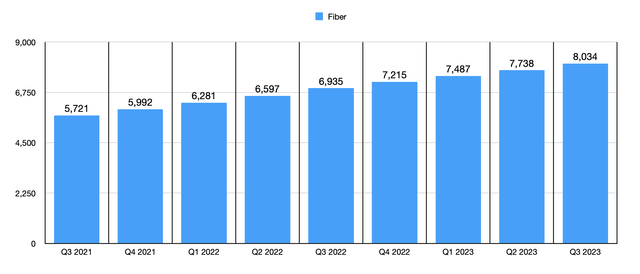
There were other sources of growth that AT&T enjoyed as well. For instance, its consumer fiber network continued to expand, reaching 20.7 million consumers and 3.3 million business customer locations. This allowed the company to grow its fiber revenue by 26.9% year over year, serving as the heavy lifter under the Consumer Wireline operations of the company that made those operations grow revenue by 9.8% compared to the same time last year. The company is well on its way to hitting or surpassing the 30 million locations mark by the end of 2025 and, for the first time ever, the number of fiber subscribers hit north of 8 million, totaling 8.03 million. Mid-band spectrum reach continues to grow, exceeding 190 million people as of the end of the most recent quarter. And by the end of this year, management is forecasting this to reach 200 million or more.
On the bottom line, the picture was a bit more complicated. Earnings per share of $0.48 came in substantially lower than the $0.80 per share reported at the same time last year. But this is not a perfect apples-to-apples comparison. Last year the company had multiple advantages, such as asset impairments that were $490 million smaller than what the company experienced at the same time this year. And it enjoyed $1.83 billion more of “other income” than it did at the same time this year. On an adjusted basis, earnings totaled $0.64, which was only marginally lower than the $0.68 in adjusted profits reported at the same time in 2022. While earnings per share came in $0.12 lower than what analysts thought they would be, adjusted earnings per share beat forecasts by $0.02 per share.
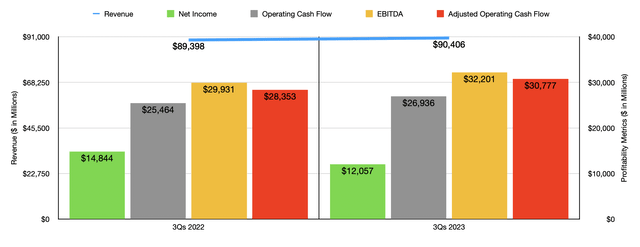
The earnings per share reported by management translated to net profits of $3.44 billion. That’s a little more than half the $5.98 billion reported at the same time last year. Obviously, adjusted earnings were far closer. Other profitability metrics, however, were somewhat mixed but mostly positive. Operating cash flow jumped from $10.09 billion to $10.34 billion. If we adjust for changes in working capital, we would get an increase from $10.22 billion to $10.59 billion. And finally, EBITDA dipped slightly from $10.53 billion to $10.49 billion. For context, in the chart below, I also included financial data for the first nine months of 2023 compared to the same time one year earlier. As you can see, profits were down. However, revenue and all cash flow metrics improved during this time.
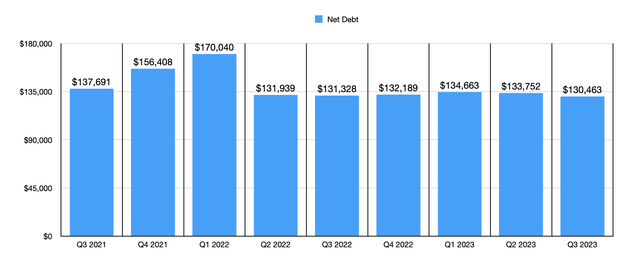
There were some other positive metrics that the company reported during this time that investors would be wise to know. For starters, net debt came in at about $130.46 billion. That represents a decline of $3.29 billion compared to what management reported at the same time last year. This is great to see because a reduction in debt should result in a reduction in interest expense. However, it’s unclear whether this is part of the company’s more recent plan to cut costs. You see, management did mention in the third quarter earnings release that they are making “strong early progress” in their goal of cutting annual run rate costs by $2 billion over the next three years.
The picture for the business is going so well that management even increased guidance for the year. Previously, the firm was forecasting EBITDA this year to be 3% or more than what it was last year. That would imply a reading of about $45.48 billion. That number has now been revised up to at least 4%, for a ground level of $45.92 billion. Even more impressive is the expectation that free cash flow should now be $16.5 billion. Previously, management had said that free cash flow would be at least $16 billion. But they refused to give any specifics as to what amount above $16 billion it might be. No guidance was given when it came to operating cash flow. But based on my estimate, and after stripping out non-controlling interests and some other adjustments, I believe it should come in at around $39.19 billion.
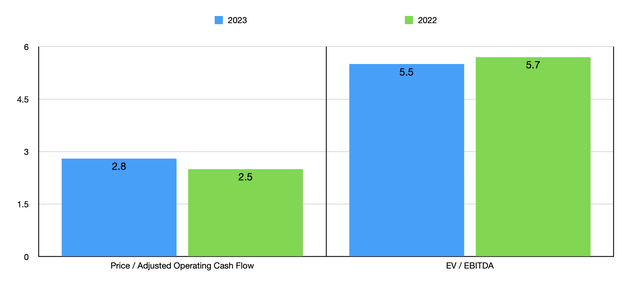
Using these figures, we can easily value the company. On a forward price to adjusted operating cash flow basis, shares are trading at a multiple of 2.8. That is slightly above the 2.5 reading that we get using data from 2022. Meanwhile, the forward EV to EBITDA multiple should be 5.5. That’s a decrease compared to the 5.7 reading that we get for 2022. In the table below, you can see how the company stacks up against two similar firms. Even if we assume that AT&T should be worth what the cheapest of those two companies is worth, the price to operating cash flow approach would imply an upside for the company of 25%. Meanwhile, using the EV to EBITDA approach, upside would be a far more limited 3.2%. However, I would argue that both AT&T and that rival, Verizon Communications (VZ), look undervalued to me. Frankly, I believe that AT&T is worth at least 50% more than what it’s trading for. And that’s probably being overly conservative by a meaningful margin.
| Company | Price / Operating Cash Flow | EV / EBITDA |
| AT&T | 2.8 | 5.5 |
| Verizon Communications | 3.5 | 5.6 |
| T-Mobile USA (TMUS) | 9.9 | 9.8 |
Takeaway
In my view, the tide is turning when it comes to AT&T. For too long have market participants claimed that debt is too high or that the company is not healthy? Its worst days are most certainly behind it and it’s a true cash cow. Frankly, I believe it is one of the best prospects on the market. It is certainly one of the healthiest. As I pointed out in my most recent article on the firm, it does have some challenges. But when you look at the overall picture, the only rating that can make sense is a “strong buy,” and any bearish argument against the firm deserves to be heartily disregarded as insane.
Analyst’s Disclosure: I/we have a beneficial long position in the shares of T either through stock ownership, options, or other derivatives. I wrote this article myself, and it expresses my own opinions. I am not receiving compensation for it (other than from Seeking Alpha). I have no business relationship with any company whose stock is mentioned in this article.
Seeking Alpha’s Disclosure: Past performance is no guarantee of future results. No recommendation or advice is being given as to whether any investment is suitable for a particular investor. Any views or opinions expressed above may not reflect those of Seeking Alpha as a whole. Seeking Alpha is not a licensed securities dealer, broker or US investment adviser or investment bank. Our analysts are third party authors that include both professional investors and individual investors who may not be licensed or certified by any institute or regulatory body.
Crude Value Insights is an exclusive community of investors who have a taste for oil and natural gas firms. Our main interest is on cash flow and the value and growth prospects that generate the strongest potential for investors. You get access to a 50+ stock model account, in-depth cash flow analyses of E&P firms, and a Live Chat where members can share their knowledge and experiences with one another. Sign up now and your first two weeks are free!

