Summary:
- Bank of America has emerged as a strong investment opportunity due to its robust financial performance, including revenue growth and increased net income.
- Technical analysis suggests a promising trend for BAC, with the stock price forming a solid base and showing signs of an upward trajectory, indicating a potential for higher prices.
- The stock price is experiencing a breakout from the inside bar pattern, coupled with a breakout from the falling wedge pattern, suggesting the potential for an upward rally.
Brandon Bell
In the dynamic landscape of the financial services sector, Bank of America Corporation (NYSE:BAC) has emerged as a noteworthy investment opportunity. BAC’s recent financial results underline its robust performance, marked by noticeable revenue growth, a surge in net interest income, and a significant increase in net income. This performance echoes the resilience of the bank, especially demonstrated in the robustness of its consumer banking division and a growth in sales and trading-related revenue. This article builds upon the previous discussions surrounding the technical outlook of BAC, particularly in relation to the formation of a bottom. As expected, the bottom has now materialized, indicating the potential for prices to ascend to higher levels. This projection is supported by the presence of a triple bottom pattern and a breakout from the falling wedge formation.
Bank of America Shines in the Financial Sector’s Evolving Landscape
In the constantly evolving arena of financial services, BAC carves out a niche as a compelling investment opportunity, underscored by its substantial recent financial milestones and potential for sustained growth. With this week’s unveiling of the most recent financial results, the industry served as a vibrant canvas depicting the current economic panorama, with BAC’s stellar performance capturing the spotlight.
BAC’s financial highlights reveal an 11% rise in year-on-year revenue to $25.2 billion, a significant 14% improvement in net interest income reaching $14.2 billion, and a 19% increase in net income, totaling $7.4 billion. The bank’s consumer banking division displayed a strong backbone to these outcomes, evidenced by a 15% surge in revenue. Additionally, remarkable progress was observed across BAC’s global wealth and investment management, global banking, and global markets.
A unique element of BAC’s resilient character was seen in its sales and trading-related revenue, which experienced a 3% expansion while numerous industry peers disclosed sizeable shrinkages in this sector. This resilience accentuates BAC’s position as a viable investment prospect. Adding to the investment allure, BAC’s CEO, Brian Moynihan, painted a picture of a “healthy U.S. economy growing at a tempered pace, with a robust job market”. Additionally, the positive outcomes from BAC’s global banking division not only indicate a steady future revenue pipeline but also enhance the bank’s investment appeal.
Although the future appears promising, it is crucial to acknowledge the inherent challenges within the banking sector. These challenges include increased capital requirements and uncertainties surrounding net interest income, funding costs, interest rates, and the standardization of credit. Nevertheless, the absence of significant disruptions during this earnings season and the restored confidence in BAC’s balance sheet indicates that the bank is adequately equipped to navigate these challenges.
Decoding Long-Term Investment Opportunities
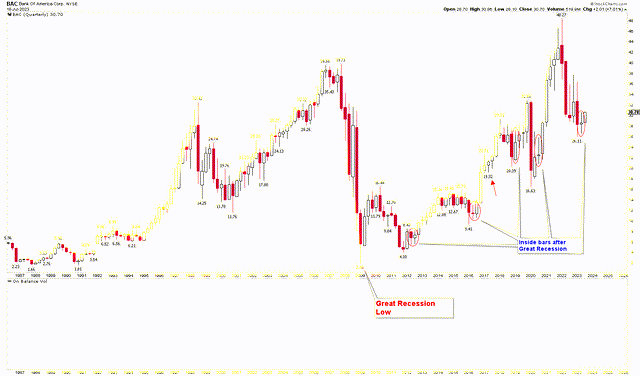
The long-term view, as demonstrated by the quarterly chart below, reveals a discernible process of solidification at the base of BAC’s stock price. Historically, following the significant low of $2.08 that marked the low of the Great Recession, the stock price has demonstrated a robust uptrend. A noteworthy observation is the consistent occurrence of an ‘inside bar’ preceding each notable market rally. The term ‘inside bar’ is a technical term referring to a market scenario where the range of a bar or candle is fully contained within the high and low of the previous bar. After the Great Recession, four instances of these inside bars were identified on the quarterly chart, each preceding a noteworthy upward market movement. These bars serve to denote price compression, a clear indication of impending market volatility. Notably, the first quarter of 2023 presented a compelling occurrence with the formation of an inside bar, further amplifying the significance of the current market dynamics. This inside bar suggests a potential compression in price, which has the capacity to ignite a rally. The recent earnings release, which occurred earlier this week, has triggered a powerful market rally and successfully broken the inside bar pattern. This breakout is a positive indication of an impending upward rally in price.
BAC Quarterly Chart (StockCharts.com)
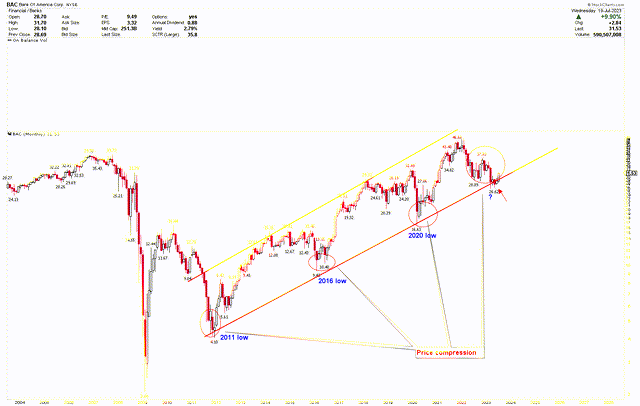
To gain a more comprehensive understanding of the BAC’s current situation, the monthly chart has been revised to depict the establishment of a solid foundation at the present levels. This chart, previously highlighted in earlier updates, further confirms the formation of a strong base, as indicated by the July monthly candle closing at higher levels. This consolidation exhibits intriguing similarities to the lows observed in 2011, 2016, and 2020. If history repeats itself, there is a potential for 2023 to mark a significant low point, acting as a catalyst for a powerful rally toward all-time highs.
BAC Monthly Chart (StockCharts.com)
Key Action for Investors
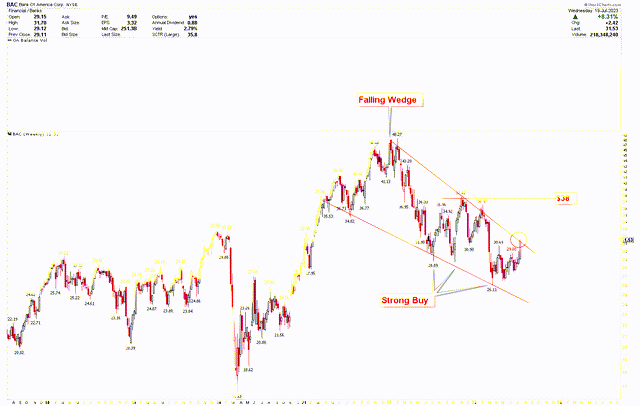
The previous chart analysis revealed the formation of a falling wedge pattern, and the current market movement is confirming its anticipated breakout, as depicted in the chart below. This pattern arises from a combination of supply-demand dynamics, investor sentiment, and market behavior. During a downward trajectory, sellers exert dominance, pushing the price lower. However, as the decline continues, the rate of decrease gradually diminishes, indicating a decline in selling pressure. Simultaneously, prospective investors, recognizing the lowered price as an attractive entry point, may initiate purchases. The projected target of this breakout is $38, while the broader target associated with the falling wedge stands at $48.27. BAC’s stock has already exhibited strong buy signals as seen in the chart below.
BAC Weekly Chart (StockCharts.com)
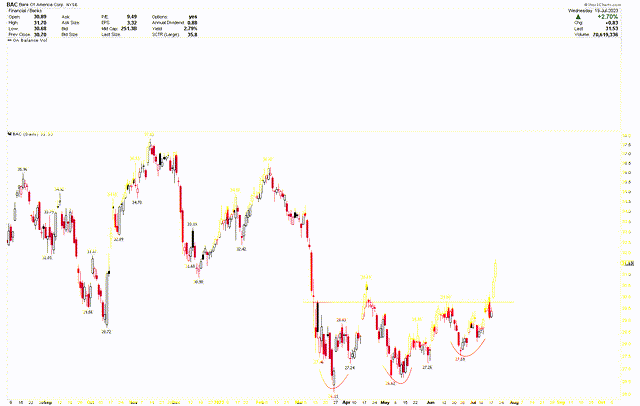
To provide further context regarding short-term behavior and investment opportunities, the daily chart below reveals the formation of a robust base known as a triple bottom. This pattern is characterized by consecutive lows at $26.11, $26.62, and $27.59, indicating a strong support level. While the structure of this triple bottom may not be ideal, in the existing market dynamics and amidst the financial crisis, it’s challenging to find perfect patterns. The breakout of this triple bottom and movement beyond $29.80 implies a trajectory toward higher prices. As such, investors may consider adding more long positions at current levels in anticipation of such a movement.
BAC Daily Chart (StockCharts.com)
Market Risk
BAC’s net interest income, which has shown a significant uptick, could be severely impacted by unexpected fluctuations in interest rates. Lower interest rates could potentially affect the bank’s margins and profitability. The bank’s profitability and loan portfolio’s value can be significantly affected by any large-scale default by borrowers. If there’s an economic downturn or a sudden surge in unemployment rates, it could potentially lead to increased loan defaults. Moreover, the financial sector is heavily regulated. Changes in banking regulations or more stringent regulatory scrutiny could affect BAC’s operations and its financial performance.
BAC has been investing heavily in technology to improve its services. However, this comes with risks associated with technology, including cybersecurity threats or tech-related failures. Additionally, BAC faces stiff competition from other major banks and financial institutions. Any loss of market share to its competitors could hurt its growth and profitability. Despite a decrease in BAC’s average deposit balances, the bank maintains significant Global Liquidity Sources. However, any unforeseen liquidity crunch could hamper the bank’s ability to fulfill its obligations.
From a technical perspective, the stock price is forming a solid base and appears to be heading toward an initial resistance level of $38. However, a break below the $26.11 mark would disrupt this foundation and signal a potential for further downward movement.
Bottom Line
In conclusion, BAC emerges as an attractive investment prospect within the ever-changing financial services industry, owing to its strong performance, ability to withstand challenges, and preparedness to navigate industry dynamics. The bank’s encouraging financial results, growing consumer banking sector, and steady expansion in trading-related revenue demonstrate its potential for sustained growth, making it a strong contender in the investment landscape. It’s essential, however, for investors to exercise caution and vigilance, acknowledging the inherent risks and uncertainties in the banking sector, including fluctuating interest rates, potential loan defaults, regulatory changes, and technological threats. Meanwhile, the technical analysis indicates a promising trend, with the stock price forming a solid base and showing signs of an upward trajectory. The breakout from the falling wedge pattern and triple bottom formation suggests a possible upward rally in the stock. Furthermore, in the second quarter of 2023, the stock price surpassed the highs of the inside bar, signaling an upward momentum. As a result of this breakout, investors may consider increasing their positions at current levels in anticipation of higher prices.
Analyst’s Disclosure: I/we have no stock, option or similar derivative position in any of the companies mentioned, and no plans to initiate any such positions within the next 72 hours. I wrote this article myself, and it expresses my own opinions. I am not receiving compensation for it (other than from Seeking Alpha). I have no business relationship with any company whose stock is mentioned in this article.
Seeking Alpha’s Disclosure: Past performance is no guarantee of future results. No recommendation or advice is being given as to whether any investment is suitable for a particular investor. Any views or opinions expressed above may not reflect those of Seeking Alpha as a whole. Seeking Alpha is not a licensed securities dealer, broker or US investment adviser or investment bank. Our analysts are third party authors that include both professional investors and individual investors who may not be licensed or certified by any institute or regulatory body.
