Summary:
- Bank of America has shown strong earnings and revenue growth, driven by trading revenues and investment banking fees, despite weaknesses in net interest income.
- BAC stock is attractively valued compared to peers, with a price-book ratio of 1.202x, but the stock does have a higher forward P/E ratio than important financial peers.
- Technical analysis suggests the potential for a 17.82% rally to $50.11, supported by key Fibonacci retracement levels and a favorable RSI reading.
- I raise my rating outlook to a “buy” due to the stock’s improving net interest income results and strong potential for further gains in long-term bullish price trends.

ProArtWork
When I last covered Bank of America Corp. (NYSE:BAC) with my article “Sell Bank of America” in early January 2021, the stock was in the middle of a substantial rally that would eventually generate gains of over 179% in less than two years. In part, these substantial gains were propelled by the stock’s reversal from the early pandemic lows (first developing in March 2020) before progressing to the stock’s all-time highs at $50.11 in February 2022. As is generally the case, I try to make sure to do everything I can to prevent incredible rallies from turning into disappointing losses and the central thesis of my article was that it was time to capture gains near the highs and to look elsewhere for more attractive (and undervalued) opportunities within the financial sector.
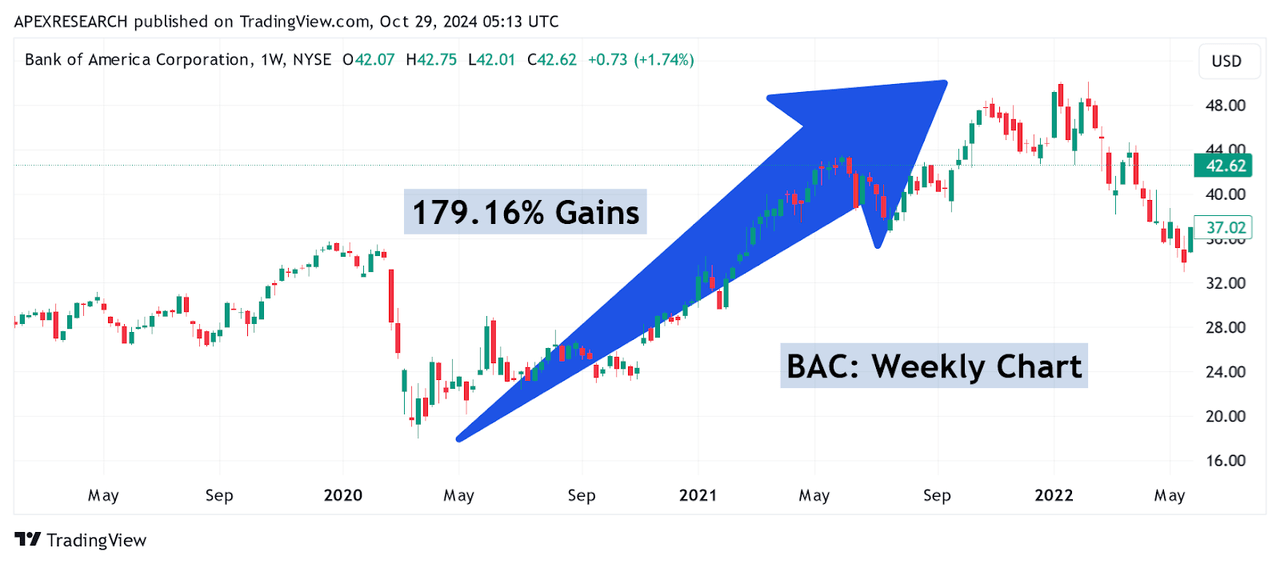
BAC: Massive Bullish Price Rally (Income Generator via Trading View)
Since then, similar reversals have been seen in the other direction as well. Following the recording of all-time highs at $50.11, the stock entered into another long-term trend wave movement that resulted in declines of nearly 50.19% before finding a sustainable bottom at $24.96 per share:
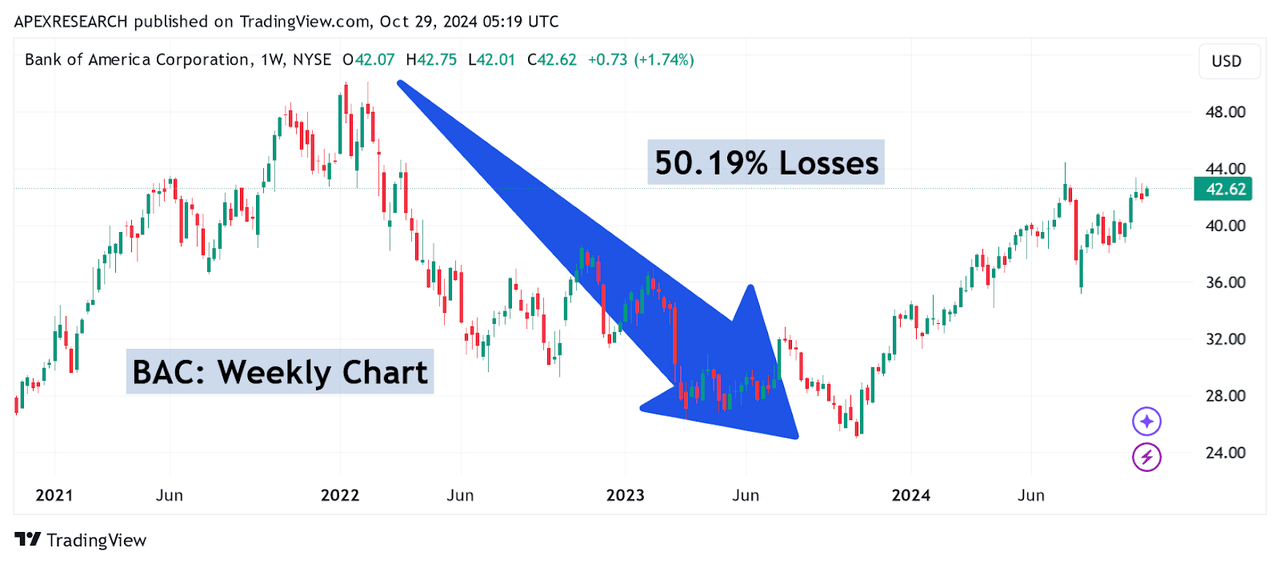
BAC: Severe Share Price Losses Follow (Income Generator via Trading View)
Of course, this brings us to the stock’s current trend movement higher, which continues to benefit from strong quarterly figures. During the most recent reporting period, Bank of America generated earnings of $0.81, and this surpassed consensus estimates by nearly 5.2%. Similarly, the firm’s revenue figure ($25.49 billion) also beat expectations, but by a much smaller margin (0.75%). Overall, these figures were aided, in large part, by strength in trading revenues and fees from investment banking and asset management services. However, clear weaknesses in net interest income counterbalanced these positives, and this helps to explain why Bank of America’s broader revenue figure was largely uninspiring.
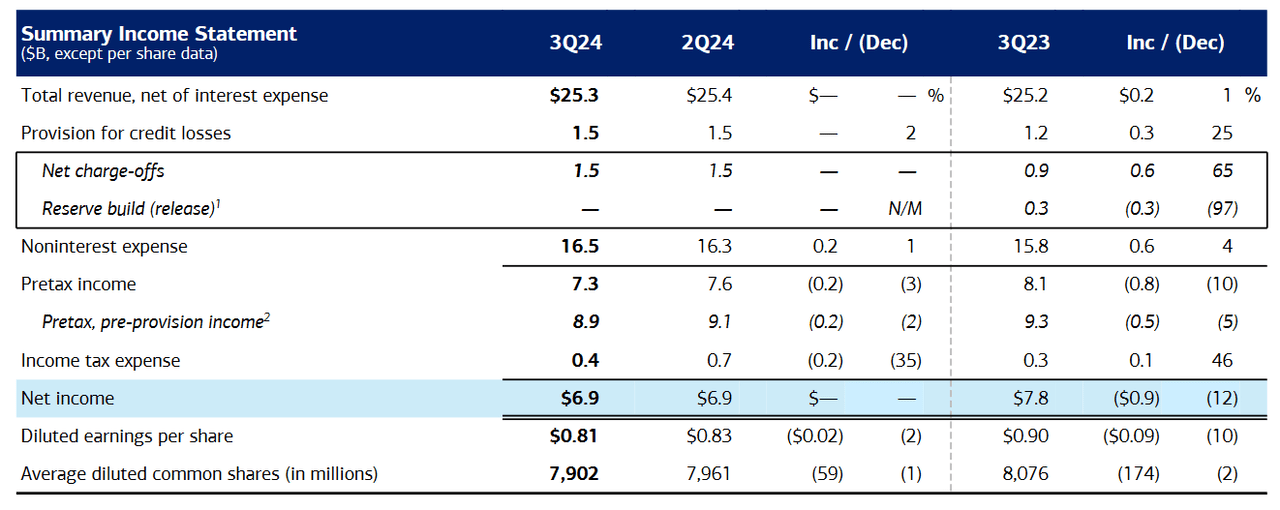
Bank of America: Quarterly Earnings Figures (Bank of America: Quarterly Earnings Presentation)
Specifically, revenues from trading in fixed-income assets surpassed consensus estimates by 5.84% and came in at $2.9 billion, which indicates annualized growth rates of roughly 8%. Key areas of stability were seen in interest rate investments and currency trading segments, but the main standout was found in the equity market trading segment, which came in near $2 billion. This latter figure actually surpassed consensus estimates by almost 10.5% and indicated annualized growth rates of 18% for the period. Interestingly, fees from Bank of America’s investment banking segment ($1.4 billion) also showed annualized growth rates of 18%, so it’s not difficult to see how these figures were able to support areas of weakness in other aspects of the report. More broadly, trends in these individual segment results were somewhat similar to figures posted by Goldman Sachs (GS) and JPMorgan Chase (JPM), which increases the likelihood that this is actually market-wide activity that might continue throughout the current quarter.
Bank of America: Quarterly Earnings Figures (Bank of America: Quarterly Earnings Presentation)
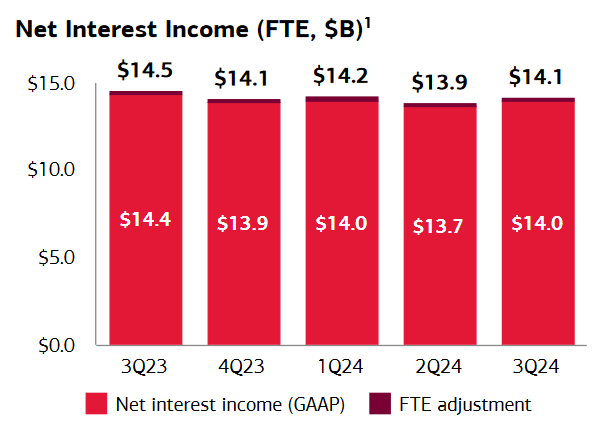
On the downside, net interest income (NII) figures came in at $14.1 billion, and this did actually beat consensus expectations by 0.28%, but these results indicate annualized declines of -2.9% for the period. At this stage, the real questions surrounding this critical metric relate to whether these annualized trends are beginning to reverse. One point that can be made in support of this assertion can be found in the fact that Bank of America’s NII figures have improved on a quarterly basis (even while falling YoY), and guidance has previously implied that NII would, in fact, experience a recovery during the third and fourth quarters.
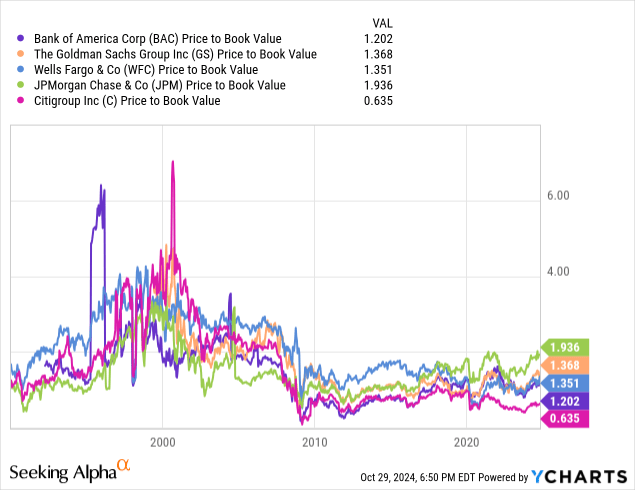
Bank of America: Comparative Price to Book Valuations (YCharts)
If these forward-looking projections turn out to be accurate, this could suggest that Bank of America is reaching a decisive moment and that prior declines in NII might stop weighing on share price valuations in the months ahead. If we compare Bank of America’s price-book valuation (at 1.202x) with significant industry peers, we can see that the stock is actually quite attractively valued at the moment. Specifically, JPMorgan Chase (at 1.936x), Goldman Sachs (at 1.368x), and Wells Fargo & Company (WFC) at 1.351x are all trading at substantially higher valuations. Within this banking peer group, only Citigroup Inc. (C) is trading with a lower price-book ratio (at 0.635x).
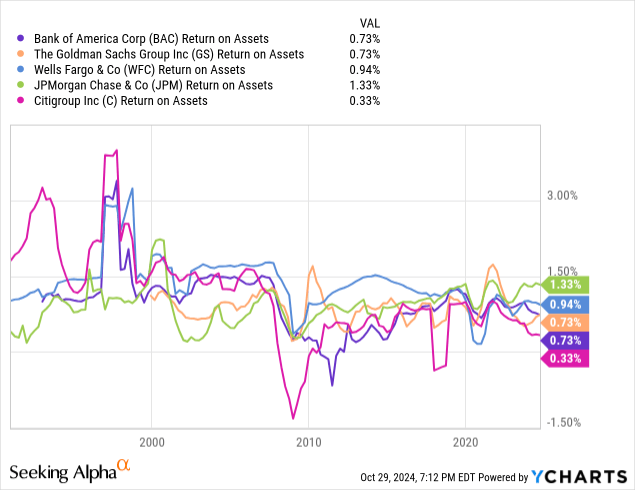
Bank of America: Comparative Return on Assets Metrics (YCharts)
Another valuation method that I like to analyze when I am assessing financial stocks is the return on assets (ROA) metric. Here, we can see that Bank of America is currently found in a weaker relative position (at just 0.73%), but it should also be noted that Goldman Sachs is in an equivalent position with the same figure (0.73%). Only Citigroup is shown with a weaker ROA figure (at 0.33%), but both Wells Fargo (at 0.94%) and JPMorgan Chase (at 1.33%) are looking more attractive at the moment when using this valuation metric.
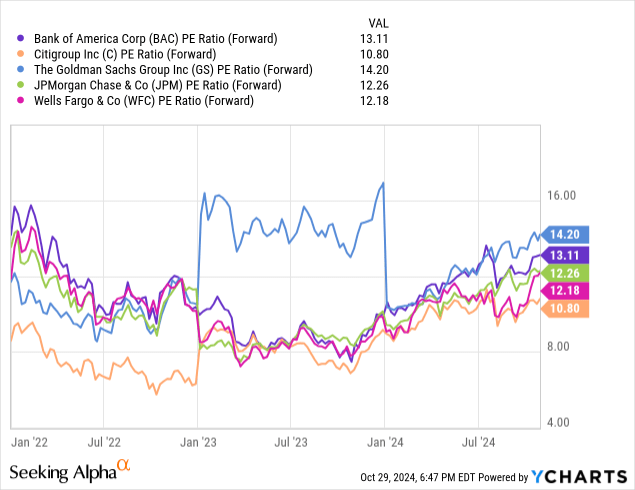
Bank of America: Comparative Price to Earnings Valuations (YCharts)
Finally, we will look at the forward price-earnings ratios for each of these financial stocks in order to achieve a more fully balanced outlook. In this case, we can see that Bank of America is trading at 13.11x forward earnings, which is more expensive than JPMorgan (at 12.26x), Wells Fargo (at 12.18x), and Citigroup (at 10.8x). Using this metric, only Goldman Sachs is trading at a higher valuation ratio (at 14.2x), so this tells us that Bank of America might be a bit expensive at the moment. Considering all of these valuation ratios in combination with one another, we can see that Bank of America might be trading at levels that are less than ideal, and this is one of the central reasons I have raised my rating outlook to a “buy” rather than a “strong buy.”
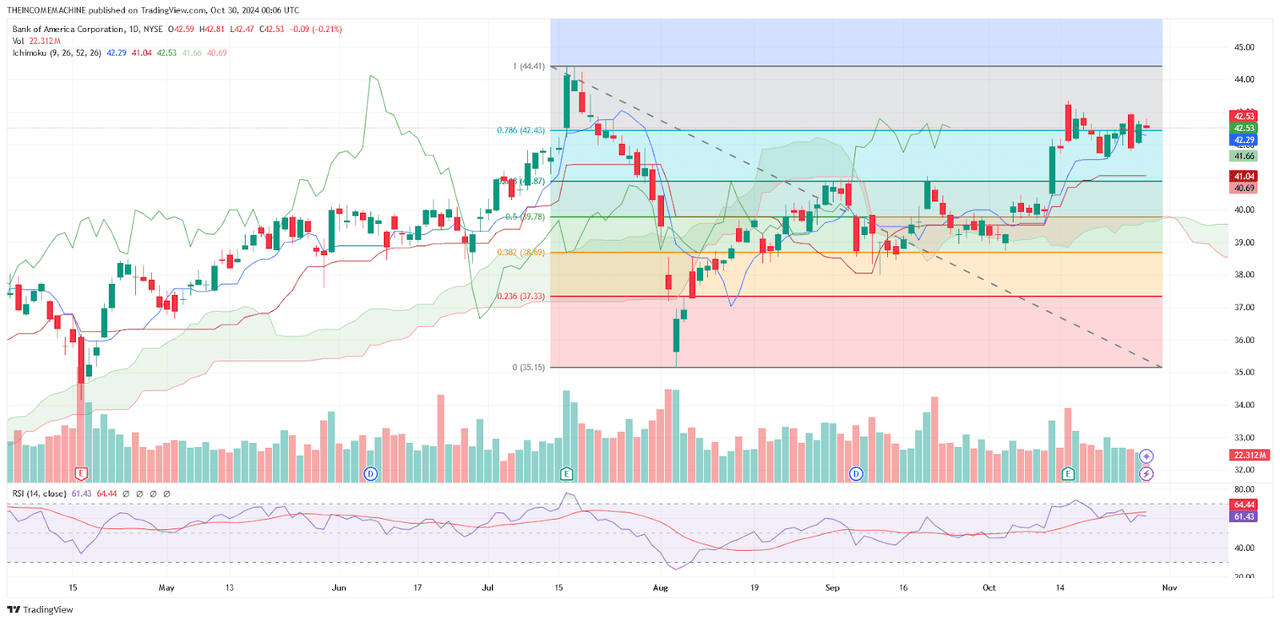
BAC: Critical Support and Resistance Zones (Income Generator via Trading View)
With all of that said, I still believe that BAC share prices have excellent potential to continue moving higher. If we move out to the long-term monthly price charts, we can see that major resistance is not found until the $50.11 price level (which marks the stock’s highs from February 2022), and this suggests that the stock might be able to rally by another 17.82% before encountering significant selling pressures. Additionally, Bank of America’s rallies above $42.10 on October 11th, 2024 have broken through the 61.8% Fibonacci retracement of the bearish trend wave extending from $50.11 to $24.96 (which is located near $40.80 per share). Interestingly, this made it easier for the stock to move above the 78.6% retracement of the aforementioned price move (which is located just below $42.50). Now that these key retracement zones have been breached, the next price target calls for a 100% retracement of the aforementioned price move (which implies at least a re-test of the stock’s all-time highs at $50.11). Currently, daily indicator readings in the relative strength index are holding at 61.43 and this implies that the stock still has further room for share prices to extend to the topside before reaching overbought territory.
On the whole, I think that Bank of America is in the process of reversing its prior problematic issues with weaknesses in net interest income figures, and the stock’s price-book valuation is currently trading near the lower end of its industry peer group. Of course, some of the stock’s valuation metrics are a bit too high to be considered ideal, so I will raise my rating outlook to a “buy” (rather than a “strong buy”) and maintain my long position at least until we see share prices trading to important resistance levels found near $50 per share.
Analyst’s Disclosure: I/we have a beneficial long position in the shares of BAC either through stock ownership, options, or other derivatives. I wrote this article myself, and it expresses my own opinions. I am not receiving compensation for it (other than from Seeking Alpha). I have no business relationship with any company whose stock is mentioned in this article.
Seeking Alpha’s Disclosure: Past performance is no guarantee of future results. No recommendation or advice is being given as to whether any investment is suitable for a particular investor. Any views or opinions expressed above may not reflect those of Seeking Alpha as a whole. Seeking Alpha is not a licensed securities dealer, broker or US investment adviser or investment bank. Our analysts are third party authors that include both professional investors and individual investors who may not be licensed or certified by any institute or regulatory body.
