
Summary:
- The decline of the KBW Nasdaq Regional Banking index is a signal of a larger financial crisis caused by the collapse of Silicon Valley Bank.
- Banks are feeling the effect of a negative Treasury yield curve, causing them to tighten lending standards and reduce credit availability.
- Bank of America Corporation is currently experiencing a strong bullish trend and presents a strong buying opportunity for long-term investors at strong support level.
- The appearance of a falling wedge pattern in BAC’s stock price suggests a high likelihood of a breakout above key levels.
Stephen Chernin/Getty Images News
The banking industry is facing significant challenges, including the recent collapse of Silicon Valley Bank of SVB Financial Group (OTC:SIVBQ), which is causing investor anxiety and increasing scrutiny of other banks. Although Bank of America Corporation (NYSE:BAC) could potentially profit from these financial crises, the unfavorable Treasury yield curve and decrease in bank lending may cause a reduction in the net interest margin, ultimately leading to a contraction in economic activity. Moreover, banks are tightening lending standards and reducing credit availability, which may have several implications for borrowers and the wider financial system. The instability among regional banks is also affecting the growth of credit, and the borrowing activity of banks from the Federal Reserve (Fed) and Federal Home Loan Bank (FHLB) has slowed down.
The article examines the current economic situation, retail performance, PCE inflation, and the technical analysis of BAC’s stock price to forecast its next direction. The current market analysis indicates that the price is currently situated within a long-term support zone, which presents an excellent buying opportunity. Conversely, a significant upward movement beyond $38 would trigger a strong rally.
Fears In the Banking Industry
The collapse of SIVBQ is having a ripple effect on the broader banking industry, potentially leading to a loss of investor confidence and increased scrutiny of other banks. The following chart shows the NASDAQ KBW Nasdaq Regional Banking Index (KRX) index, which is currently testing support at the 90 level after experiencing a decline. This drop in the KRX index may be indicative of a broader financial crisis being triggered by the collapse of SIVBQ.
KBW Nasdaq Regional Banking Index (KRX) (tradingview.com)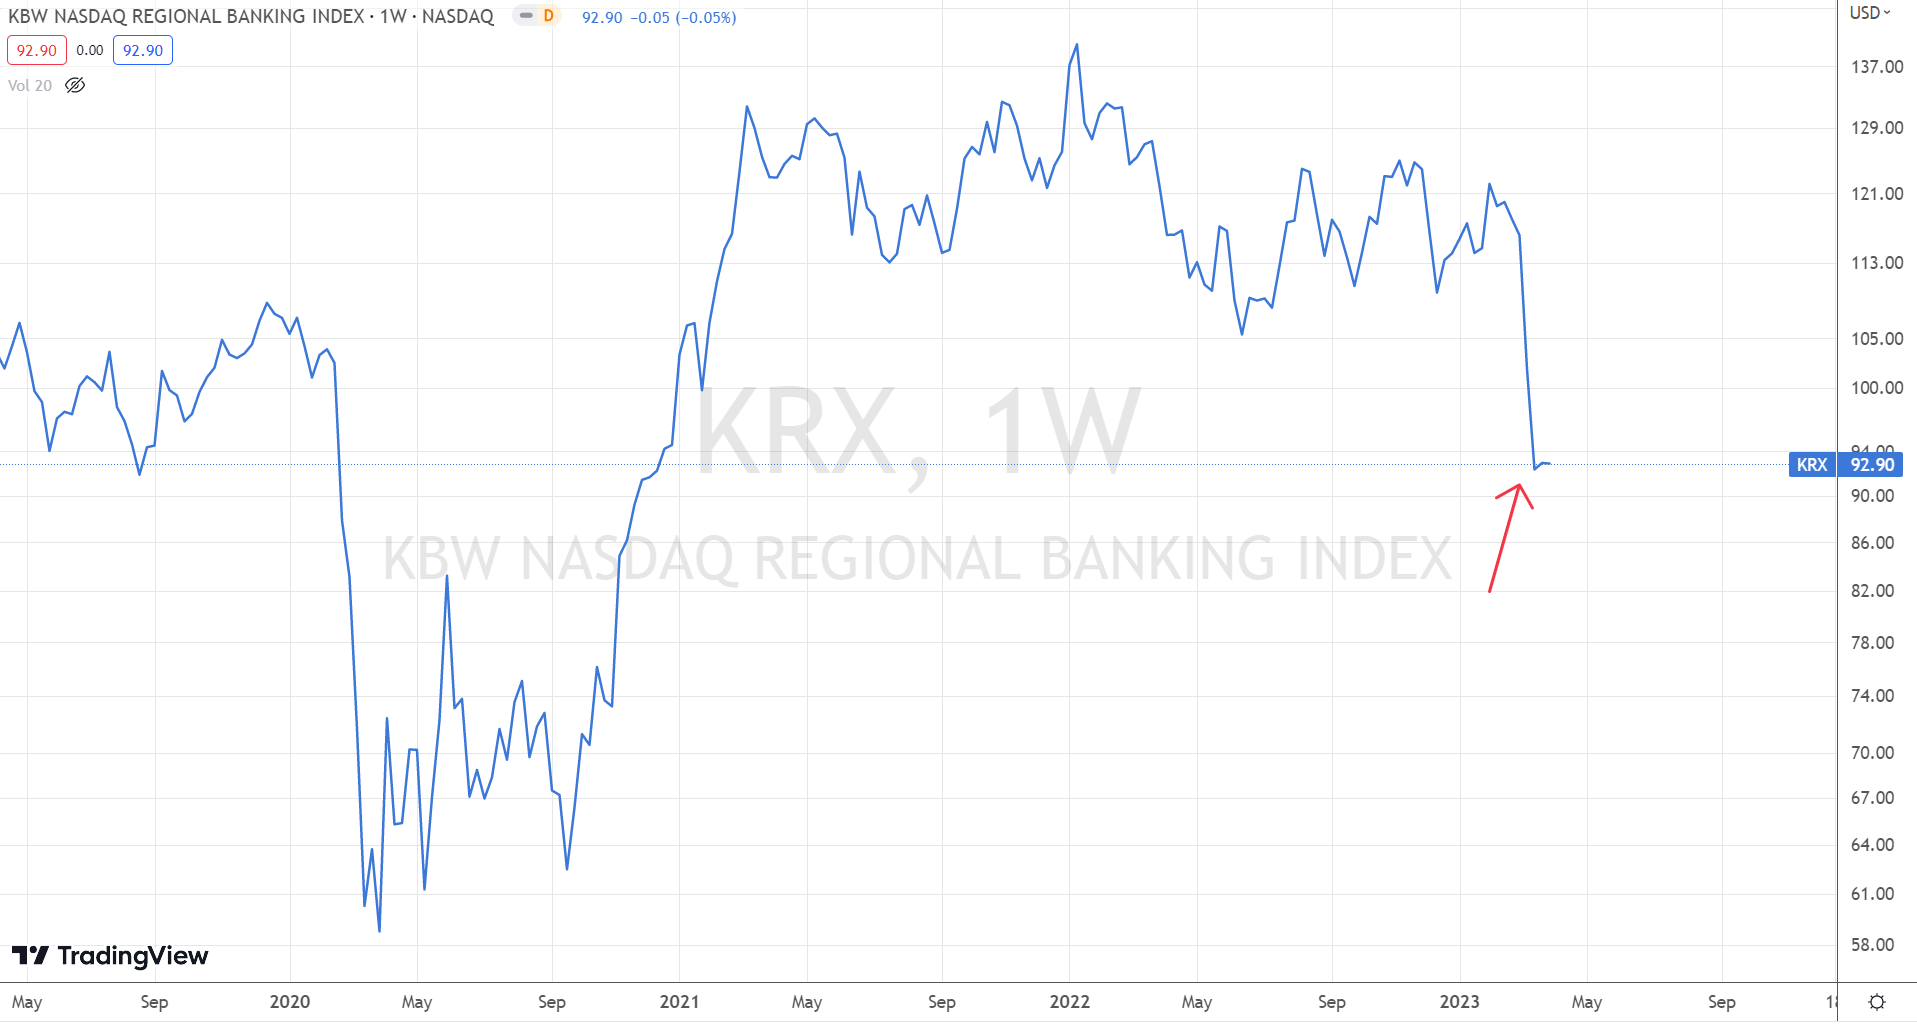
The failure of SIVBQ and the subsequent decline of the KRX index present promising prospects for BAC to widen its market share and gain new clientele. BAC has already amassed over $15 billion in fresh deposits. Moreover, rumors are circulating that BAC might acquire Signature Bank (OTC:SBNY), a move that could bolster its position and alleviate some of the impacts of the aforementioned bank’s collapse.
On the other hand, a Treasury yield curve that dips below zero signifies that investors are more worried about the short-term outlook for the economy than the long-term outlook. This inversion serves as a warning sign of a decrease in bank lending. This happens because banks tend to become more cautious in extending loans due to no earnings from interest on loans. This can cause a decline in economic activity and trigger a recession.
Treasury Yield Curve (fred.stlouisfed.org)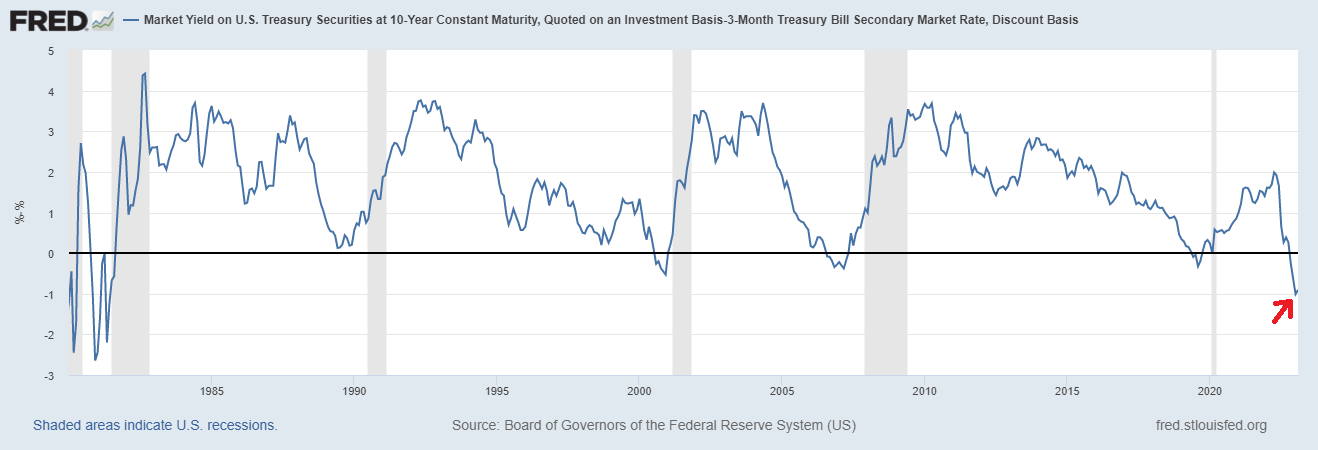
BAC generates revenue through net interest margin, which is the difference between the interest rates charged on loans and the interest rates paid on deposits. The negative Treasury yield curve compresses this margin, as the interest rates charged on loans may be lower than the interest rates paid on deposits, resulting in a reduction in revenue for BAC.
Moreover, the chart below indicates that banks are already feeling the effects of the negative Treasury yield curve, causing banks to tighten lending standards and reduce credit availability. According to the latest data, 44.8% of banks have reportedly tightened lending standards during the first quarter of 2023. This indicates that these banks are being more cautious and selective in approving loans, which may have several implications for borrowers, the wider financial system, and the economy as a whole.
Domestic Banks Tightening Standards for Commercial & Industrial Loans (fred.stlouisfed.org)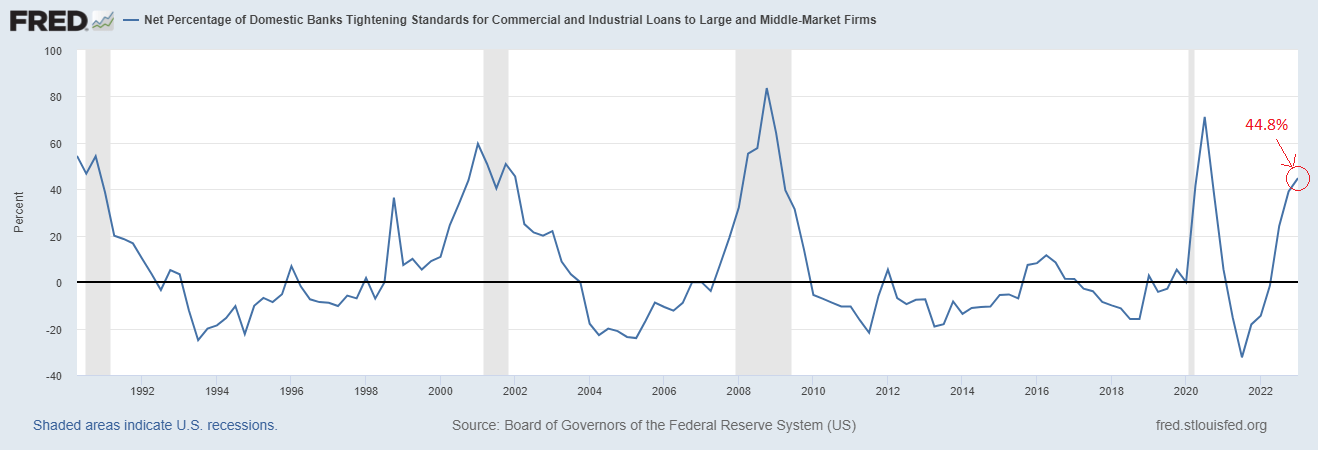
The instability among regional banks is likely to have a significant impact on the growth of credit, as regional banks play a vital role in providing credit to individuals and businesses in respective regions. The chart below shows a $20 billion fall in credit, which is the largest weekly contraction since June 2021.
Loans and Leases in Bank Credit (fred.stlouisfed.org)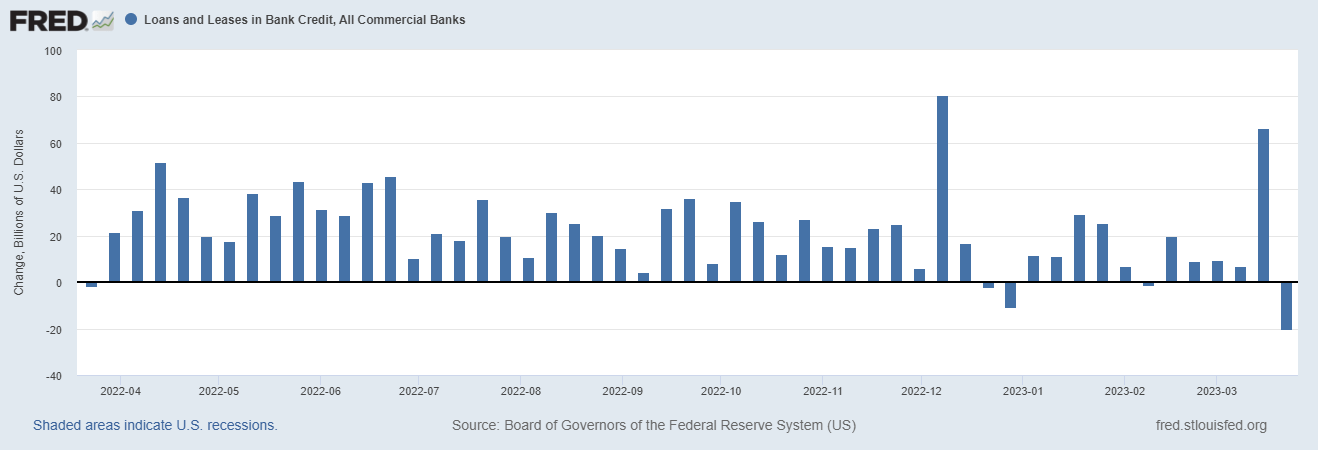
The borrowing activity of banks from the Fed and FHLB has slowed down. This comes after a previous week in which borrowing from these institutions was particularly high, with banks taking out $544 billion in loans. The borrowing activity of banks from the Fed and FHLB is an important indicator of liquidity in the banking system and suggests that banks are facing financial difficulties. However, there is still a continued trend of deposit withdrawals, with an additional $126 billion being withdrawn last week. These funds were likely invested in more liquid options such as money market funds or directly in short-term Treasury Bills.
Borrowings, All Commercial Banks (fred.stlouisfed.org)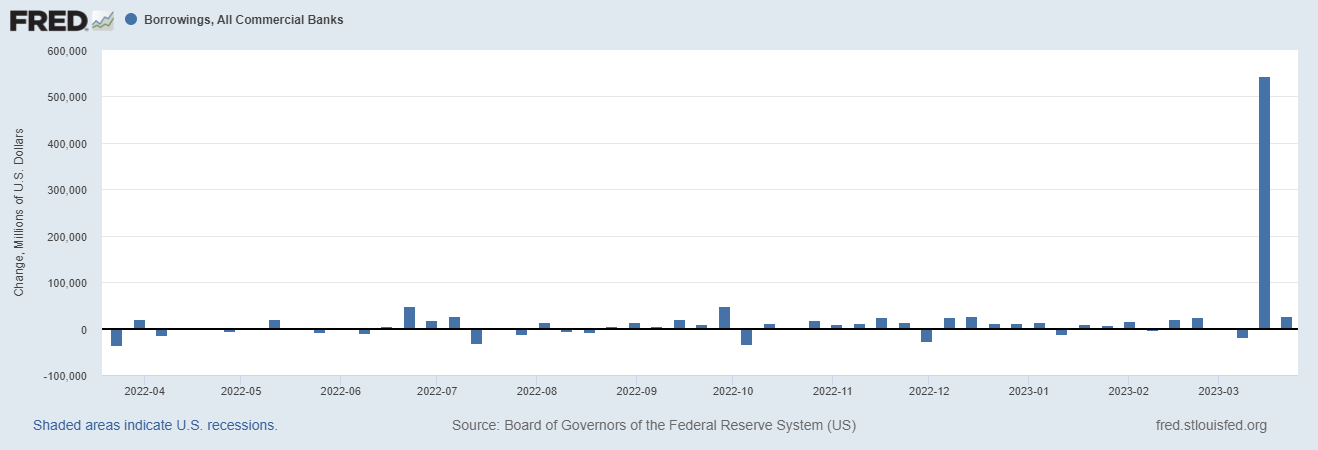
BAC’s solid financial track record and thorough risk management framework place it in a favorable position to weather the potential risks associated with an increase in loan defaults and credit losses.
Retail Activity & Inflation
The chart below displays the data for advanced real retail and food services sales. Real retail sales have been strong and have remained above the pre-pandemic trend, indicating that consumers continue to spend despite the uncertainty in the economy. This trend has persisted despite the Fed’s efforts to slow down rate hikes, which have so far been unsuccessful in reducing consumer spending. The strong consumer spending reflected in the advanced real retail and food services sales data is positive news for BAC, as it suggests that the economy is still performing well despite the ongoing uncertainty. However, the sustained strength of consumer demand also presents a challenge for the Fed in managing inflation, as they struggle to balance controlling interest rates with supporting economic growth.
Advance Real Retail and Food Services Sales (fred.stlouisfed.org)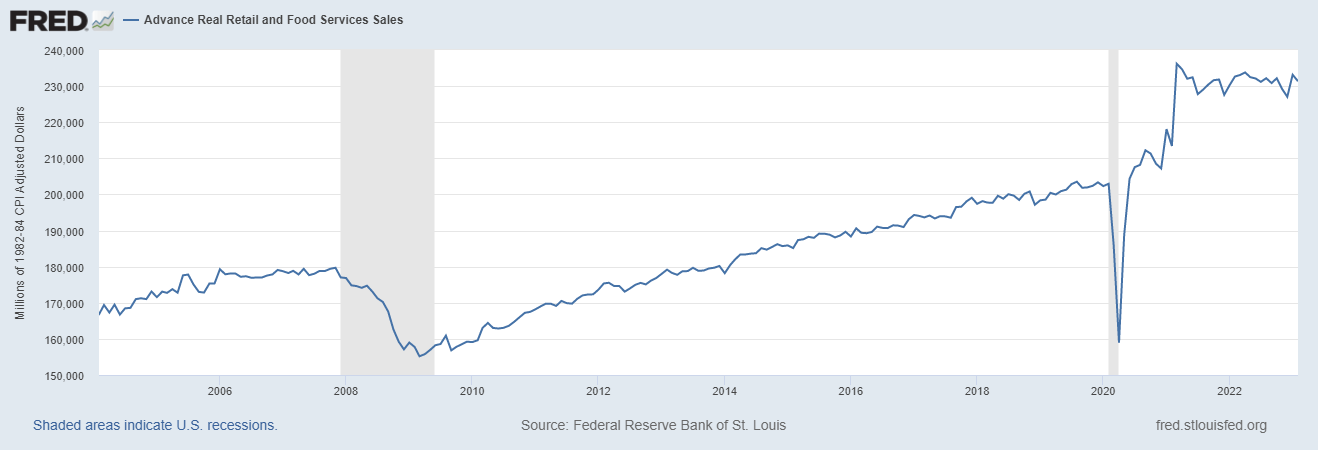
The Core PCE inflation rate is the Fed’s favored gauge of long-term inflationary pressures. It held steady at 4.6% in February, showing no change since December of the previous year, as shown in the chart below. This indicates that there was no significant increase or decrease in inflationary pressures over the past three months, which is crucial for the Fed’s efforts to manage inflation and the broader economy by controlling interest rates.
Core PCE Inflation (fred.stlouisfed.org)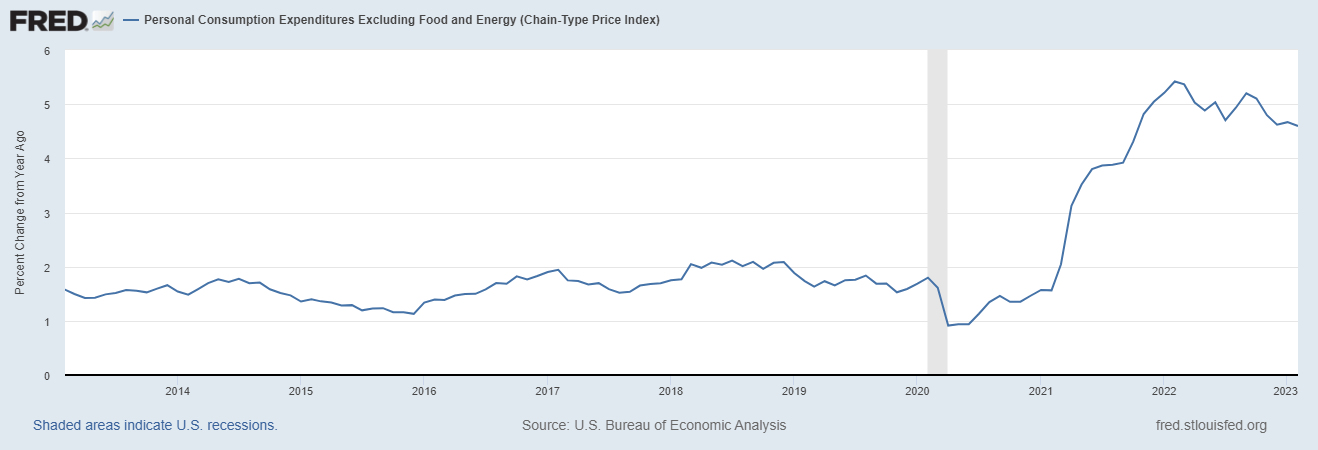
A further explanation of inflation can be seen in the chart below which suggests that there is no consistent pattern or direction in the month-to-month changes in inflation. In other words, the inflation rate is fluctuating randomly, without any clear direction. The steady Core PCE inflation rate indicates some stability in the inflationary pressures, but the lack of consistent patterns in month-to-month changes in inflation poses a challenge for predicting future trends. This uncertainty further complicates the Fed’s ability to manage inflation and the broader economy.
Core PCE Inflation (fred.stlouisfed.org)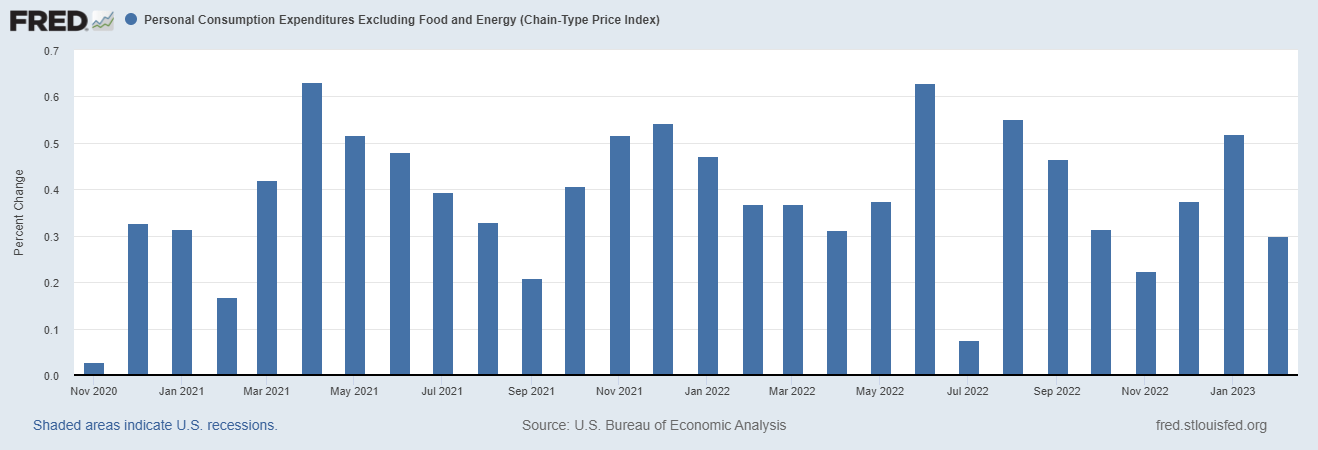
The significant challenge that Fed faces in managing inflation can further be understood by the chart below which presents the real fed funds rate, which is calculated as the difference between the federal funds rate and the Consumer Price Index. The negative values indicate instances where the real rate was negative. This chart suggests that households may experience considerable hardship as a result of the measures taken to combat rising prices.
Real Funds Rate (fred.stlouisfed.org)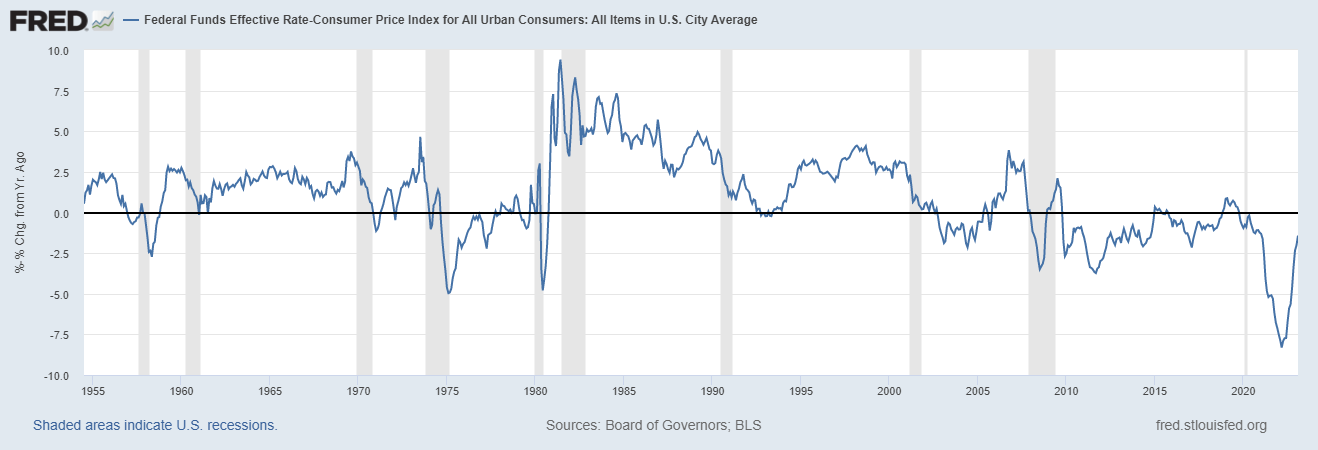
High Volatility Within Bullish Trend
While the fundamental outlook for the BAC remains strong, the technical picture is also bullish. The BAC’s long-term outlook appears optimistic, as indicated by the ascending broadening wedge shown in the chart below. This wedge spans from the lows of $4.13 in December 2012 to the highs of $48.65 in February 2022, and the price range within the wedge is gradually expanding over time. The stock’s wide price fluctuations are largely attributed to significant volatility. The COVID-19 pandemic further intensified this volatility, with the stock price soaring by 190.27% from its pandemic lows of $16.76. Presently, the stock price is hovering near the long-term support of the wedge, which is located within the $22-$25 range. Given the high volatility, this support level may experience significant deviations from the stock’s price, but BAC can likely use this support to achieve even greater heights.
Bank of America Monthly Chart (stockcharts.com)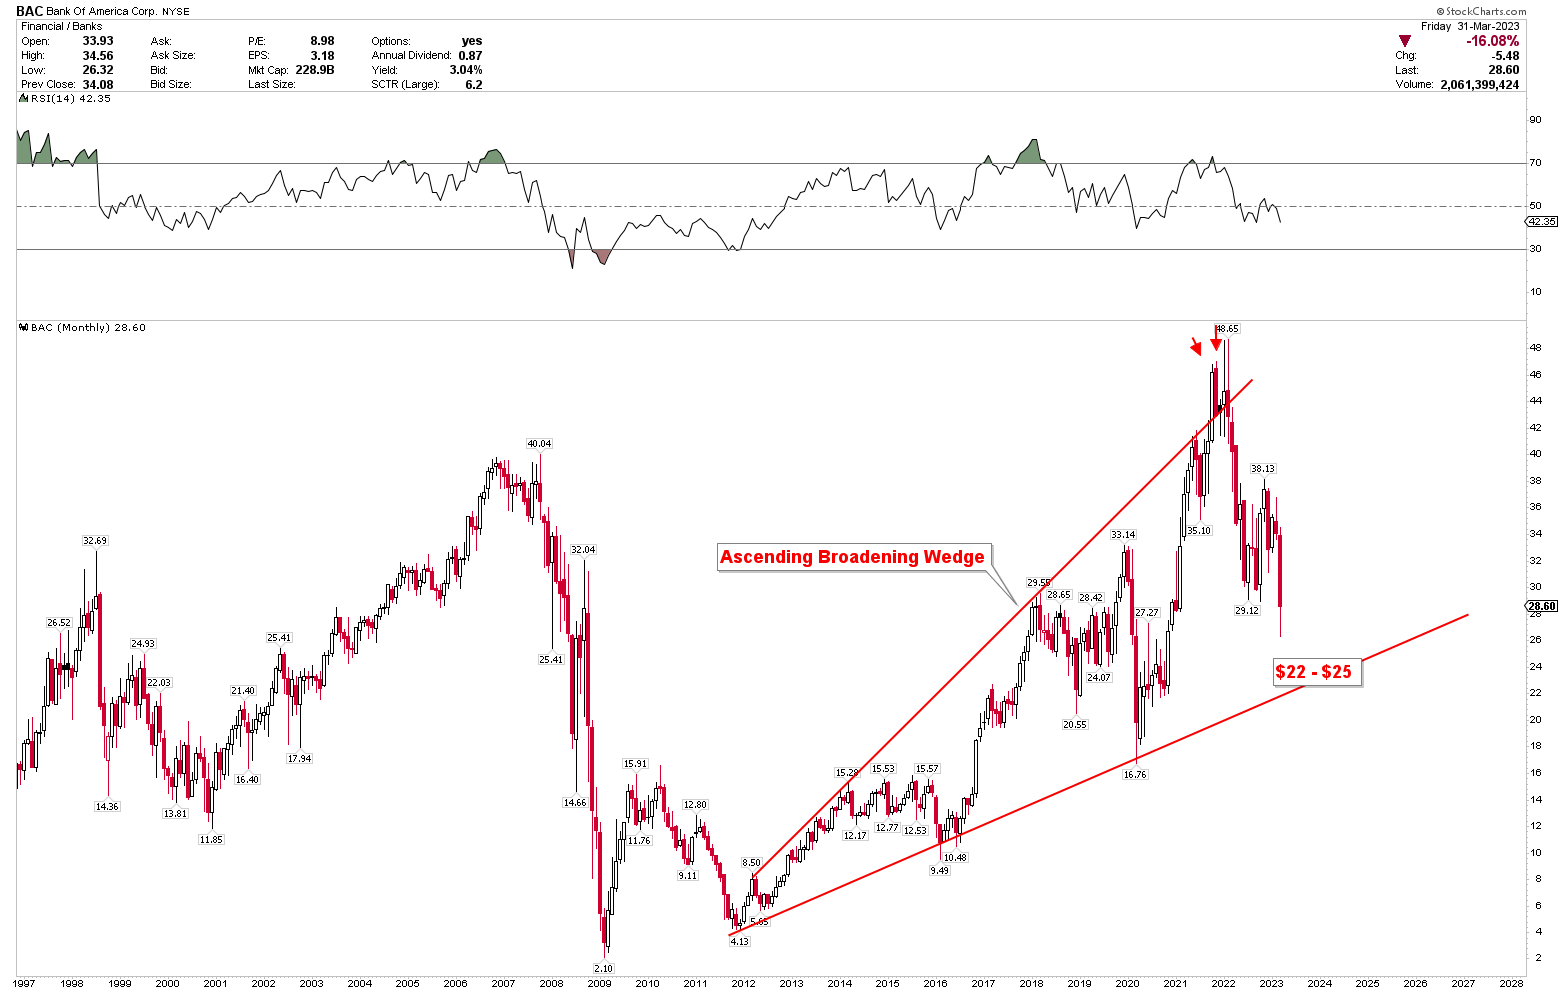
Moreover, the log chart depicts the long-term channel in which the price is trading. The current support test within this channel resembles the support tests of 2011, 2016, and 2020, during which prices experienced significant upward surges. As previously discussed, BAC has been showing bullish patterns with a critical level at $38. A breach of this level would create opportunities for further gains. However, this key level remained unbroken, with the highest price reaching only $38.13 in November 2022, leading to a considerable drop in the stock price. Nonetheless, long-term investors view this price decline as a chance to invest in the stock at a lower price.
Bank of America Monthly Chart (Log) (stockcharts.com)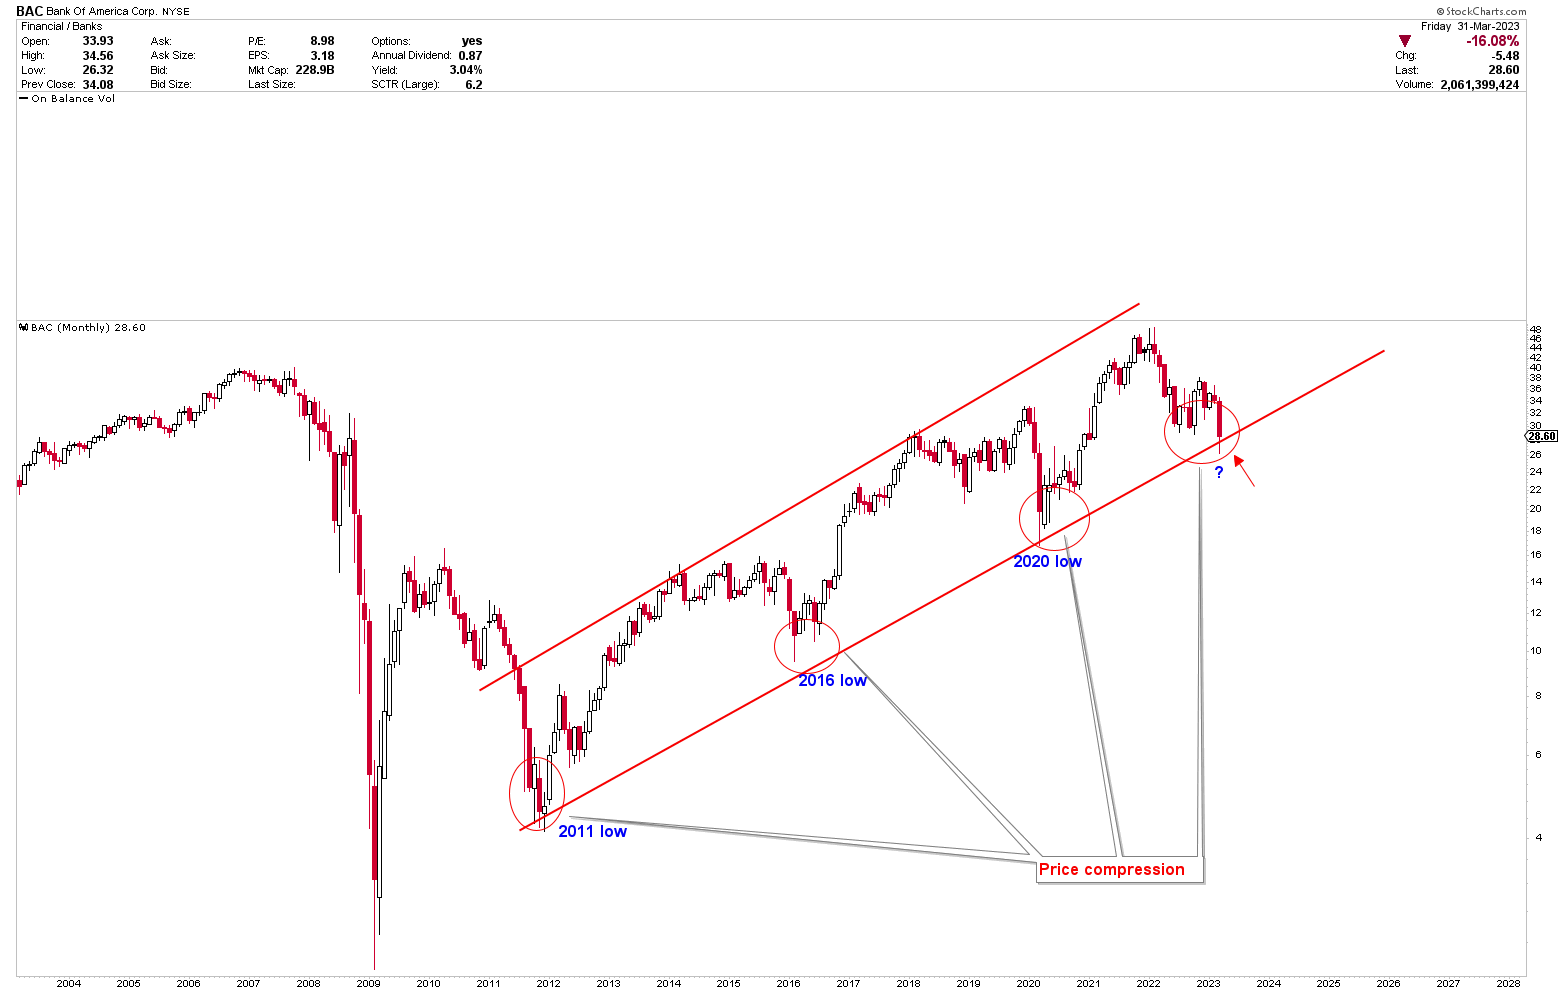
Key Action for Investors
The collapse of SIVBQ resulted in a liquidity and financial crisis, which attracted the attention of larger banks like BAC. As a result, BAC experienced an increase in deposits, which could boost the bank’s profitability and reduce the risk of the impact of economic fallout on BAC. Investors may view BAC as a safe option during such crises. The stock price initially fell due to fear in the financial industry, but the drop presents a great opportunity for long-term investors to consider buying at a lower level.
The emergence of a falling wedge increases the bullish outlook for BAC and indicates that any drop in the price of BAC is considered a strong buying opportunity for investors. These patterns also indicate that a break above $38 could spark new upward momentum for BAC. Investors can consider buying in the support region of $22-$25 or buying after the breakout of $38.
Bank of America Weekly Chart (stockcharts.com)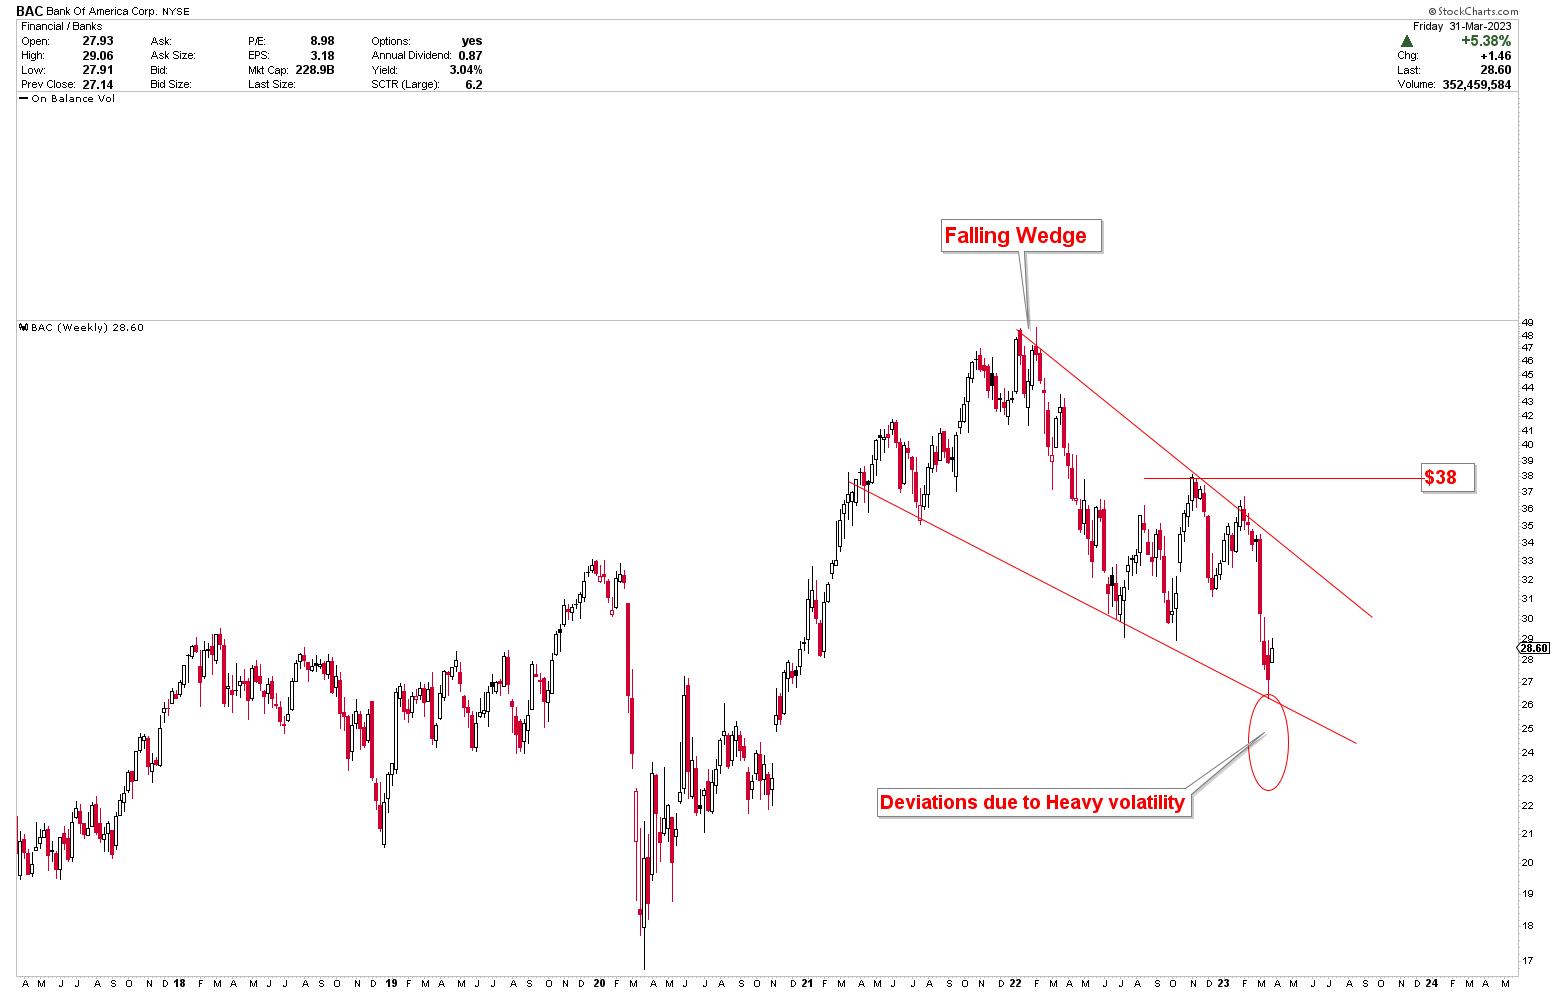
Risks
The financial crisis has brought significant challenges to the market, leading to a high degree of uncertainty. This increased uncertainty poses a significant risk to the banking sector, and stock prices have become more volatile as seen in the technical analysis. The stock prices of BAC have shown an ascending broadening pattern, which is characterized by wider price ranges within the wedge. If the price falls below $20, the ascending broadening wedge will be broken, potentially leading to a significant drop in BAC’s stock price. Such a break could also suggest that the bank may remain at lower price levels for an extended period. However, given the current market conditions, this scenario is not expected.
Final Thoughts
In conclusion, the banking industry is currently facing several challenges, including the collapse of SIVBQ, the negative impact on investor confidence, and the scrutiny of other banks. Bank of America Corporation may profit from this financial crisis, but the unfavorable Treasury yield curve and reduction in bank lending may lead to a contraction in economic activity. Furthermore, banks are tightening lending standards and reducing credit availability, which could have significant implications for borrowers and the wider financial system. The instability among regional banks is also affecting the growth of credit, and the borrowing activity of banks from the Fed and FHLB.
Meanwhile, advanced real retail and food services sales indicate that consumers continue to spend despite the uncertainty in the economy, which is positive news for Bank of America Corporation. However, sustained strength in consumer demand also presents a challenge for the Fed in managing inflation. The steady Core PCE inflation rate shows some stability in inflationary pressures, but the lack of consistent patterns in month-to-month changes in inflation poses a challenge for predicting future trends. Therefore, the banking industry must remain vigilant in the face of these challenges to ensure the continued growth and stability of the financial system.
Bank of America Corporation’s technical analysis reveals the emergence of a falling wedge pattern, which is widely recognized as a strong bullish indicator. The next rally in BAC’s price is expected to occur after a breakout above $38. However, the current drop in BAC’s stocks presents a promising investment opportunity for investors to buy at lower levels. Long-term investors may also consider buying at the $22 to $25 region due to the presence of strong long-term support.
Editor’s Note: This article discusses one or more securities that do not trade on a major U.S. exchange. Please be aware of the risks associated with these stocks.
Analyst’s Disclosure: I/we have no stock, option or similar derivative position in any of the companies mentioned, and no plans to initiate any such positions within the next 72 hours. I wrote this article myself, and it expresses my own opinions. I am not receiving compensation for it (other than from Seeking Alpha). I have no business relationship with any company whose stock is mentioned in this article.
Seeking Alpha’s Disclosure: Past performance is no guarantee of future results. No recommendation or advice is being given as to whether any investment is suitable for a particular investor. Any views or opinions expressed above may not reflect those of Seeking Alpha as a whole. Seeking Alpha is not a licensed securities dealer, broker or US investment adviser or investment bank. Our analysts are third party authors that include both professional investors and individual investors who may not be licensed or certified by any institute or regulatory body.