Summary:
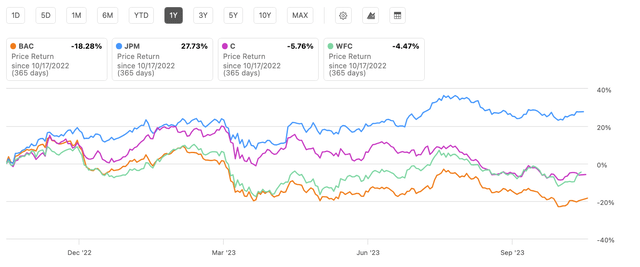
- Despite announcing Q3 2023 results, Bank of America’s stock rose by 1.8%, even though it underperformed its peers over the past year, declining by 18%.
- Bank of America stands out with its resilient customer profile and stabilized net interest margin, making it potentially better positioned for 2024.
- Amidst rising rates, Bank of America witnessed a 0.4% sequential growth in deposits while competitors saw declines.
- Bank of America’s stock valuation is considered attractive when compared to other banking giants like JPMorgan, Citigroup, and Wells Fargo, especially considering its more defensive business mix.
hapabapa
Market Reaction and Stock Performance
Bank of America (NYSE:BAC) recently announced third quarter 2023 results on October 17th. The stock rose 1.8% during the day. In fact, Bank of America has underperformed its peers over the past year, with the stock down 18% versus its peers. But we believe these worries discount the strength of Bank of America’s diversified business mix tilting toward the resilient U.S. consumer. As we will explore, prudent cost discipline and focus on digitally-savvy customers should allow the bank to navigate today’s crosscurrents.
Comparative Performance Against Peers
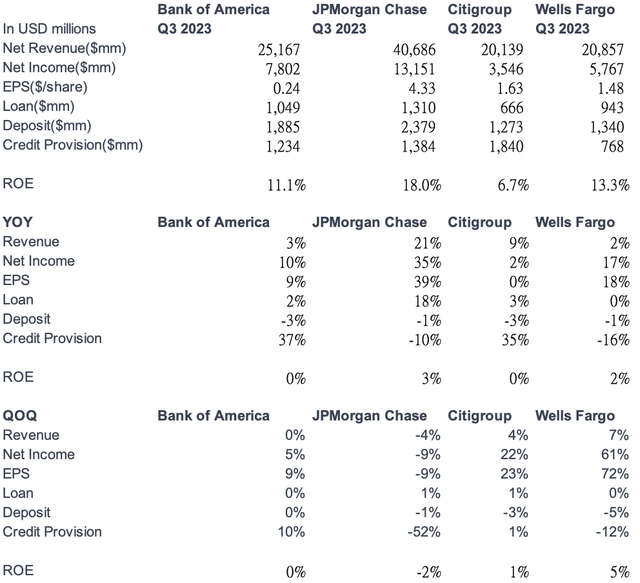
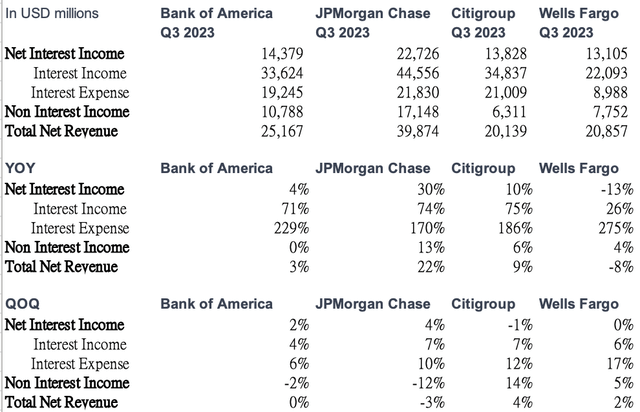
We believe the market was unimpressed by the results because revenue and EPS growth of 0% and 9% quarter-over-quarter were not particularly robust, trailing Citigroup (C) and Wells Fargo (WFC) this quarter. However, we see a more resilient customer profile and healthier net interest margin at Bank of America versus peers, better positioning it for 2024.
Resilience in Customer Profile and Net Interest Margin
Excluding the impact of JPMorgan Chase (JPM)’s acquisition of First Republic Bank, evaluating sequential quarter-over-quarter performance provides a better gauge than year-over-year growth, which is skewed by rate hikes.
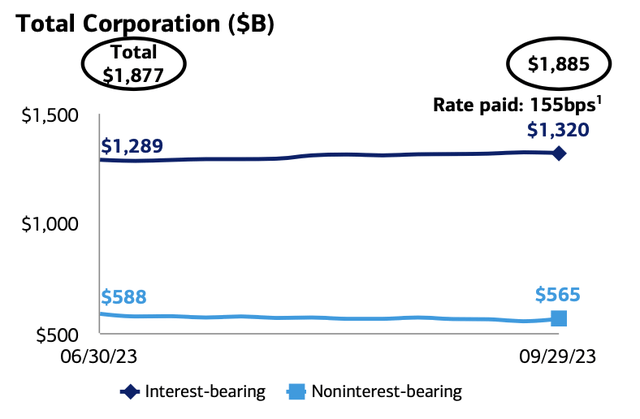
The market seems to have overlooked Bank of America being the only bank stabilizing deposit balance sequentially, up 0.4% amid rising rates, while peers continued to see deposit declines.
Deposit Balances Resume Growth and Its Implications
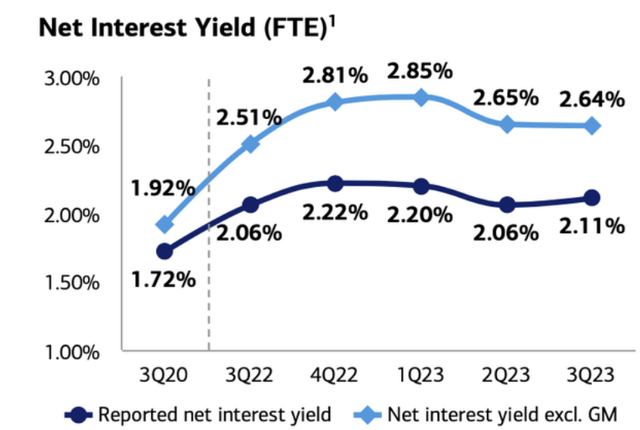
Additionally, Bank of America stabilized its net interest margin, outperforming its peers. Looking at the net interest margin ex-global markets, the core consumer segment expanded from 2.06% to 2.11% quarter-over-quarter as shown below. This leads us to believe Bank of America is better at adapting to higher rates than competitors, with tailwinds emerging this quarter.
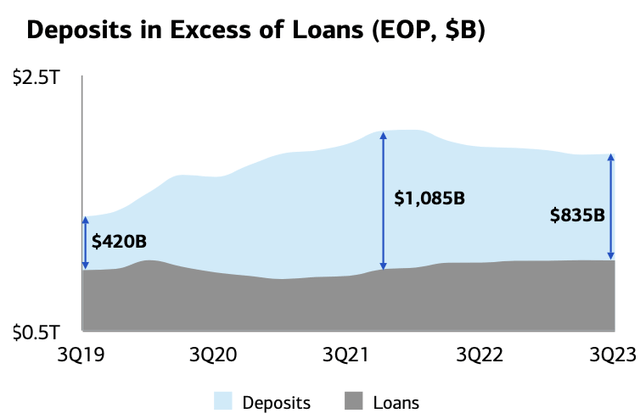
The deposit growth was driven by higher interest-bearing accounts, which pressured the quarterly results since loan growth lagged. But we don’t view higher deposit levels negatively, as they provide the foundation for future loan expansion. In fact, we see this short-term drag as a long-term positive for Bank of America versus its peers.
Non-Interest Income and Market Conditions
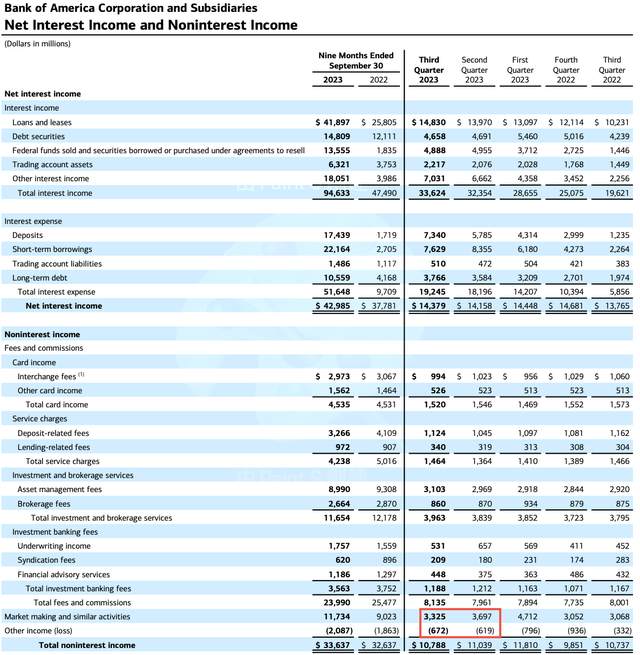
The market also didn’t like Bank of America’s flat quarterly revenue growth. This stemmed from a 2% decline in non-interest income while Wells Fargo and Citi grew non-interest income to cushion net interest headwinds.
However, breaking down non-interest income shows the core franchise remains strong. The decline was due to weak capital markets activity reducing market-making income – a temporary issue tied to sluggish third-quarter capital market conditions rather than the underlying commercial bank business. Hence, the non-interest income headwind doesn’t concern us.
Active User Growth
Another key metric is active user growth, which we view as the most important indicator of business health, with profits and balances eventually following. We are encouraged to see continued expansion amid a difficult environment, especially given the fierce competition from fintechs blurring the lines between digital and traditional banks.
BAC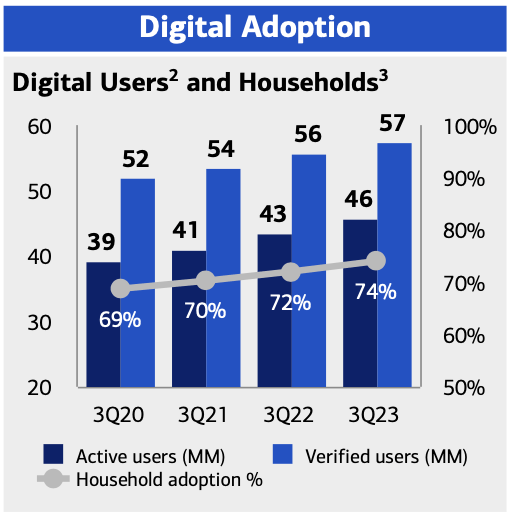
Earnings Growth and Efficiency Ratio
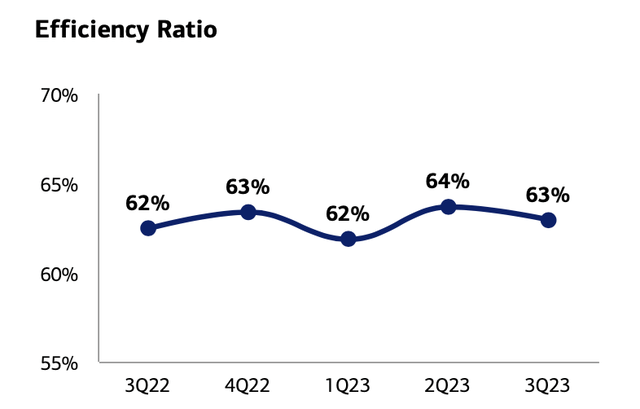
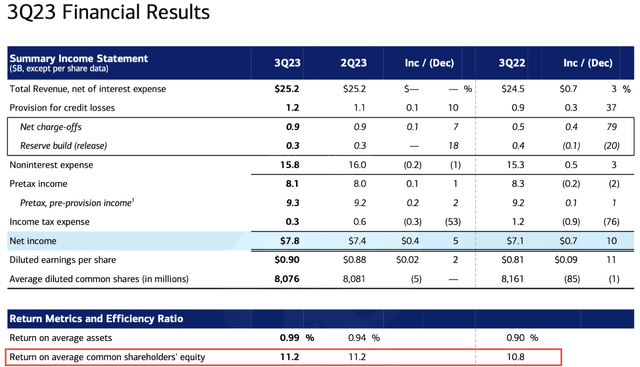
Despite top-line headwinds, EPS grew 9% sequentially driven by disciplined cost control keeping the efficiency ratio steady.
Bank of America maintained an 11.2% ROE this quarter, surpassing our internal threshold for stocks based on the cost of equity. We use a simple rule of thumb – filtering for stocks with ROE above 11% makes sense if the Fed sustains high rates into 2024. This 11% hurdle rate is calculated using a 5% risk-free rate and a 6% equity risk premium.
With Bank of America’s ROE exceeding 11% and improving 40 basis points year-over-year, it passes this cost of equity test. In contrast, JPMorgan’s higher 18% ROE declined 2% sequentially, likely related to its acquisition of First Republic Bank.
So while JPMorgan boasts a superior absolute ROE, the trend shows some erosion versus steady improvement for Bank of America recently. Additionally, JPMorgan shares trade at a hefty premium to Bank of America, making JPMorgan less attractive currently despite higher profitability.
Valuation Comparison
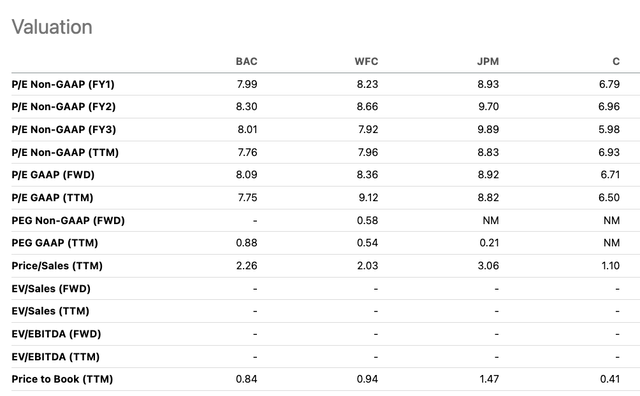
Valuing Bank of America’s stock at just 7.9x P/E and 0.84x P/B looks inexpensive relative to JPMorgan trading at 10x earnings with a 1.5x price-to-book multiple.
Citi has even lower P/E and P/B ratios near 6.8x and 0.4x respectively. However, its 6.7% ROE falls materially short of our 11% cost of equity hurdle, indicating challenged profitability.
Wells Fargo merits a mild premium to Bank of America based on an 8.2x P/E and 0.94x P/B. But its business mix leans more toward rate-sensitive lending in mortgages and auto, facing larger headwinds from Fed hikes versus Bank of America’s greater exposure to resilient consumer spending.
Therefore, Bank of America offers an attractive intersection of discounted valuation multiples and a core consumer banking franchise better insulated from rising rates. With lending tilted toward credit cards, wealth management, and other areas sustaining solid demand, Bank of America is best positioned among peers for 2024 in our view. Considering its combination of defensive business mix and undemanding valuation, we see compelling risk-reward buying Bank of America shares at current levels compared to other major banks.
Risks
While a macroeconomic slowdown is possible in 2024, Bank of America appears best positioned as the only bank stabilizing net interest margin and returning deposits to growth. This indicates it would be less impacted than peers if rates remain high.
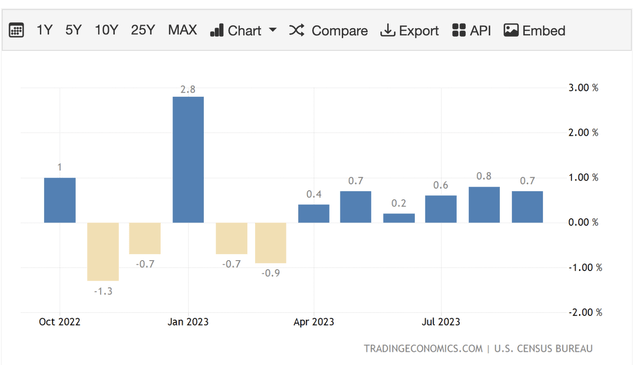
Compared to Citi, Bank of America’s US concentration is a risk given the uncertainty of whether developed markets will outperform emerging markets in 2024. However, resilient US consumer spending, evidenced by strong retail sales, provides positive momentum for now.
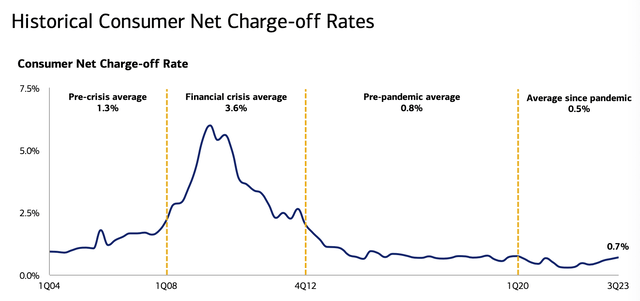
It’s true Bank of America saw an uptick in its consumer charge-off rate this quarter. However, assessing longer-term trends, the bank’s overall consumer credit profile still appears healthy. As the chart below illustrates, even after edging higher in Q3, the consumer charge-off rate remains low at 0.7% – below the nearly 1% rates prevailing before the pandemic in 2019.
This illustrates Bank of America entered the current economic slowdown with consumers having gone through a positive credit rebuilding cycle, leaving them on stronger footing. We attribute this to prudent underwriting discipline and maintaining borrower quality. As a result, while some deterioration is expected amidst rising recession worries, Bank of America’s consumer book seems well-prepared to withstand a moderate pullback without excessive credit losses.
Conclusion: Bank of America’s Bull Case and Recommendation
We believe Bank of America’s healthy core consumer franchise remains intact, supporting the bull case. It has also proven adept as the first bank to return deposits to growth and normalize net interest margin, demonstrating management strength. With solid US consumer spending despite temporary inflation fluctuations, Bank of America looks best positioned for 2024 given the uncertain macro backdrop. And its valuation seems underestimated relative to peers, providing additional cushion. For these reasons, we rate Bank of America shares a Strong Buy.
Analyst’s Disclosure: I/we have a beneficial long position in the shares of BAC either through stock ownership, options, or other derivatives. I wrote this article myself, and it expresses my own opinions. I am not receiving compensation for it (other than from Seeking Alpha). I have no business relationship with any company whose stock is mentioned in this article.
Seeking Alpha’s Disclosure: Past performance is no guarantee of future results. No recommendation or advice is being given as to whether any investment is suitable for a particular investor. Any views or opinions expressed above may not reflect those of Seeking Alpha as a whole. Seeking Alpha is not a licensed securities dealer, broker or US investment adviser or investment bank. Our analysts are third party authors that include both professional investors and individual investors who may not be licensed or certified by any institute or regulatory body.

