Summary:
- Bank of America is a large and complex financial institution with four primary operating segments.
- Each of these tell an interesting story about the bank and they demonstrate how the firm operates as a whole.
- In all, the company looks to be really solid and shares are cheap on both an absolute basis and relative to similar firms.
Spencer Platt/Getty Images News
With a market capitalization of over $213 billion, Bank of America (NYSE:BAC) is not only one of the largest financial institutions on the planet but also one of the largest publicly traded companies, period. Despite this massive size, shares have actually taken a beating over the past year. The stock is currently down 30.7% from its 52-week high and is up only 5.1% from its 52-week low. This is in spite of the fact the overall financial performance for the bank has been improving, not only in prior years, but also for 2023 so far relative to 2022. Shares look cheap on both an absolute basis and relative to similar firms. And while some of the operating segments of the company have shown volatility, the overall trajectory of the business looks positive. Given these factors, I have no choice but to rate the bank a solid ‘buy’ to reflect my view that shares are likely to outperform the broader market for the foreseeable future.
A Big Firm With a Solid Track Record
If you ever feel like punishing yourself, you should read the entire annual report of Bank of America. Coming in at 176 pages, it’s not the longest annual report that I have seen of a publicly traded company. But it is certainly up there. While I say this partially in jest, this does go to illustrate that the company is a large and complex web of operations. In addition to a corporate segment that handles miscellaneous operations, the company has four primary operating segments, with each one having various companies within it.
To best understand Bank of America as a whole, it would be helpful to dig into each of these units in order to understand what makes the company tick and where its greatest performance lies. So to do this analysis justice, I’ve decided to take that approach. The rest of this article will be divided up into six pieces. The first will look at each of the four segments, while the fifth will focus on the enterprise in its entirety. The final will just be the conclusion. So for the sake of brevity, let’s dive in.
Consumer Banking
At the top of the list, we have the Consumer Banking fragment to the company. Using data from 2022, this unit accounted for 40.5% of the company’s overall sales, making it the largest set of operations under the Bank of America umbrella. This particular segment is really comprised of two primary operations. The first of these is the Deposits business, while the second is the Consumer Lending business.
Deposits, as the name suggests, includes the results of the consumer deposit activities that the company engages in for consumers and small businesses. This is what you would refer to as the traditional banking activities of the company, with management accepting funds that flow into traditional savings accounts, checking accounts, CDs, IRAs, and more. Under this unit, the company also handles investments on behalf of consumers. The Consumer Lending part of the company, meanwhile, offers products to consumers and small businesses, with examples being debit cards and credit cards, residential mortgages, loans for automobiles and recreational vehicles, consumer personal loans, and more.
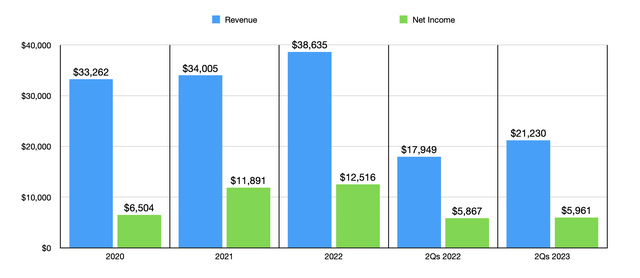
In recent years, the Consumer Banking segment has posted fairly attractive growth. Revenue has expanded 16.2% from $33.26 billion in 2020 to $38.64 billion in 2022. Much of this expansion has occurred thanks to growth in deposits and the growth in assets that the rise in deposits has made possible. Deposits at the bank expanded from $823.67 billion to $1.07 trillion. Although the company has to pay interest on deposits, meaning that overall costs increased in response to the deposit growth, management makes sure, just like with any bank, to lend those deposits out. This has resulted in the value of interest earning assets under this unit climbing from $858.72 billion to just under $1.10 trillion. This doesn’t necessarily mean that growth is guaranteed. By the end of the second quarter of this year, for instance, both deposits and interest earning assets at the bank had fallen, dropping to $1 trillion each, respectively. Even with the decline in deposits and assets, a rise in interest rates has allowed revenue to grow from $17.95 billion in the first half of last year to $21.23 billion the same time this year.
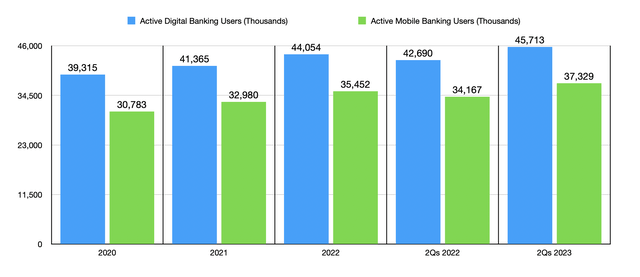
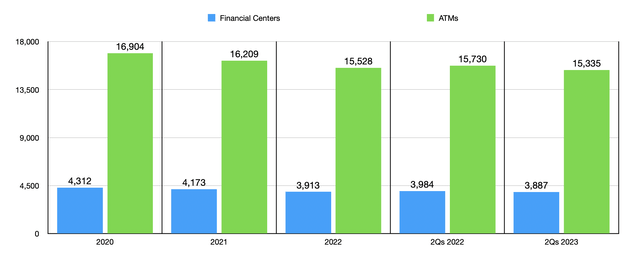
While it’s likely that existing customers have increased their deposits in the bank over time, there is an element of growth involving new clients that is necessary in order for growth like this to occur. There are two primary ways that management measures this for this particular segment. The first involves the number of active digital banking users. This number has increased in recent years, climbing from 39.32 million in 2020 to 44.05 million in 2022. By the end of the second quarter of this year, the number had grown further to 45.71 million. The second way involves what management calls active mobile banking users. This has also increased in recent years, climbing from 30.78 million over three years ago to 37.33 million today. Perhaps unsurprisingly, this growth has occurred even as the number of financial centers at the company have declined and as the number of ATMs have followed suit as can be seen in the chart below. With everything turning digital, I suspect this trend will continue for some time.
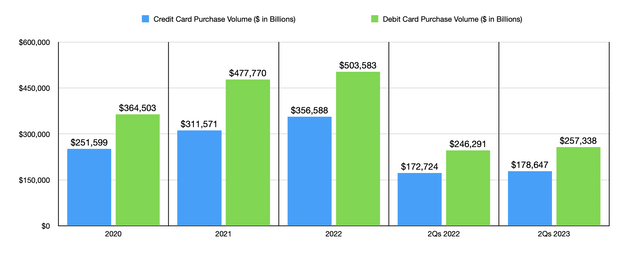
On the Consumer Lending side, Bank of America has also benefited from growth in both its credit card and debit card activities. Purchase volume for the credit cards that are in the company’s name has grown from $251.60 billion in 2020 to $356.59 billion in 2022. In the first half of this year, they totaled $178.65 billion. That’s up from the $172.72 billion reported one year earlier. Purchase volume for debit cards has also risen in recent years as well, as you can see in the chart below.
So long as nothing goes wrong, growth in revenue often brings with it growth in profits. From 2020 through 2022, net income associated with the Consumer Banking segment has jumped from $6.50 billion to $12.52 billion. In the first half of this year, growth has continued, rising from $5.87 billion in 2022 to $5.96 billion now.
Global Wealth & Investment Management
Next in line, we have the Global Wealth & Investment Management segment. This particular segment consists of two main businesses. The first of these is Merrill Wealth Management, which is an advisory business in the financial space that’s dedicated to clients with assets of more than $250,000. And the other is known as Bank of America Private Bank. Its emphasis is on working with high-net-worth clients and ultra-high net worth clients. On top of this, it also provides specialty asset management services and engages in other various related activities.
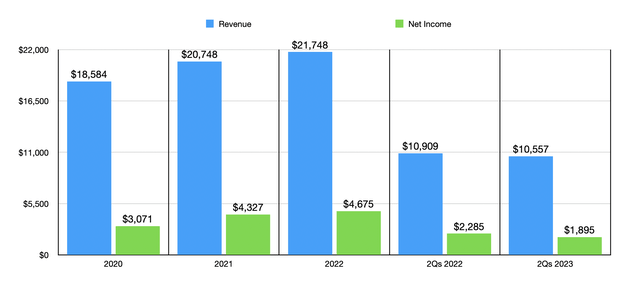
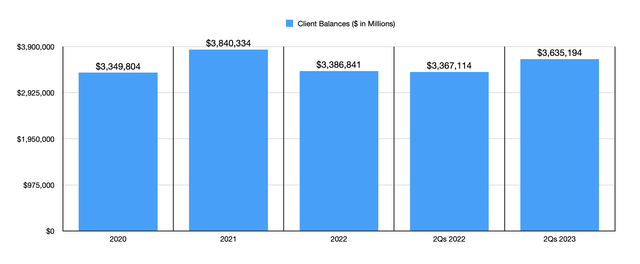
This is actually the third largest of the company’s segments, accounting for 22.8% of the company’s revenue last year. Sales between 2020 and 2022 expanded from $18.58 billion to $21.75 billion. Unlike the much more stable Consumer Banking segment, Global Wealth & Investment Management has seen some meaningful volatility from an asset perspective in recent years. Total client balances, for instance, popped from $3.35 trillion in 2020 to $3.84 trillion in 2021. After that, in 2022, they fell back to $3.39 trillion. We have seen some growth recently this year, with balances expanding again to hit $3.64 trillion. But as you can see, there is not any consistent trend if confined to just the past few years.
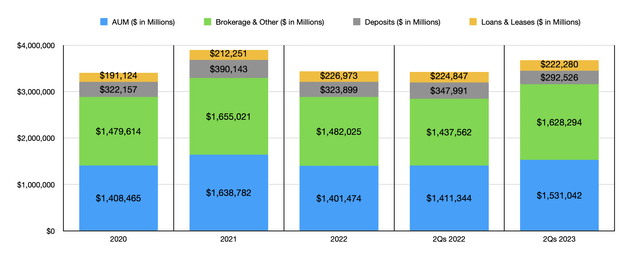
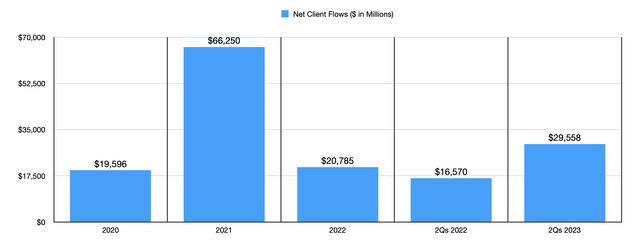
As you can see in the chart above, most of the volatility comes from assets under management and brokerage and other assets. And much of that volatility can really be attributed to market fluctuations. In 2022, for instance, the stock market experienced significant downside, with the S&P 500 dropping 19.4%. So it’s not a surprise to see that assets under management for the bank declined by $258.1 billion. Even so, clients have remained optimistic, pumping in many billions of dollars worth of new assets. Even last year when the market performed very poorly, net client flows were positive to the tune of $20.79 billion. And so far this year, the $29.56 billion in net inflows is nearly double the $16.57 billion reported the same time last year. It is worth noting that, despite the net inflows seen so far this year, revenue has dipped slightly from $10.91 billion to $10.56 billion.
With revenue at the segment rising, net profits have also improved. Net income jumped from $3.07 billion in 2020 to $4.68 billion in 2022. So far this year, however, we have seen some weakness. Net income in the first half of the year totaled just under $1.90 billion. That’s down from the $2.29 billion reported the same time last year. Actual net interest income for this segment grew by about 6% thanks to higher interest rates. However, the company reported a roughly 9% decline in income associated with investment and brokerage services. This caused substantially all of the pain on the top and bottom lines and can really be chalked up to lower asset management fees and brokerage fees because of lower average equity and fixed income market levels and lower transactional volumes.
Global Banking
The second largest segment under the Bank of America name is called Global Banking. This particular enterprise includes the Global Corporate Banking, Global Commercial Banking, Business Banking, and Global Investment Banking units of the conglomerate. A great deal could be written about each of these individually. But in a nutshell, these parts of the company really focus on offering lending related products and services, as well as working Capital Management, treasury solutions, underwriting and advisory services, and more. A lot of the lending products involve commercial loans, leases, trade financing, real estate lending, and more. Merchant services, underwriting debt, handling equity issuances, performing equity research, providing financing for middle market companies and not-for-profit organizations, and providing financial advice and other solutions, are just a few of the many different activities that these subsidiaries engage in.
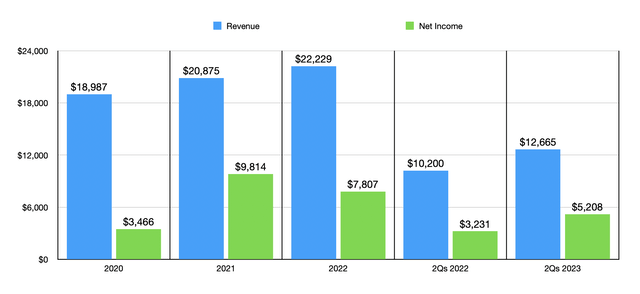
In the three years ending in 2022, this segment had exhibited impressive revenue growth, with sales expanding from $18.99 billion to $22.23 billion. This revenue expansion came about even in spite of weakness on the investment banking side. In 2022, for instance, the Global Banking segment generated investment banking fees of only $2.93 billion. That’s a little over half the $5.01 billion reported one year earlier. This drop can really be attributed to a reduction in equity issuances, debt issuances, and advisory fees, likely because of the impact that rising interest rates had on companies seeking capital. Had it not been for this, revenue for the segment actually would have risen further. From 2021 to 2022, for instance, revenue associated with the Global Corporate Banking, Global Commercial Banking, and Business Banking segments of the company shot up 27.3% from $15.14 billion to $19.27 billion. This came even as deposits under these three units combined fell from $551.72 billion to $498.66 billion. The growth, according to the data provided, came largely from a rise in total loans and leases, with the higher balances and an increase in interest rates working to the company’s favor.
Unlike the Global Wealth & Investment Management segment, Global Banking reported growth in revenue for the first half of this year, with sales of $12.67 billion comfortably beating out the $10.20 billion reported one year earlier. Although deposits remain depressed compared to the same time last year, an increase in loans and leases from $376.27 billion to $382.86 billion helped the company considerably. However, the investment banking fees for the enterprise still remain under pressure. But that hasn’t stopped net profits from rebounding after a difficult 2022 fiscal year. In the first half of this year, net profits for the segment totaled $5.21 billion. That’s significantly higher than the $3.23 billion reported one year earlier.
Global Markets
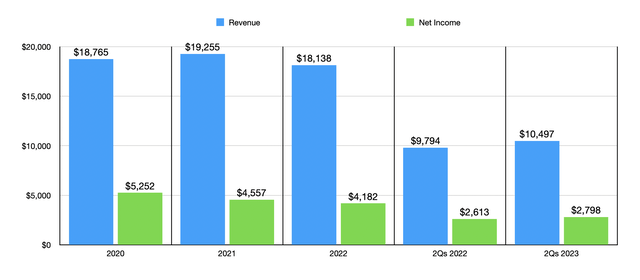
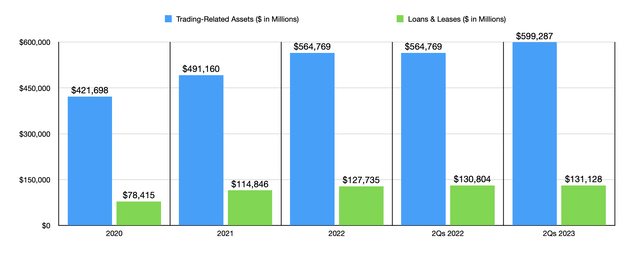
At long last, we have the final of the four major operating segments. This one is known as Global Markets and, according to the data provided, it focuses on the sale and trading services of the company, as well as research services to institutional clients. The company touches on all sorts of securities here, including equity securities and fixed income securities. It also is engaged in credit, currencies, commodities, and more. This is the smallest of the four segments, accounting for only 19% of the firm’s revenue last year. And unlike the other three segments, this one has not been all that impressive from a growth perspective. In fact, the $18.14 billion in revenue that the company generated in 2022 was lower than the $18.77 billion reported in 2020. This is in spite of the fact that trading related assets and loans and leases continue to grow. For instance, at the end of 2022, trading related assets for the segment came in at $564.77 billion. That’s roughly 15% above the $491.16 billion reported one year earlier. And loans and leases expanded about 11% from $114.85 billion to $127.74 billion.
The revenue stream associated with this particular segment is rather complicated. I say this because there are multiple ways in which the company makes money and because what can be positive for one part of the business can be negative for the other. As an example, from 2021 to 2022, net interest income contracted by 23% and investment banking fees plummeted by 50%. But at the same time, market making and related activities revenue popped up 30%. In the first half of this year, revenue for this segment managed to climb to $10.50 billion compared to the $9.79 billion reported the same time last year.
Unfortunately, profitability from this segment has been a real drag over the past few years. Back in 2020, for instance, net income totaled $5.25 billion. But by 2022, it had fallen to $4.18 billion. Management has attributed this drop mostly to the lower revenue of the company. We did see something of a reprieve in the first half of 2023, with net profits of $2.79 billion beating out the $2.61 billion reported the same time last year. But it is clear that only a sustained increase in revenue will allow net profits to also grow moving forward.
The Big Picture
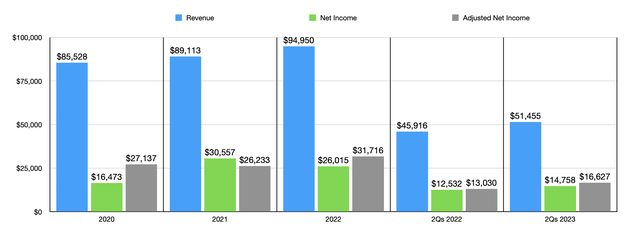
Now that we have some deeper understanding of Bank of America as a whole, it’s time to put the pieces together. The fact of the matter is that, even though we do have one fairly weak segment to deal with, the rest of the company in its entirety looks very healthy. Growth in those other areas has allowed revenue to jump from $85.53 billion in 2020 to $94.95 billion in 2022. Net profits have also increased, rising from $16.42 billion to $26.02 billion. It is important to note that net profits in 2021 were actually higher at $30.56 billion. But that needs some further discussion.
You see, one thing that I noticed while analyzing the company is the fact that there have been significant changes in the provision for credit losses of the bank. To be clear, these are expected losses of the company. But because of how volatile they are, I would argue that to get a better picture of the company as a whole, it would be important to also include a measure of what financial performance would be like without these provisions. Management does not give such an estimate. But if we strip them out and adjust for the taxes incurred in each fiscal year, we would actually see net income rise from $27.14 billion in 2020 to $31.72 billion in 2022. In this case, 2021 was actually the weak year for the company.
Financial performance has remained strong in the current fiscal year. Revenue of $51.46 billion beat out the $45.92 billion reported the same time last year. Net profits jumped from $12.53 billion to $14.76 billion, while the adjusted figure I mentioned previously would increase from $13.03 billion to $16.63 billion. We don’t really know what to expect for the rest of this year and its entirety. But if we annualize the results experienced so far, we would expect net income of $32.19 billion.
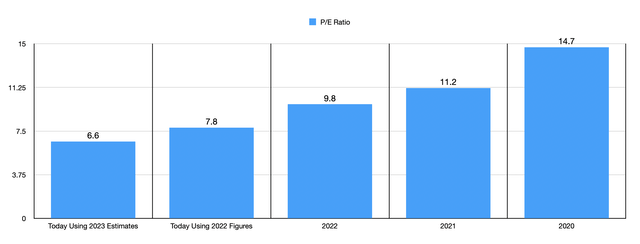
This makes it fairly simple to value the bank from an earnings perspective. As you can see in the chart above, Bank of America is trading at a forward price to earnings multiple of 6.6. If, instead, we use the data from 2022, that number would be slightly higher at 7.8. But compared to a couple of different things, both of these look low. As you can see above, over the past three years, the price to earnings multiple of the bank has declined, dropping from 14.7 in 2020 to 9.8 last year. It’s unclear why we have seen such a consistent drop during this window of time, though that may have something to do with concerns over rising interest rates and the impact that rates will have on the economy. Regardless of the cause, this does imply that shares of the bank are cheap relative to where they have traded in the past.
There is also, of course, how the bank is valued compared to similar companies. In the table below, you can see it compared with five other firms that are also massive banks. The price to earnings multiple for these banks ranges between a low of 6.6 and a high of 10.2. If we use our forward estimate for Bank of America, we will see that it is tied as being the cheapest of the group. And even if we use the data from 2022, only one of the five ends up being cheaper than it. If we average out the trading multiples of these five banks, and assume that Bank of America should trade at that average, it would imply upside over where shares are today of 31.8% if we’re relying on the forward estimate for the company and upside of 13% if we’re relying on the data from last year. Regardless, that is a decent amount of upside for such a large company.
| Company | Price / Earnings |
| Bank of America | 6.6 |
| U.S. Bancorp (USB) | 8.9 |
| Wells Fargo & Co (WFC) | 10.2 |
| JPMorgan Chase & Co (JPM) | 9.5 |
| Citigroup (C) | 6.6 |
| PNC Financial Services Group (PNC) | 8.1 |
It is worth noting that, on October 17th, the management team at Bank of America is due to report financial results for the third quarter of the company’s 2023 fiscal year. Earnings also present an opportunity for the picture of a business to change rather materially, so investors should pay attention to whatever is released. At present, analysts are forecasting sales of $25.07 billion. This would translate to a nice increase over the $24.50 billion reported the same time last year. Earnings, meanwhile, are forecasted to be $0.82 per share, or about $6.63 billion. If this comes to fruition, it would represent an improvement over the $0.81 per share seen one year earlier, or $6.58 billion.
Takeaway
All things considered, I must say that Bank of America looks to be a pretty healthy bank. Three of the four big operating segments are doing quite well and shares look very cheap, both on an absolute basis and relative to similar enterprises. Of course, as with any large institution and with any large bank in particular, we need to keep in mind that the operations in question do tend to be something of a black box. The last time we were taught this painful lesson was back in the 2008 and 2009 financial collapse. But with the data that is publicly known, I do believe that Bank of America makes for a solid ‘buy’ candidate at this time.
Analyst’s Disclosure: I/we have no stock, option or similar derivative position in any of the companies mentioned, and no plans to initiate any such positions within the next 72 hours. I wrote this article myself, and it expresses my own opinions. I am not receiving compensation for it (other than from Seeking Alpha). I have no business relationship with any company whose stock is mentioned in this article.
Seeking Alpha’s Disclosure: Past performance is no guarantee of future results. No recommendation or advice is being given as to whether any investment is suitable for a particular investor. Any views or opinions expressed above may not reflect those of Seeking Alpha as a whole. Seeking Alpha is not a licensed securities dealer, broker or US investment adviser or investment bank. Our analysts are third party authors that include both professional investors and individual investors who may not be licensed or certified by any institute or regulatory body.
Crude Value Insights is an exclusive community of investors who have a taste for oil and natural gas firms. Our main interest is on cash flow and the value and growth prospects that generate the strongest potential for investors. You get access to a 50+ stock model account, in-depth cash flow analyses of E&P firms, and a Live Chat where members can share their knowledge and experiences with one another. Sign up now and your first two weeks are free!

