Summary:
- Bank of America’s business model and solvency remain strong despite high interest rates.
- The bank has diversified revenue sources beyond loans, such as wealth management and investment banking.
- BAC’s loan portfolio growth is slower compared to competitors, but non-interest income services contribute significantly to total revenues.
- We assess BAC’s metrics compared to those of its main peers.
- We rate BAC as a buy.
tupungato
We rate Bank of America (NYSE:BAC) as a buy as we notice the bank’s business model and solvency are still strong even in the context of permanent high interest rates. The reason behind the drop in the stock price might be associated with the deterioration of held-to-maturity assets, which were mostly acquired in 2020 and 2021, given the huge injection of liquidity into the banking system to avoid disruptions in the economy in the middle of the pandemic. Even when it is understandable that the management allocates a portion of its assets to those long-term securities, probably the market is disappointed about how significant that portion is out of the total assets. We will explore these topics further since the quality of the assets of a bank is critical to resisting the hardest scenarios while being highly leveraged, given its own nature. We will compare how BAC manages its risks and its capital compared to its main peers to draw some conclusions.
Business Model and Last Results Q3 2023
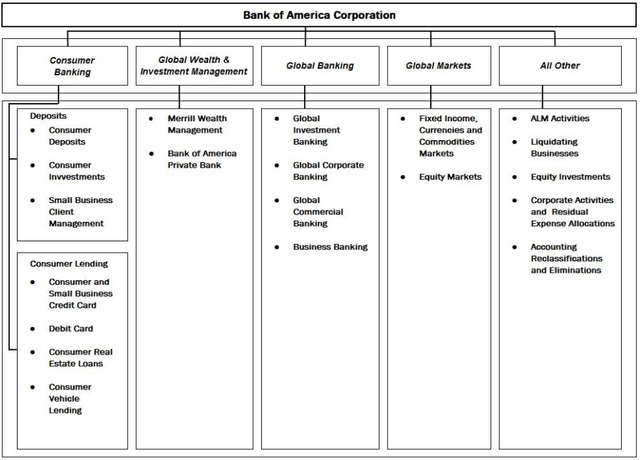
BAC not only has the typical business related to loans to consumers, real estate, enterprises, etc. but also other kinds of businesses that enable it to have more diversification in its revenue sources. Revenues associated with loans are used to require significant capital allocation to cover the risks associated with each type of loan through provisions. All this capital is just parked without any return, so that’s why banks are more interested in developing those services that do not require much capital allocation, such as those related to wealth management, investment banking, trading, etc.
There is no surprise that BAC has developed more services other than loans, as BAC has different business segments:
In the last quarterly results for Q3, we’ve seen that there was solid growth in the different BAC’s business segments:
Author, 10Q, 10K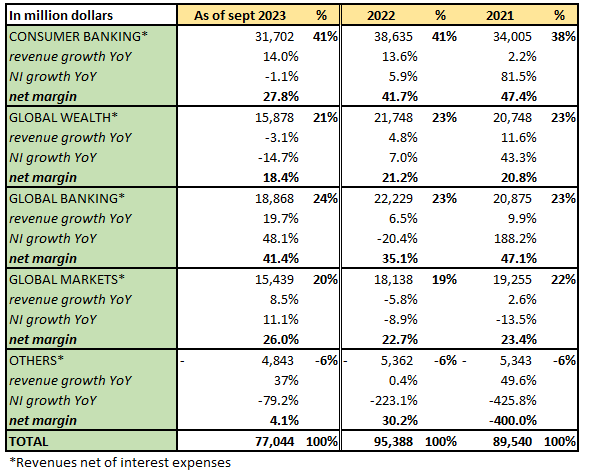
In the table above, we may see healthy revenue growth in consumer banking (CB), which is the most important segment, and in global banking and global markets, whereas global wealth experienced a slight decline as of September 2023 YoY. We added the net margins associated with each business segment to be aware of how much each of these business segments contributes to the BAC’s bottom line.
It calls our attention to the reduction of the net margins in the CB segment, which was 41.7% in 2022 and only 27.8% as of September 2023. The factor behind this reduction was the substantial increase in provision for credit losses in 2023 in this segment. Indeed, as of September 2022, CB only showed provisions for credit losses of $648 million, while the same item increased to $3,339 million in September 2023.
This increase in the provisions for credit losses was a result of the increase in the net charge-offs related to the credit card business from $948 million as of September 2022 to $1,784 million as of September 2023; the provision for credit losses associated with the credit card business represents 54% of the entire BAC’s provisions for credit losses for this period.
In general, BAC was able to show a revenue growth of 8% and a net income growth of 14.7% as of September 2023 YoY, which are very decent results in a difficult context. We should notice that most of the BAC’s assets are at floating rates while most of its liabilities are at fixed rates, which means that in the context of interest rate hikes, the BAC increases its net interest income (NII). However, if interest rates decline, BAC would experience a decline in its NII as the yield of its assets would decline as well, while the deposit rates would be flat. That’s why it’s important to have those non-interest income services to smooth BAC’s results over time.
The loan portfolio grew only 1.6% as of September 2023 YoY, whereas the loan portfolios of its main competitors, JPMorgan (JPM) and Citi (C), grew 17.8% and 3.3%, respectively, in the same period. We do not see this as something bad, as we pointed out that the credit business requires it to allocate more capital as part of regulations and risks. We’d rather see more sustainable growth in other services that require less capital allocation, such as non-interest income services, which, in the case of BAC, only grew 3% as of September 2023 YoY. Nevertheless, these non-interest income services represent 43% of the total revenues, which is a very good indicator.
The BAC’s loan portfolio is more balanced now as it has reduced its consumer portfolio, showing a lower exposure to unsecured consumer credit and home equity loans. In addition, the commercial real estate portfolio is more balanced, with less concentration in construction loans; the comprehensive capital analysis and review (CCRA), which is a stress test regime for large US banks to know if lenders have enough capital to cope with a severe economic shock, indicates a significantly lower BAC’s credit losses expected in a severe downturn.
With respect to the deposits, BAC increased its total interest-bearing deposits by 4% as of September 2023 YoY at a deposit rate of 1.82%. Its main competitor, JPM, has seen a reduction in its interest-bearing deposits of 4% in the same period, offering a higher rate for those deposits of 2.21%. For banks, deposits are the main source of funding; thus, it’s important that they show stability and predictability over the years.
BAC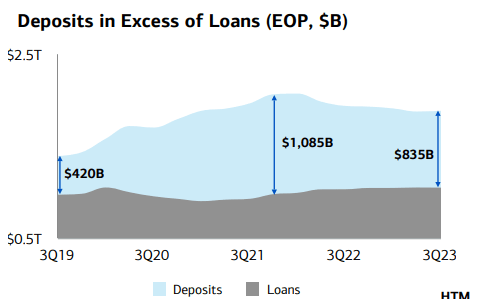
In the chart above, it’s important to notice that there is a difference between deposits and loans in Q3 2023 of $835 billion, which means that less than 50% of the total deposits have been used to finance the loan portfolio; the rest have been used to invest in high-quality liquid assets, which is an issue we will discuss later.
With respect to capital, BAC has delivered a total capital adequacy ratio of 15.4% as of September 2024, while the minimum regulated requirement is 13.9%. There was an improvement in this important ratio with respect to December 2022, when BAC delivered 14.9%. The capital adequacy ratio is calculated based on the following formula:
Capital adequacy ratio = (Tier 1 capital + Tier 2 capital)/Risk Weighted Assets
Tier 1 capital is the core capital, making it easier to calculate its worthwhile being more liquid, and Tier 2 capital is less liquid and makes it more difficult to estimate its accurate worth.
The risk-weighted assets (RWA) are the minimum required assets that banks must hold given the risk profile of their lending activities and other assets. Each type of asset receives a percentage of risk; if a bank has an important number of risky assets, it means that most of those assets will have higher percentages that make the total RWA increase substantially. If the RWA increases significantly, the capital adequacy ratio might be reduced even to a lower level than the minimum requirement set by regulations.
There is uncertainty about the effects of the new changes proposed by the FDIC on the RWA of the banks; it is estimated that these changes would make BAC’s RWA increase by 20%. As of September 2023, BAC shows a RWA of $1.63 trillion, which implies that the new regulation would increase the amount required for RWA to $1.95 trillion.
For instance, taking the minimum required capital common equity Tier 1 of 10% and the new required RWA of $1.95 trillion, BAC would need to hold at least $195 billion of capital Tier 1 common equity between 2025 and 2028 if those proposals are expected to be phased in those years. Nevertheless, BAC already has a total capital Tier 1 of common equity of $194 billion as of September 2023, so it won’t be hard to get to those required levels.
These regulations contribute enormously to having a strong and solvent US banking sector, as they prepare banks to have enough liquidity to face very hard economic scenarios. The Bank Term Funding Program is a program to reinforce confidence in the US banking sector as it offers eligible financial institutions like BAC the necessary funds to meet the needs of their depositors.
As such, the solvency and solid business model of BAC can be seen through the qualifications of its senior debt:
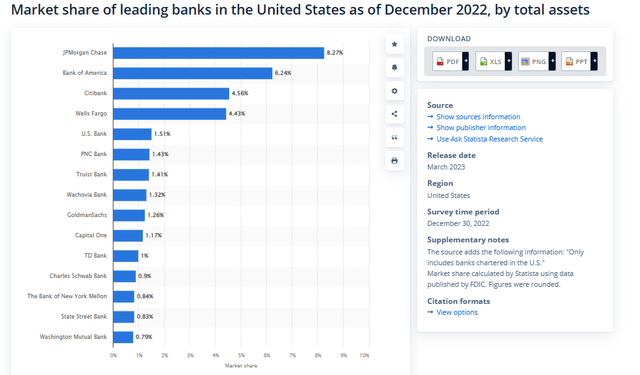
Now, once we’ve explored briefly the most important aspects of BAC, we need to compare the way it manages its capital to deliver more value to its shareholders while being conservative to make its business model more resilient. We will take JPM and C as the BAC’s main competitors based on the size of their assets:
BAC’s metrics compared to its main peers
We want to explore some important metrics in the banking industry to get interesting insights between BAC and its main competitors. Since we’ve seen that BAC is a solid bank, it would be interesting to know how good its business model is compared to those of its main competitors.
We’ve taken the average of the last 3 years in several metrics to get a clear picture of the banks’ performances over a longer period rather than just one period. In terms of provisions and loans, we may see that C has allocated higher provisions than BAC and JPM, which is understandable as this bank is more exposed to the credit card business.
In terms of return on tangible equity (ROTE) and return on equity (ROE), JPM is the bank that offers the highest profitability, which is reinforced by its higher net margins despite having allocated higher provisions than BAC’s. Also, JPM’s capital adequacy ratio is even higher than that of BAC, which means that JPM is allocating capital to assets with a better risk-reward ratio than BAC.
From each annual report of the three banks, we’ve taken the held-to-maturity (HTM) securities to know how much they represent the total assets of each bank. In addition, we’ve separated those securities whose maturities are longer than 5 years to know what the proportion of those longer-term bonds is related to the total HTM securities. We’ve separated these bonds as longer-term bonds experience a way higher sensitivity than shorter-term bonds when the interest rates are moving.
This can be seen in columns 7 and 8, where we may see that BAC has allocated more capital from its total assets into HTM securities than its main counterparts; 16% of its total assets are allocated into HTM securities, which is significant, and even worse, within those HTM securities, BAC has invested a higher proportion in longer-term bonds with a maturity beyond 5 years out of its total HTM securities than its main counterparts; 94.5% of the total BAC’s HTM securities are long-term bonds with a maturity beyond 5 years.
JPM has only allocated 9% of its total assets into these HTM securities, of which only 70% are longer-term bonds with maturities beyond 5 years. After looking into these metrics, BAC has been affected more negatively than its counterparts since those HTM lost $132 billion in value. Some analysts say that this was an unexpected situation in which nobody knew that an inflation rate would skyrocket even when the FED was injecting trillions into the banking system, so future interest rate hikes must have been expected. Giant banks like JPM or BAC have very competent analysts and economists as part of their risk management areas to have anticipated a scenario like that, but it’s up to each CEO to follow a more conservative approach.
Other analysts say that the BAC’s HTM securities work like a hedge on the loan portfolio because those loans are benefiting from the interest rate hikes given their floating rates, as the same interest rates are reducing the worth of the HTM securities. When interest rates decline, the opposite would be expected: the loans would earn lower yields while the HTM securities worth would increase.
However, that would not be a perfect hedge, as although the interest rate hikes would have a positive effect on the yields earned by the loan portfolio in the short term, the lagged effect of the interest rate hikes in the economy would end up increasing the delinquency rates of the loan portfolio and its volume; also, that scenario would end up increasing the risks associated with the loan portfolio, which would push up the RWA and, finally, the capital requirements to fulfill with the minimum capital ratios regulated.
In the end, the loss of worth in the HTM securities could be seen through the accumulated other comprehensive income (AOCI) in BAC’s equity, which was $21.7 billion as of September 2023. We are not concerned with this reduction in the equity in the short term, as another important component in the equity, such as retained earnings, increases given the higher interest rates thanks to floating rates in the BAC’s lending activities. But in the long term, BAC’s performance might be negatively affected if high interest rates are maintained longer than expected; in this way, it’s important to be more exposed to a bank that manages its risks better while being more profitable.
As such, JPM is managing its assets in a better way than BAC; this is reinforced by how JPM was able to increase faster its deposits since 2020 which is seen in the column 9, while delivering a higher revenue growth in the last 3 years despite being more conservative in its capital allocation. With a higher capital adequacy ratio, a lower non-performing loan, and better protection from the HTM’s effect of the interest rate hikes while showing better net margins and revenue growth, JPM is showing a better performance in all aspects, giving a lesson about how to be more profitable and more conservative at the same time.
Efficiency and Commission fees
We may see that JPM is more efficient than BAC and C in terms of spending less on administrative expenses such as compensation and benefits, professional fees, marketing, etc. Also, JPM has developed a higher proportion over its total revenues of commission fees for services such as credit card services, deposit and lending-related services, investment and brokerage services, and investment banking fees.
Annual Reports, BAC, JPM, C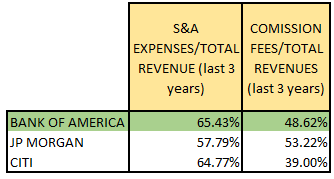
We like those commission-based services as they are highly profitable compared to those associated with lending activities. This is not a surprise that JPM has been able to achieve better net margins and capital returns by strengthening commission fee services while being more efficient in its administrative expenses and investing in assets that offer higher yields without taking more risks.
Valuation
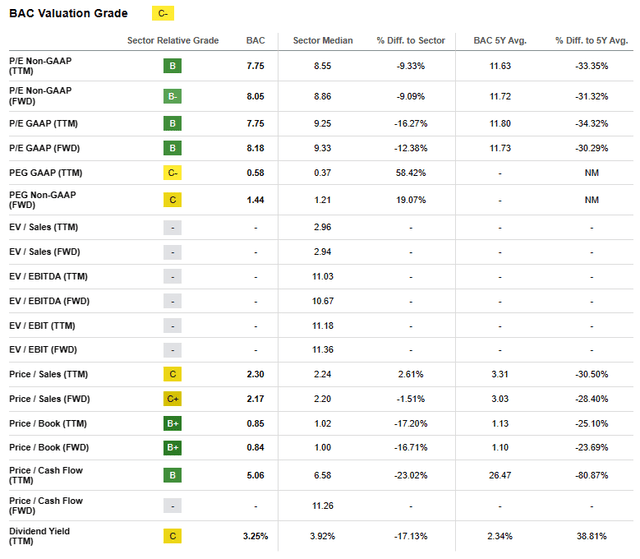
According to SA, we have the following valuation multiples:
SA gives BAC a valuation grade of C, which is influenced by the fact that there are valuation multiples that do not fit well for a bank, like price/sales or PEG. We like to use the price/book value (P/BV) or price/tangible equity (P/TE) to determine if the stock price of a bank is cheap or expensive.
For instance, P/BV or P/TE incorporates the quality of the bank’s balance sheet as it is measured at its fair price. When the BV falls, so does the intrinsic value. We do not consider the PER for banks, as that multiple only considers a multiple associated with earnings with respect to sales but not to the balance sheet, which is more important for banks. In the chart above, we may see that the P/BV and P/TE are low compared to their respective averages for the last 5 years.
Indeed, BAC’s P/BV is 0.85x, whereas its average of the last 5 years is 1.14x; now, in terms of comparables, BAC is not the cheapest one. C is the bank that is the cheapest out of the three and cheaper than its own average of the last 5 years:
Author, TIKR
With respect to its comparables, JPM is the most expensive, though it’s justified, as we’ve seen in the article, but still cheaper than its average P/BV of the last 5 years. Therefore, if you are considering buying BAC, it would be interesting to buy JPM and C as well, giving a higher weight to JPM given its higher quality.
Risks and Final Thoughts
In general, BAC has shown solid metrics that enable us to conclude that it is a solid and profitable bank given its strong reputation and size. However, it might be rather uncertain how the bank would perform in a context in which the FED maintains high interest rates for a longer period than expected.
High interest rates maintained for long periods mean higher earning yields associated with lending activities, but, in the end, those higher interest rates would have a negative impact on the economy, affecting the loan portfolio through more non-performing loans, more provisions required, and more capital needed to fulfill regulations, as it would be expected a higher RWA in those scenarios.
On the other hand, if interest rates rise even more than the current level, BAC would need to raise its deposit rates to slow down withdrawals toward other investment alternatives. Also, BAC has a higher proportion of HTM securities over its total assets compared to its main peers, and, even worse, BAC has a higher proportion of HTM securities with maturities beyond 5 years over its total HTM securities compared to its main peers. So, the effect of higher interest rates would impact even more the deterioration of those assets, particularly those with longer-term maturities.
However, even in the worst-case scenarios, banks like BAC enjoy a high reputation and trust, which is reinforced by the regulator’s requirements and the support of the US government, knowing that banks like BAC are extremely important not only for the US economy but for the global economy.
In this context, we’ve seen that, from the three banks assessed briefly, JPM has managed its main risks even better than BAC, while being more profitable at the same time. That is exceptional; if we think of buying BAC, we would first buy JPM with a higher weight to be exposed to the best-managed bank. Buying these banks in the hardest scenarios would end up paying off in the long term.
Analyst’s Disclosure: I/we have no stock, option or similar derivative position in any of the companies mentioned, and no plans to initiate any such positions within the next 72 hours. I wrote this article myself, and it expresses my own opinions. I am not receiving compensation for it (other than from Seeking Alpha). I have no business relationship with any company whose stock is mentioned in this article.
Seeking Alpha’s Disclosure: Past performance is no guarantee of future results. No recommendation or advice is being given as to whether any investment is suitable for a particular investor. Any views or opinions expressed above may not reflect those of Seeking Alpha as a whole. Seeking Alpha is not a licensed securities dealer, broker or US investment adviser or investment bank. Our analysts are third party authors that include both professional investors and individual investors who may not be licensed or certified by any institute or regulatory body.

