Summary:
- Bank of America reports a 10% increase in net income to $7.8 billion in Q3 2023.
- Revenue, net of interest expenses, increased by 3% to $25.2 billion, driven by a 4% increase in net interest income.
- BAC stock price is exhibiting a bullish trend following Q3 2023 earnings, and it appears to be poised for an upward trajectory.
Brandon Bell
Bank of America Corporation (NYSE:BAC) has delivered strong financial results for Q3 2023, demonstrating remarkable tenacity and forward-thinking planning by achieving significant growth in net income. The bank’s revenue, net of interest expense, climbed, painting a picture of robust financial health, largely propelled by an enhancement in net interest income amid favorable interest rates and a blossoming loan sector. Furthermore, the bank saw a modest uplift in noninterest income, spurred by an uptick in trading revenues and asset management fees. This piece extends the discussion from the previous article, delving into the fiscal health of Bank of America by analyzing financial results from Q3 2023, coupled with a technical analysis of its stock price, to ascertain upcoming trends and potential investment opportunities. It is observed that the stock price has reached a strong support level, as outlined in the previous piece, and is now gathering momentum for an upward trajectory.
Financial Health for Bank of America
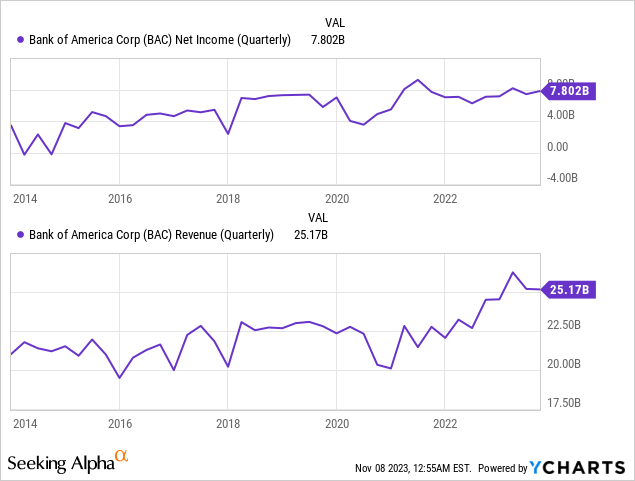
Bank of America displayed impressive financial performance in Q3 2023, evidenced by a 10% jump in net income to $7.802 billion or $0.90 per diluted share, up from $7.1 billion or $0.81 per diluted share in Q3 2022. The bank’s revenue, net of interest expense, increased by 3% to $25.17 billion, showcasing the bank’s solid financial health. This increase was driven primarily by a 4% rise in net interest income, which reached $14.4 billion, due to higher interest rates and loan growth. There was also a slight increase in noninterest income to $10.8 billion, lifted by better trading revenues and asset management fees. The accompanying chart illustrates the quarterly revenue and net income of Bank of America over the last ten years. An upward trend in profitability metrics suggests an optimistic outlook for the bank’s future earnings potential.

The bank set aside $1.2 billion for credit losses, which included a net reserve build of $303 million, slightly below the $378 million from the previous year. Net charge-offs increased to $931 million but were still lower than the figures from late 2019 before the pandemic. Noninterest expenses increased by 3% to $15.8 billion due to strategic investments in technology and personnel and higher FDIC expenses due to raised assessments in 2022. The bank’s efficiency ratio stayed steady at 63%, indicating a well-maintained balance between spending and income.
Bank of America reported a slight increase in average deposit balances to $1.9 trillion compared to the second quarter, despite a 4% year-over-year decline. On the other hand, average loan and lease balances saw a 1% increase to $1.0 trillion, with credit card balances contributing significantly to this uptick. The bank also maintained a robust liquidity position with an average of $859 billion in Global Liquidity Sources.
The bank’s Common equity tier 1 (CET1) ratio was strong at 11.9%, up 29 basis points from Q3 2023 and well above regulatory requirements. The bank also returned $2.9 billion to shareholders through dividends and share buybacks. The book value per share increased by 9% to $32.65, while the tangible book value increased by 12% to $23.79. The returns on average common shareholders’ equity and average tangible common shareholders’ equity were 11.2% and 15.5%, respectively.
The Consumer Banking division demonstrated remarkable growth, with net profits reaching $2.9 billion and a 6% rise in revenues to $10.5 billion, despite an 8% decrease in average deposits to $980 billion, yet offset by a 5% increase in loans and leases to $311 billion and a 3% uptick in credit and debit card expenditures to $225 billion. This growth was accompanied by strong customer engagement, illustrated by the opening of over 200,000 new checking accounts and a 10% rise in digital user interactions, with 46% of digital sales.
The Global Wealth and Investment Management sector also shone brightly, with a $1.0 billion net income and a 9% rise in client balances to $3.6 trillion, boosted by market conditions and inflows, while welcoming 7,000 new clients and swelling asset management portfolios by $167 billion. The Global Banking division reported a net income of $2.6 billion, ranked third in investment banking fees with a slight 2% increase, and saw higher client engagement with a $9 billion increase in deposits and over 1,900 new clients. Meanwhile, the Global Markets division posted a net income of $1.2 billion with an 8% increase in sales and trading revenue to $4.4 billion, highlighted by a 6% rise in Fixed Income, Currencies, and Commodities revenues, and a 10% increase in Equities revenue, all underscored by a commendable record of no trading losses for the quarter.
Amidst a challenging economic climate, Bank of America’s strategic focus and operational discipline have paid off, as evidenced by substantial increases in key financial metrics across its diverse portfolio of services. The bank’s forward-looking initiatives and prudent risk management practices are positioning it well to navigate future market conditions and sustain its growth trajectory.
Technical Outlook
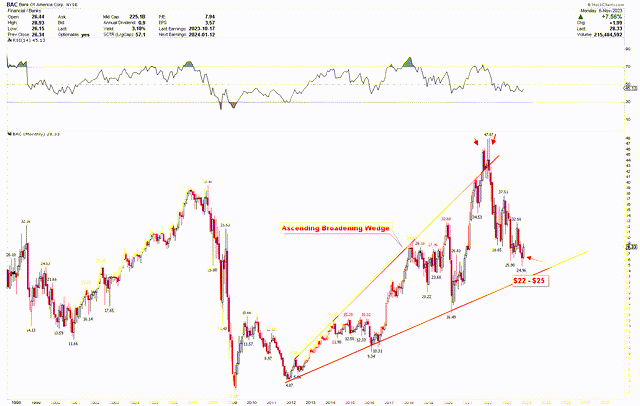
The previous article‘s monthly chart indicates that the recent decline in the stock’s value reached a crucial support zone between $22 and $25. The bounce from this level underscores the area’s importance. The updated chart reveals that the stock hit an October 2023 low at $24.96, which is now recovering strongly. The appearance of an ascending broadening wedge pattern points to significant volatility, suggesting the stock may continue to trade within wide ranges. The RSI remains under the neutral threshold of 50, signaling the potential for further price swings before any upward momentum gains traction.
BAC Monthly Chart (stockcharts.com)
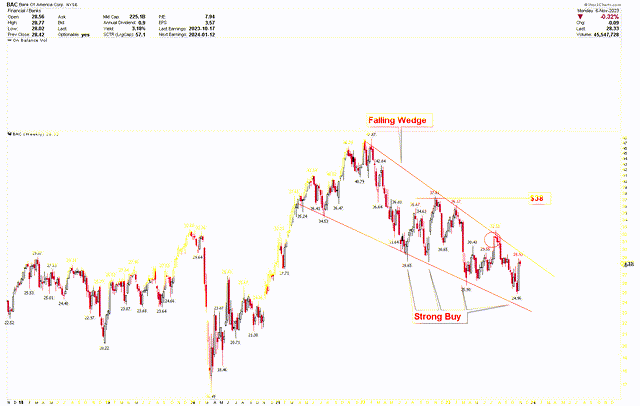
Furthermore, the falling wedge pattern on the weekly chart demonstrates that the stock has touched and rebounded from an expected support level, indicating a powerful reversal on the weekly chart. This upturn is a testament to robust buying interest in the stock. The last weekly candlestick formed with a solid body, hinting at potential upcoming price increases. Should the stock breach the immediate resistance near $30, it could pave the way for an advance toward $38. The consistency of the stock’s lows at the lower support line of the falling wedge suggests an underlying strength in price, potentially leading to further gains.
BAC Weekly Chart (stockcharts.com)
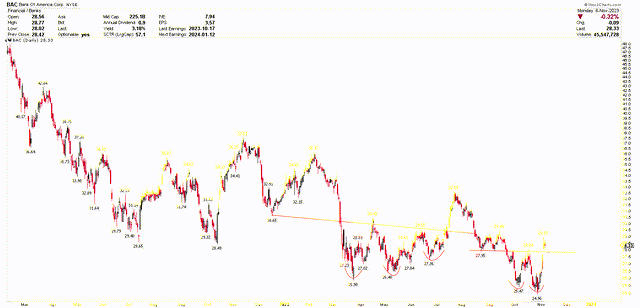
The bullish sentiment is further corroborated by the daily chart, which shows a double bottom pattern indicating a shift towards higher prices. This formation, with the March low at $25.90 and the May low at $26.40, sets a bullish tone. Despite this, the stock sought to finish its correction by dipping below the $26 mark. Yet, this decline was countered by a double bottom at $25.47 and $24.96. With the neckline of this pattern surpassed at $28, the stock appears to be setting its sights on higher price levels.
BAC Daily Chart (stockcharts.com)
As the price is rallying from the robust support zone between $22-$25, characterized by an ascending broadening wedge, and this upward movement is evident on the daily chart as a double bottom pattern, investors may consider the current levels as an opportunity to increase their long positions in expectation of further price appreciation. Nonetheless, should the price retreat to the $22-$25 range again, it would present an additional opportunity to bolster stock holdings.
Market Risk
The dependence on net interest income for profitability could become a double-edged sword, posing an interest rate risk. Should the economic landscape shift, leading to decreased interest rates or a flattening yield curve, the bank’s margins could be squeezed. Another risk factor is the set aside of $1.2 billion for credit losses, including a net reserve build; this provision points to potential future credit defaults, underlining a key area of vulnerability. While the bank’s increase in noninterest expenses reflects strategic investment for future growth, it also introduces the risk of these investments not yielding the anticipated returns, which could negatively affect profit margins.
In addition, global economic factors, including inflation, geopolitical tensions, and the possibility of recession, loom as systemic risks that could have far-reaching impacts on the bank’s overall risk profile. Moreover, developing an ascending broadening wedge underscores the presence of considerable volatility. Should there be a monthly close under $20, it could negate the long-term bullish trend and lead to a fresh downturn.
Bottom Line
Bank of America’s Q3 2023 results testify to the institution’s strategic acumen and ability to navigate a complex economic landscape. The bank has not only managed to surpass expectations with a significant 10% increase in net income but has also demonstrated strong performance across its various divisions, underscoring a commitment to growth and adaptability. Despite the inherent challenges and market risks, such as potential interest rate changes and credit defaults, the bank’s strategic investments and robust capital adequacy position it well to tackle future uncertainties.
The technical indicators give a positive projection for the bank’s stock, presenting configurations that indicate a possibility for expansion. The stock demonstrates resilience within the crucial price band of $22 to $25. A key reversal on the weekly timeframe, coupled with a double bottom formation on the daily timeframe, suggests the stock could surge past the falling wedge pattern, potentially triggering a robust ascent to elevated price points. Investors may consider increasing holdings at these prices in expectation of higher prices.
Analyst’s Disclosure: I/we have no stock, option or similar derivative position in any of the companies mentioned, and no plans to initiate any such positions within the next 72 hours. I wrote this article myself, and it expresses my own opinions. I am not receiving compensation for it (other than from Seeking Alpha). I have no business relationship with any company whose stock is mentioned in this article.
Seeking Alpha’s Disclosure: Past performance is no guarantee of future results. No recommendation or advice is being given as to whether any investment is suitable for a particular investor. Any views or opinions expressed above may not reflect those of Seeking Alpha as a whole. Seeking Alpha is not a licensed securities dealer, broker or US investment adviser or investment bank. Our analysts are third party authors that include both professional investors and individual investors who may not be licensed or certified by any institute or regulatory body.
