Summary:
- Bank of America has shown no negative return this year compared to other stocks. That is a rare statement, as most company stock returns have been negative all year.
- Technical indicators show tepid stock price expectations for Bank of America, while the Monte Carlo simulation says otherwise. Regression analysis shows sideways moving over the next 30 days.
- Bank of America’s forward guidance is relatively strong, especially regarding the dividend strength over the next five years.
Justin Sullivan
Introduction
With no negative return in 2022, Bank of America Corporation (NYSE:BAC) has proven to be a well-managed company with relatively strong forward guidance estimates. Dividend growth looks solid over the next five years. Day traders might want to refrain from investing in BAC as they seek short-term profit. Long-term investors, however, may be pleased to accumulate this relatively cheap stock, which could increase in the coming months.
Fundamental decent growth with no negative return this year
Growth
Bank of America has been lackluster in growth over the last five years. 2020 was not a kind year for them due to negative revenue growth and net income growth. One encouraging sign is that the previous year was its strongest year for net income growth.
|
Unnamed: 0 |
2017 |
2018 |
2019 |
2020 |
2021 |
|
Period |
FY |
FY |
FY |
FY |
FY |
|
Revenue growth |
0.044 |
0.045 |
-0.000 |
-0.063 |
0.042 |
|
Net income growth |
0.018 |
0.544 |
-0.025 |
-0.348 |
0.787 |
Source: Financial Modelling Prep.
Data
This year has been relatively strong for Bank of America, considering the positive returns thus far. Simple moving average periods of 20 and 50 days have been extreme.
|
Unnamed: 0 |
Values |
|
SMA20 |
10.54% |
|
SMA50 |
8.63% |
|
SMA200 |
-2.96% |
Source: FinViz.
Enterprise
There have been solid metrics for Bank of America with its stock price, market capitalization, and rebounding enterprise value.
|
Unnamed: 0 |
2017 |
2018 |
2019 |
2020 |
2021 |
|
Symbol |
BAC |
BAC |
BAC |
BAC |
BAC |
|
Stock price |
31.880 |
29.070 |
33.480 |
29.650 |
45.870 |
|
Number of shares |
10.196 B |
10.097 B |
9.390 B |
8.753 B |
8.493 B |
|
Market capitalization |
325.037 B |
293.505 B |
314.394 B |
259.532 B |
389.588 B |
|
Enterprise value |
416.518 B |
358.136 B |
410.787 B |
154.778 B |
338.093 B |
Source: Financial Modelling Prep.
Estimate
Unlike big technology, future guidance estimate shows slow growth for Bank of America. So do not expect its dividend yield to grow either. Earnings per share will see some positive elevated change.
|
YEARLY ESTIMATES |
2022 |
2023 |
2024 |
2025 |
|
Revenue |
94,768 |
103,457 |
106,363 |
118,836 |
|
Dividend |
0.89 |
0.93 |
1.04 |
1.16 |
|
Dividend Yield (in %) |
2.46 % |
2.57 % |
2.87 % |
3.21 % |
|
EPS |
3.18 |
3.74 |
4.06 |
5.10 |
|
P/E Ratio |
11.38 |
9.66 |
8.90 |
7.09 |
|
EBIT |
33,503 |
40,957 |
41,714 |
52,057 |
|
Net Profit |
26,117 |
29,835 |
31,095 |
37,613 |
|
EPS (GAAP) |
3.18 |
3.74 |
4.06 |
5.10 |
Source: BusinessInsider.
Technical Analysis of potential market entry
Fibonacci
Sometimes you can only rely on potential market entry as any stock price will cross above a Fibonacci trendline. However, based on the most recent strengthened stock price, it might be wise to add the Bank of America stock price to your watch list.
fibonacci boa (custom platform)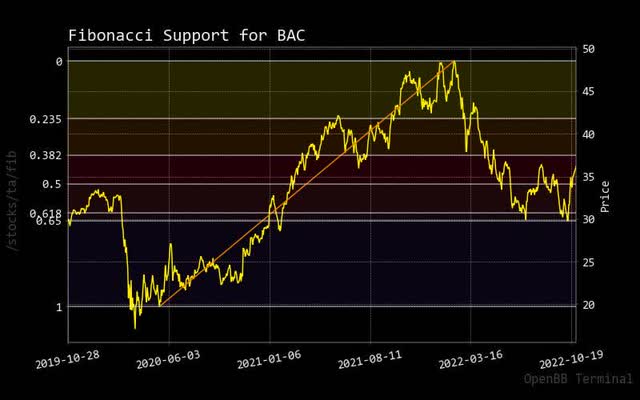
Bollinger Bonds
There is further confirmation as Bank of America stock price pushes through the upper Bollinger band guidance line, and this might be your signal for upward momentum to continue with the price. Is it time to buy into BAC stock right now?
bollinger BAC (custom platform )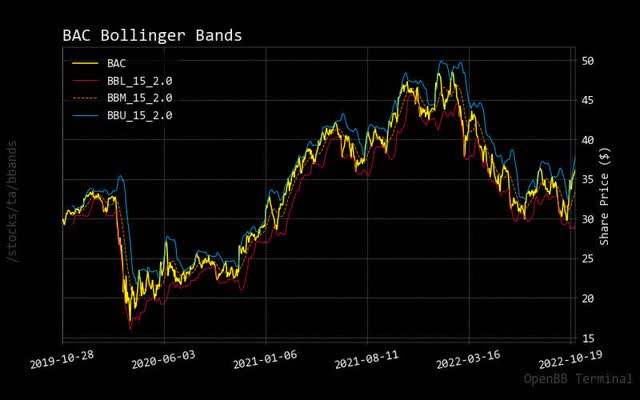
MACD
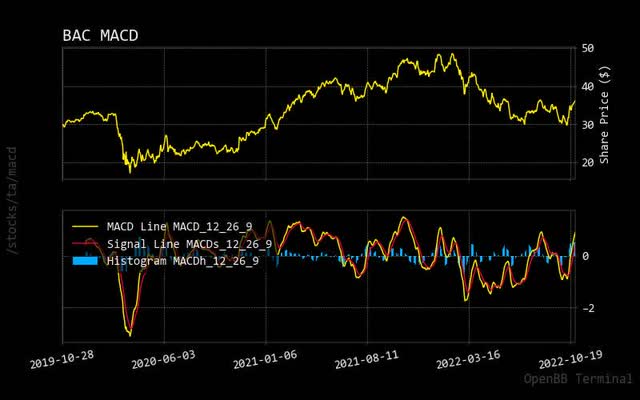
Bank of America’s current stock price has broken the zero line, so it is wise to consider your market entry now. Other signals seem to clarify the price uptrend from this well-managed bank.
RSI
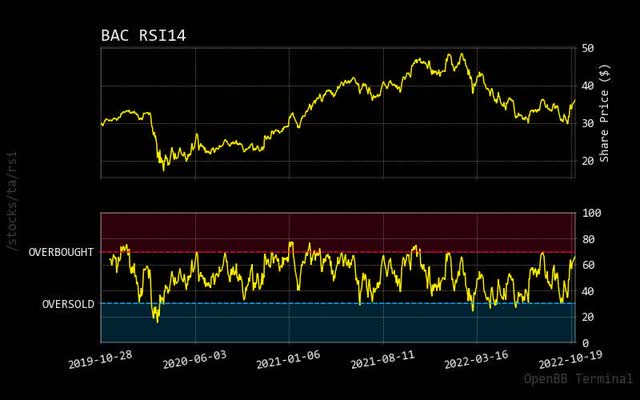
Be aware that Bank of America’s current price appears to be approaching an overbought condition on the relative strength indicator. So, should we expect a short-term sideways move? It depends on the overall stock market conditions within the United States.
Prediction via AI
Monte Carlo
monte carlo BAC (custom platform )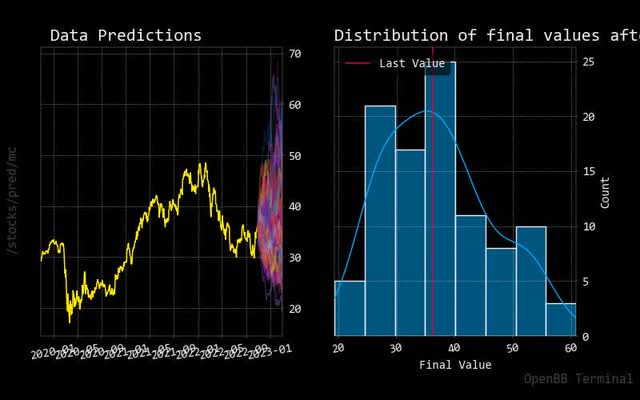
Momentum is clearly in the Bank of America stock price as prediction paths show robust upward forecasting. Also, the normalized distribution chart shows a higher probability of stock prices increasing in the coming days, but this depends on the overall stock market momentum.
Regression
As for the forecasted red regression line, one could expect sideways movement for the next 30 days. We could expect long-term stock price performance based on other analysis styles, but it will be insignificant compared to other higher-performing market sectors.
regression BAC (custom platform)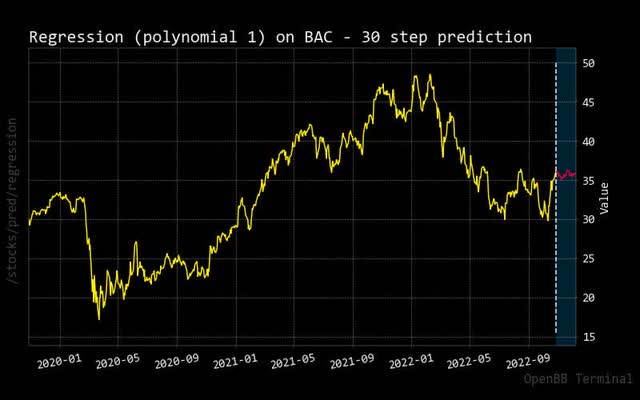
The risk appears low and moot
Recommendation
Recommendations from other market analysts show quite a mixed story. From a short-term perspective for day traders, it would be wise to average dollar costs in any new positions of Bank of America. For long-term investors, one could start loading up on this stock as prices uptrend over the next few years. Remember that holding stocks that do not perform becomes an opportunity cost against other short-term performing instruments.
|
Interval |
RECOMMENDATION |
BUY |
SELL |
NEUTRAL |
|
One month |
SELL |
6 |
10 |
10 |
|
One week |
NEUTRAL |
7 |
9 |
10 |
|
One day |
BUY |
13 |
3 |
10 |
Source: Trading View.
Price vs. Short Volume
Short trading volume has slightly spiked as Bank of America’s stock price rises for the near term. However, the shorting trend is below 50% of the total trading volume.
shorting BAC (custom platform )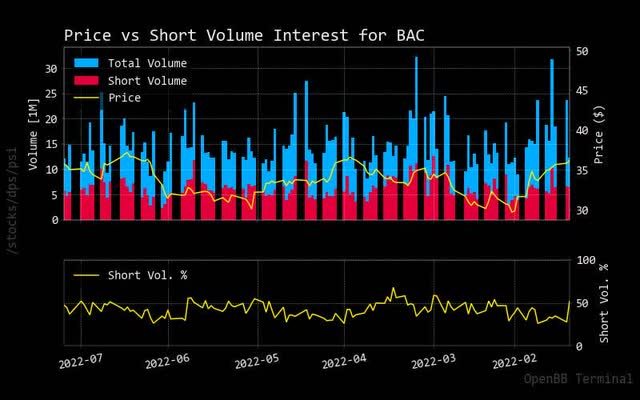
Sustainability
Bank of America has an average performance for sustainability but should be improved upon to see further investment from the most prominent American asset managers. Nevertheless, this bank seems well-managed to minimize any adverse risk during the pandemic, and it needs to boost this sustainability rating to stay ahead of its competition.
|
Unnamed: 0 |
Value |
|
Social score |
14.37 |
|
Peer count |
172 |
|
Governance score |
11.16 |
|
Total esg |
27.15 |
|
Highest controversy |
3 |
|
ESG performance |
AVG_PERF |
|
Percentile |
52.39 |
|
Peer group |
Banks |
|
Environment score |
1.62 |
Source: Yahoo Finance.
Price Target
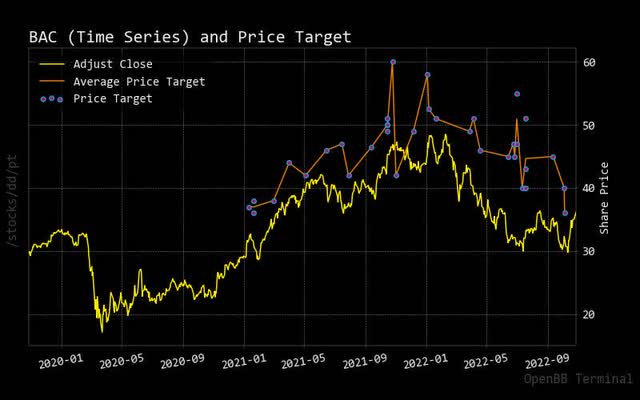
This due diligence stock pricing target chart has a nice trending story. As market analysts keep dropping their price targets for Bank of America, the current stock price is starting to exceed those most recent targets. So, do you expect future market analysts to raise their pricing targets in the coming weeks?
Insider Activity
It is shocking to see the amount of selling by the current CEO of Bank of America earlier this year. However, as stock performance strengthens, so do his buying habits, indicating further confidence within the bank where he works.
|
Date |
Shares Traded |
Shares Held |
Price |
Type |
Option |
Insider |
Trade |
|
2022-05-14 |
15,853.00 |
2,183,262.00 |
35.17 |
Sell |
No |
MOYNIHAN BRIAN T |
-15853.0 |
|
2022-05-14 |
1,189.00 |
155,784.00 |
35.17 |
Sell |
No |
MOYNIHAN BRIAN T |
-1189.0 |
|
2022-05-31 |
50,000.00 |
350,137.00 |
nan |
Buy |
No |
MOYNIHAN BRIAN T |
50000.0 |
|
2022-05-31 |
6,045.00 |
344,092.00 |
36.67 |
Sell |
No |
MOYNIHAN BRIAN T |
-6045.0 |
|
2022-06-14 |
15,852.00 |
2,199,114.00 |
nan |
Buy |
No |
ALMEIDA JOSE E |
15852.0 |
|
2022-06-14 |
15,852.00 |
2,183,262.00 |
32.05 |
Sell |
No |
Mensah Bernard A |
-15852.0 |
|
2022-07-14 |
15,853.00 |
2,199,115.00 |
nan |
Buy |
No |
Mensah Bernard A |
15853.0 |
|
2022-07-14 |
15,853.00 |
2,183,262.00 |
32.25 |
Sell |
No |
MOYNIHAN BRIAN T |
-15853.0 |
|
2022-08-14 |
33,788.00 |
96,927.00 |
nan |
Buy |
No |
Bless Rudolf A. |
33788.0 |
|
2022-08-14 |
22,433.00 |
366,525.00 |
nan |
Buy |
No |
DeMare James P |
22433.0 |
|
2022-08-14 |
17,470.00 |
150,468.00 |
nan |
Buy |
No |
Koder Matthew M |
17470.0 |
|
2022-08-14 |
2,674.00 |
158,458.00 |
nan |
Buy |
No |
Mensah Bernard A |
2674.0 |
|
2022-08-14 |
15,852.00 |
2,199,114.00 |
nan |
Buy |
No |
MOYNIHAN BRIAN T |
15852.0 |
|
2022-08-14 |
2,323.00 |
364,202.00 |
36.25 |
Sell |
No |
Bless Rudolf A. |
-2323.0 |
|
2022-08-14 |
9,661.00 |
140,807.00 |
36.25 |
Sell |
No |
DeMare James P |
-9661.0 |
|
2022-08-14 |
1,189.00 |
157,269.00 |
36.25 |
Sell |
No |
Koder Matthew M |
-1189.0 |
|
2022-08-14 |
15,852.00 |
2,183,262.00 |
36.25 |
Sell |
No |
Mensah Bernard A |
-15852.0 |
|
2022-08-14 |
16,303.00 |
80,624.00 |
36.25 |
Sell |
No |
MOYNIHAN BRIAN T |
-16303.0 |
|
2022-08-31 |
1,799.00 |
82,423.00 |
nan |
Buy |
No |
MOYNIHAN BRIAN T |
1799.0 |
|
2022-08-31 |
1,799.00 |
80,624.00 |
33.47 |
Sell |
No |
MOYNIHAN BRIAN T |
-1799.0 |
|
2022-09-13 |
4,529.00 |
4,529.00 |
nan |
Buy |
No |
MOYNIHAN BRIAN T |
4529.0 |
|
2022-09-14 |
15,852.00 |
2,199,114.00 |
nan |
Buy |
No |
Koder Matthew M |
15852.0 |
|
2022-09-14 |
15,852.00 |
2,183,262.00 |
34.51 |
Sell |
No |
Koder Matthew M |
-15852.0 |
|
2022-10-14 |
15,852.00 |
2,199,114.00 |
nan |
Buy |
No |
Bless Rudolf A. |
15852.0 |
|
2022-10-14 |
15,852.00 |
2,183,262.00 |
31.7 |
Sell |
No |
MOYNIHAN BRIAN T |
-15852.0 |
Source: BusinessInsider.
Conclusion
Will recent buying activity from the CEO come up? One could take away that Bank of America’s stock price could increase over the short term. In the long run, one could see higher stock price performance than banking competition. As it stands, it would be recommended to consider buying into the stock for the long run. Over the last few years, Bank of America has proven well-managed and does not fear any potential downtrends.
Disclosure: I/we have no stock, option or similar derivative position in any of the companies mentioned, and no plans to initiate any such positions within the next 72 hours. I wrote this article myself, and it expresses my own opinions. I am not receiving compensation for it (other than from Seeking Alpha). I have no business relationship with any company whose stock is mentioned in this article.
