Summary:
- Bank of America’s Q1 2024 results showed negative revenue growth and a decline in net income.
- The decline in revenues was due to drops in consumer banking and global banking segments.
- Despite the decline in revenues, BAC is managing its capital and risks adequately, though one of its main peers is doing it better.
- There are headwinds to face in the near future as more regulations might be implemented, and high-interest rates might be kept longer than expected. I rate the stock as a hold.
robwilson39
I rate Bank of America (NYSE:BAC) as a hold, as the stock is not trading at an attractive price now; I developed my bullish case in my last article in November 2023, when the stock price was trading at around $29 per share. In that article, I noticed that the stock price was attractive as the market was concerned about the deterioration of the held-to-maturity (HTM) assets given the interest rate hikes; in 2022, those assets represented 20% of the total assets, and in 2023, those assets represented 18.75%. That improvement is combined with the Fed’s policy, which does not consider further interest rate hikes, though it plans to keep them at high levels for a longer period than expected. Nevertheless, even when I consider that the stock is not so expensive, it is not cheap either, so I would wait for a drop to start a new position. For current investors, it’s a clear hold, and I will provide more information to support my thesis, considering the quality of the balance sheet, the intrinsic value, and a risk comparison with BAC’s main peers in terms of risk management and performance.
Context
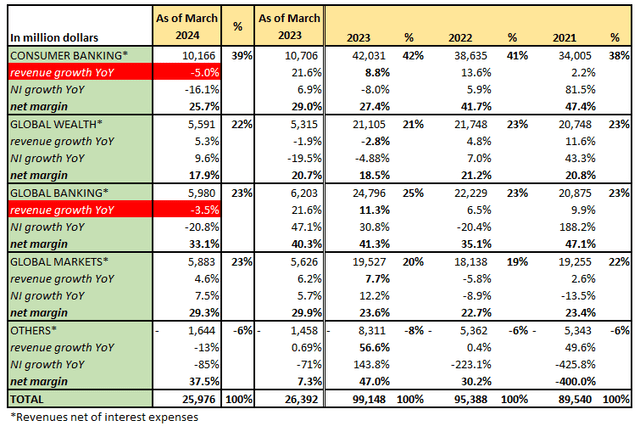
The Q1 2024 results showed that BAC had a negative revenue growth of 2% YoY as of March 2024, whereas net income experienced a decline as well of 18.15%. I prefer to see the YoY comparison rather than the evolution of BAC quarter by quarter, in which BAC has shown an improvement in revenues and net income.
This decline in revenues can be explained by the decline of revenues in important segments such as consumer banking (CB), which dropped 5% YoY, and global banking (GB), which declined 3.5% YoY; both segments represent 62% of the total revenues.
The decline in the CB’s revenues as of March 2024 occurred even when there was a growth in consumer lending of 5.43% YoY. In the case of GB, the decline in revenues was more related to a fall in the volume of loans associated with this segment, which declined 2% YoY. On the other hand, the decline in overall net income in the first quarter of 2024 is impacted by these two segments, which represent around 69% combined of the total net income. The CB’s net income showed a decline of 16% YoY, and the GB’s showed a drop of 20% YoY.
In this sense, the decline in the net income as of March 2024 YoY was a result of two factors: i) the higher provision for credit losses, which comes almost entirely from the CB segment, particularly from the credit card business; and ii) the FDIC special assessment, which is a payment that all the banks should make for the adequate insurance of depositors; this payment was triggered after the closures of Silicon Valley Bank and Signature Bank in 2023.
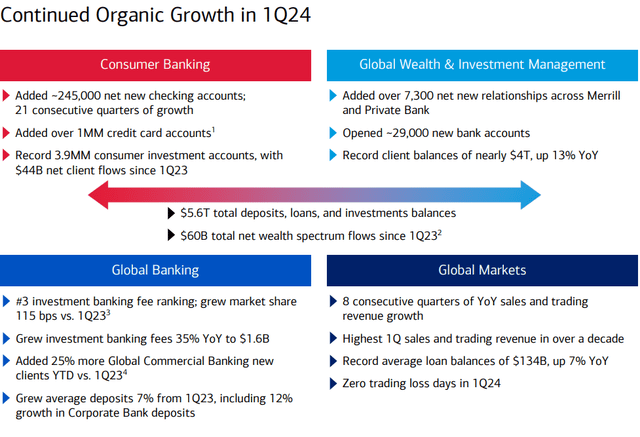
All in all, I am not concerned about this decline in revenues and net income as the bank is working to expand its business in its different segments, as shown in BAC’s presentation for Q1 2024 results:
Capital Management
With respect to capital, BAC has delivered a total capital adequacy ratio of 15.2% as of March 2024, while the minimum regulated requirement is 13.9%. There was an improvement in this important ratio with respect to March 2023 when BAC delivered 15%. The capital adequacy ratio is calculated based on the following formula:
Capital adequacy ratio = (Tier 1 capital + Tier 2 capital)/Risk Weighted Assets
Tier 1 capital is the core capital, making it easier to calculate its worth because it is more liquid, and Tier 2 capital is less liquid and makes it more difficult to estimate its accurate worth.
The risk-weighted assets (RWA) are the minimum required assets that banks must hold given the risk profile of their lending activities and other assets. Each type of asset receives a percentage of risk; if a bank has an important number of risky assets, it means that most of those assets will have higher percentages that make the total RWA increase substantially. If the RWA increases significantly, the capital adequacy ratio might be reduced even to a lower level than the minimum requirement set by regulations.
There is uncertainty about the effects of the new changes proposed by the FDIC on the RWA of the banks; it is estimated that these changes would make BAC’s RWA increase by around 18% from its current level. As of March 2024, BAC shows a RWA of $1.66 trillion, which implies that the new regulation would increase the amount required for RWA to $1.95 trillion.
For instance, consider the minimum required capital common equity Tier 1 of 10% and the new required RWA of $1.95 trillion. BAC would need to hold at least $195 billion of capital Tier 1 common equity between 2025 and 2028 if those proposals are expected to be phased in those years. Nevertheless, BAC already has a total capital Tier 1 of common equity of $196 billion as of March 2024, so I am not convinced that this would be a problem.
These regulations contribute to having a strong and solvent US banking sector, as they prepare banks to have enough liquidity to face very hard economic scenarios. Among the different programs from the Fed to keep reinforcing confidence in the US banking system, the discount window offers ready access to funding, supporting banks to manage their liquidity risks, particularly in scenarios of stress. So the discount window supports the smooth flow of credit to households and businesses.
These regulations are shown through capital ratio requirements, which were put in place to preserve liquidity and capital health following 2008 via Basel III. In this sense, the solvency and solid business model of BAC can be seen through the qualifications of its senior debt:
Risk management and performance compared to its main peers
I collected some data, as I did in my previous article. The main difference is that I’ve included the results of 2023 to calculate an average of the last 3 years in most of the BAC’s metrics compared to those of its main peers to see how the BAC is performing compared to its peers’ performance.
I take the metrics of JPMorgan (JPM) and Citigroup (C), and we can see that JPM has performed better in every metric of the table above as an average of the last 3 years; for instance, JPM has better returns of capital, which can be seen through the ROTE and ROE, showing higher net margins, capital adequacy ratio, revenue growth, and even fewer non-performing loans than the other two. I will talk about the management of the HTM assets in columns 7 and 8 in the risk section later.
With respect to deposits, the three banks increased their total deposits from 2020 to 2024, though JPM was able to grow them faster. Deposits are a critical source of funding for a bank to use all that money to invest in securities and lend. BAC has been working to make those deposits more stable over the years, as the management said in the last call for Q1 2024 results:
These checking balances continue to drive the performance of our consumer deposits. These checking additions are important for many other reasons. On average, 68% of our deposit balances have been with us for more than 10 years; 92% of the customer checking accounts are primary checking accounts in household, meaning that they’re the core operating account for the household for their financial lives. So when we on-board a client, we start a long-term valuable relationship. About 60% of our checking accounts customers use a debit card and on average they do about 400 transactions per year on that card.
As such, I would say that BAC is managing its capital and risks adequately; it’s just that JPM is doing it better.
Valuation
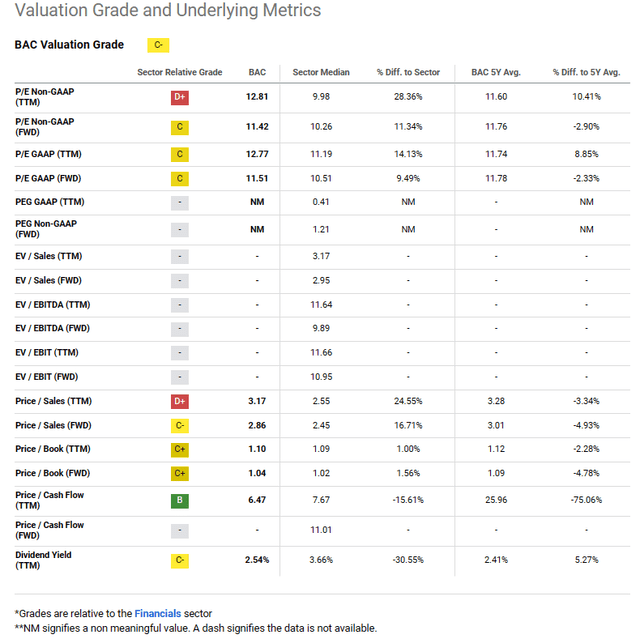
According to SA, we have the following valuation multiples:
SA gives BAC a valuation grade of C-, which indicates that the stock is not cheap. We like to use the price/book value (P/BV) or price/tangible equity (P/TE) to determine if the stock price of a bank is cheap or expensive, considering the quality of its balance sheet.
For instance, P/BV or P/TE incorporates the quality of the bank’s balance sheet as it is measured at its fair price. When the BV falls, so does the intrinsic value. We do not consider the PER for banks, as that multiple only considers a multiple associated with earnings with respect to sales but not to the balance sheet, which is more important for banks. In the chart above, we may see that the P/BV and P/TE are close to their respective averages for the last 5 years.
Indeed, BAC’s P/BV is 1.10x currently, whereas its average of the last 5 years is 1.13x; now, in terms of comparables, BAC is not the cheapest one. C is the bank that is the cheapest out of the three and cheaper than its own average of the last 5 years:
Author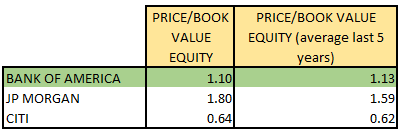
Now, I would not base it on how cheap a bank is compared to its peers since we’ve seen that JPM has the best quality in terms of business model, so it’s understandable that the market is willing to pay a higher multiple for the stock. Nevertheless, if we are focused on how cheap a bank is compared to its average multiple in the last 5 years, neither of the three banks is cheap.
Now, my point in this article is that not only is BAC not cheap but that JPM is a better bank in terms of quality, so both banks deserve to be included in your portfolio, but JPM has a bigger weight. So, if you are thinking of including BAC when the stock price is attractive, you should also think of including JPM with a heavier weight. In my article written in November 2023, both banks had their P/BV lower than their average of the last 5 years, so I recommended buying both. Since then, BAC and JPM have experienced a capital appreciation of 28.45% and 28.13%, respectively.
In addition, we should consider that the proposal of new changes in capital requirements might reduce the capital that any bank can deploy to buy more earning assets, so the BV could decline in the next quarters as a consequence; if the BV declines, keeping the same multiple currently, the stock price might decline too, so I would wait for more attractive prices for JPM and BAC.
Risks and Final Thoughts
BAC has shown solid metrics that enable us to conclude that it is a solid and profitable bank, given its strong reputation and size. However, it might be rather uncertain how the bank would perform in a context in which the Fed maintains high-interest rates for a way longer period than expected.
High-interest rates maintained for long periods mean higher earning yields associated with lending activities, but, in the end, those higher interest rates would have a negative impact on the economy, affecting the loan portfolio through more non-performing loans, more provisions required, and more capital needed to fulfill regulations, as it would be expected to have a higher RWA in those scenarios.
Also, high-interest rates impact the worth of the held-to-maturities (‘HTM’) securities on the balance sheet; as of March 2024, the unrealized losses associated with these assets were $109 billion. To explain better this risk, when there are interest rate hikes, the value of these assets that are held until their respective maturities declines, and sometimes the drop could be significant in the assets of the balance sheet. As such, in stressed scenarios, the bank would have to sell those assets at a discount to face abrupt withdrawals of deposits, requests for payment of credit lines, among other commitments related to the liabilities.
Even when the impact of the changes in interest rates on HTM assets does not affect capital adequacy ratios directly, there could be an indirect impact. For instance, I mentioned before that new regulations might be implemented to increase the RWA, so the HTM securities might receive a higher proportion of risk, which could increase the RWA requirements, which, in turn, would require banks like BAC, which have a high proportion of these assets in their balance sheets, to increase their capital to fulfill the new capital requirements.
We can see the ratios of columns 7 and 8 in the table shown in the Risk Management section above, which reflect how each bank, JPM, BAC, and C, has allocated its capital in HTM securities in the last 3 years. We can see that JPM’s HTM assets only represent 10.29% of JPM’s total assets, and even better, the long-term HTM assets, those whose maturities are beyond 5 years, only represent 66% of the total HTM assets. Those long-term HTM assets have a higher sensitivity to changes in interest rates, so JPM is less exposed to these changes than BAC.
In BAC’s case, its HTM assets represent 20% of the total assets as an average in the last 3 years, so it’s clear that BAC was more exposed than JPM to the interest rate changes. Even worse, in column 8, 99.32% of the total HTM assets are long-term HTM assets, which are way more sensitive to interest rate changes. That’s why I said in my prior article that JPM was a real example of how a bank should manage its risks and capital to grow faster with higher margins while keeping a very conservative risk policy for capital management.
However, even when JPM has a higher-quality business model than BAC’s, the latter is still a solid bank with a good name and reputation in the American banking sector. BAC is working to reduce the exposure of the HTM assets, as the bank was reducing those assets, which represented 21.78% of the total assets in 2021, to 18.70% in 2023. Nevertheless, BAC has not significantly reduced the proportion of long-term HTM assets out of the total HTM assets, as 99.85% of the HTM securities were long-term assets in 2021 and 99.02% in 2023.
On the other hand, more capital requirements established by regulators could reduce the possibilities available for BAC to deploy its capital in more profitable alternatives. In this article, I am assuming certain levels of capital requirements, but if those regulations demand bank requirements that are way beyond those levels I assumed, the stock price might drop to reflect that new scenario. In any circumstance, we see that the current stock price is not cheap, if we take the P/BV as a reference.
However, even in the worst-case scenarios, in my opinion, banks like BAC enjoy a high reputation and trust, which is reinforced by the regulator’s requirements and the support of the US government, knowing that banks like BAC are extremely important not only for the US economy but for the global economy. Warren Buffett has a high conviction in this stock, which represents 10% of the Berkshire (BRK.B) stock portfolio and is the second most important position after Apple (AAPL).
As such, I consider the stock a hold, particularly for those investors who already have some shares of BAC in their portfolios at a lower price than the current one.
Finally, as I mentioned in my previous article, if you are considering BAC as a future position in your portfolio, you should include JPM as well, even putting a higher weight on JPM, of course, when both stocks show lower prices than their 5-year average P/BV.
Analyst’s Disclosure: I/we have no stock, option or similar derivative position in any of the companies mentioned, and no plans to initiate any such positions within the next 72 hours. I wrote this article myself, and it expresses my own opinions. I am not receiving compensation for it (other than from Seeking Alpha). I have no business relationship with any company whose stock is mentioned in this article.
Seeking Alpha’s Disclosure: Past performance is no guarantee of future results. No recommendation or advice is being given as to whether any investment is suitable for a particular investor. Any views or opinions expressed above may not reflect those of Seeking Alpha as a whole. Seeking Alpha is not a licensed securities dealer, broker or US investment adviser or investment bank. Our analysts are third party authors that include both professional investors and individual investors who may not be licensed or certified by any institute or regulatory body.
