
Summary:
- Broadcom’s stock price has outperformed price targets in several coverage periods, driven by factors such as underestimated growth in the Semiconductor segment and positive market sentiment.
- Revenue growth is not the main reason for the stock price outperformance, as forecasts were both higher and lower than actual growth in different coverage periods.
- Differences in earnings growth also do not explain the stock price outperformance, as forecasts were below actual growth in some periods but above in others.
- We believe current market sentiment, driven by AI developments is what is driving the current surge in Broadcom’s stock price, ahead of its intrinsic value.

Sundry Photography
In our prior Hold analysis from January, we maintained a highly optimistic view on Broadcom Inc.’s (NASDAQ:AVGO) growth prospects for 2024 and beyond, despite some cyclical weaknesses in certain semicon market segments. We also anticipated a steady growth rate of 8.7% for core Infrastructure Software revenues up to 2026 while factoring in VMWare’s contribution, we forecasted Broadcom’s software revenues to surge by 166% to $20.3 bln in FY2024. Regarding profitability, we projected a temporary dip in combined net margins for 2024 post-VMWare acquisition, followed by an upward trend through 2028 as Broadcom executes integration plans and cost-saving initiatives.
|
Coverage Date |
Previous Price Target |
Price |
Upside |
Price Target Lead |
|
Current |
1,351.58 |
-12.9% |
-13% |
|
|
30/1/2024 |
1177.26 |
1204.88 |
-2.3% |
-10% |
|
25/7/2023 |
1082.67 |
896.75 |
20.7% |
-30% |
|
12/9/2022 |
623.38 |
522.4 |
19.3% |
40% |
|
28/6/2022 |
730.8 |
505.71 |
44.5% |
36% |
|
12/5/2022 |
689.38 |
554.39 |
24.3% |
47% |
|
12/4/2022 |
813.84 |
585.78 |
38.9% |
-12% |
|
5/5/2021 |
517.95 |
462 |
12.1% |
-12% |
|
30/1/2020 |
405.24 |
309.15 |
31.1% |
5% |
|
31/1/2019 |
325 |
266.32 |
22.0% |
29% |
|
19/12/2018 |
343.88 |
254 |
35.4% |
Source: Khaveen Investments
In this analysis, we revisited the company due to its stock price having surged by 9% since our last review. Below, we’ve compiled our price targets for each instance we covered the company. Notably, since 2023, the company’s stock price has continued to rise surpassing our price targets. Furthermore, the company’s share price also outperformed our price targets in the May 2021 and April 2022 coverages. Therefore, this indicates that our research coverage price targets have been chasing the company’s share price. Thus, we analyze the factors for the company’s stock price outperformance including revenue growth and earnings growth as well as valuation multiples, and ultimately reiterate a Hold.
Outperformance Not Due to Differences in Revenue Growth
Firstly, we compiled our previous revenue forecast growth for each time we covered Broadcom in addition to its actual growth during the fiscal year, cumulative quarterly analyst consensus from 2021, and management revenue guidance to compare with our price target lead.
|
Coverage Date |
Our Price Target Upside |
Price Target Lead |
Our Revenue Growth Forecast |
Actual Growth |
Analyst Consensus |
Management Guidance |
|
30/1/2024 |
-2.3% |
-10% |
42.96% |
– |
40.17% |
40.00% |
|
25/7/2023 |
20.7% |
-30% |
32.40% |
7.88% |
7.67% |
7.58% |
|
12/9/2022 |
19.3% |
40% |
12.90% |
20.96% |
19.60% |
19.49% |
|
28/6/2022 |
44.5% |
36% |
12.60% |
20.96% |
19.60% |
19.49% |
|
12/5/2022 |
24.3% |
47% |
12.90% |
20.96% |
19.60% |
19.49% |
|
12/4/2022 |
38.9% |
-12% |
8.07% |
20.96% |
19.60% |
19.49% |
|
5/5/2021 |
12.1% |
-12% |
10.16% |
14.91% |
14.07% |
13.86% |
|
30/1/2020 |
31.1% |
5% |
12.00% |
5.71% |
5.71% |
10.63% |
|
31/1/2019 |
22.0% |
29% |
15.12% |
8.39% |
9.30% |
17.52% |
|
19/12/2018 |
35.4% |
15.12% |
8.39% |
9.30% |
17.66% |
Source: Company Data, Seeking Alpha, Khaveen Investments
Based on the table above, the company’s stock price surpassed our price targets in 4 out of the 10 times we covered Broadcom. Specifically, in our May 2021 and April 2022 coverages, the company’s stock price outperformed our price targets by 12%. Furthermore, in our July 2023 coverage, its stock price had risen past our price target by 30% while in the latest January 2024 coverage, its stock price increased 10% past our price target. For the remaining times we covered Broadcom, there was a price target lead.
In our May 2021 and April 2022 coverages, our revenue growth forecasts were below the company’s actual growth in these periods (2021 and 2022) as well as analysts’ consensus and management guidance. Also, the company’s actual growth in 2021 (14.9%) and 2022 (20.96%) even beat analysts’ consensus and management guidance. Furthermore, in our 2021 coverage, our revenue growth forecast (10.16%) is below its actual growth rate (14.91%) in that year. However, while our revenue growth forecasts were lower in these periods, in the other 2 coverage periods (July 2023 and January 2024), our revenue growth forecasts were more optimistic than management guidance and analysts’ consensus. In our July 2023 coverage, our growth forecasts were higher than its actual growth rate. Therefore, we believe that revenue growth is not the main reason for the company’s stock price outperformance compared to our forecast.
As analyzed previously in my article from July 2023, the main reason for Broadcom’s higher-than-expected growth was due to strong growth driven by its Semiconductor Solutions segment. For example, in 2022, its actual growth in its Semiconductor Solutions segment was 25.4% compared to our 11% forecast, supported by its fast-growing Networking subsegment with rapid product development and surge in Storage growth supported by the increase in MegaRAID adoption by customers. Similarly, in 2021, the company’s growth surpassed our forecast mainly due to stronger growth in its Semiconductor Solutions segment at 18% compared to 11.6% which we had based on prorated Q1 to Q2 management guidance for the segment. In 2023, our growth forecast was higher than actual as we explained previously that we anticipated Broadcom’s VMWare acquisition to be completed earlier than its actual completion date in November 2023, thus we had accounted for VMWare’s revenue contribution earlier than its actual completion resulting in our higher growth forecast. Had we excluded VMWare, our revenue growth would have been 15% for Broadcom, which is still higher than the actual growth.
Therefore, we believe that overall, revenue growth is not the primary reason for Broadcom’s outperformance compared to our price targets in 4 of out 10 times we covered Broadcom as in only 2 times (May 2021 and April 2022) its actual growth was higher than our expectations.
|
Broadcom Revenue ($ mln) |
2020 |
2021 |
2022 |
2023 |
Q1 2024 |
2024 (Management Guidance) |
2024F (Our Forecast) |
Average |
|
Semiconductor Solutions |
17,268 |
20,383 |
25,818 |
28,182 |
7,390 |
30,000 |
31,065 |
|
|
Growth (YoY %) |
-1.0% |
18.0% |
26.7% |
9.2% |
4.0% |
6.5% |
9.8% |
13.2% |
|
Infrastructure Software |
6,621 |
7,067 |
7,385 |
7,637 |
4,571 |
20,000 |
20,295 |
|
|
Growth (YoY %) |
28.4% |
6.7% |
4.5% |
3.4% |
152.8% |
161.9% |
165.7% |
10.8% |
|
Total |
23,889 |
27,450 |
33,203 |
35,819 |
11,961 |
50,000 |
51,359 |
|
|
Growth (YoY %) |
5.7% |
14.9% |
21.0% |
7.9% |
34.2% |
39.6% |
43.0% |
12.4% |
Source: Company Data, Khaveen Investments
Since our last coverage, the company’s revenue growth in Q1 2024 was 34.2% YoY, driven primarily due to the increase in Infrastructure Software revenue following its acquisition completion of VMWare which we had covered previously. For the full year in 2024, management reiterated in its latest earnings briefing for “guidance for consolidated revenue to be $50 billion, which represents 40% year-on-year growth”. For comparison, we had previously forecasted the company’s total growth of 43% in 2024, which is in line with management guidance. Specifically, management also reiterated its guidance for Software revenues to be $20 bln vs ($20.3 bln for our forecast) and also reiterated Semiconductor revenue to “revenue to be up mid- to high single-digit percentage year-on-year”, compared with our forecast for the segment at 9.8%.
Semiconductor Solutions Segment
|
Semiconductor Segment Revenue Breakdown ($ mln) |
2020 |
2021 |
2022 |
2023 |
Q1 2024 |
2024 (Guidance) |
2024F (Our Forecast) |
Average |
|
Networking |
6,044 |
6,930 |
9,036 |
10,934 |
3,326 |
14,761 |
16,024 |
|
|
Growth (YoY %) |
-1.0% |
14.7% |
30.4% |
21.0% |
46.2% |
35% |
46.6% |
16.3% |
|
Storage |
2,418 |
3,057 |
4,389 |
4,872 |
887 |
3,654 |
4,044 |
|
|
Growth (YoY %) |
-1.0% |
26.5% |
43.6% |
11.0% |
-30.7% |
-25% |
-17.0% |
20.0% |
|
Wireless |
5,353 |
6,523 |
7,487 |
7,337 |
1,995 |
7,337 |
7,337 |
|
|
Growth (YoY %) |
-1.0% |
21.8% |
14.8% |
-2.0% |
-3.2% |
0% |
0.0% |
8.4% |
|
Broadband |
2,418 |
3,261 |
3,873 |
4,183 |
961 |
3,869 |
3,660 |
|
|
Growth (YoY %) |
-1.0% |
34.9% |
18.7% |
8.0% |
-20.5% |
-8% |
-12.5% |
15.2% |
|
Industrial |
1,036 |
611 |
1,033 |
962 |
222 |
890 |
938 |
|
|
Growth (YoY %) |
-1.0% |
-41.0% |
68.9% |
-6.8% |
-22.0% |
-8% |
-2.5% |
5.0% |
|
Total |
17,268 |
20,383 |
25,818 |
28,182 |
7,390 |
30,511 |
31,065 |
|
|
Growth (YoY %) |
-1.0% |
18.0% |
26.7% |
9.2% |
4.0% |
8.3% |
9.8% |
26.1% |
Source: Company Data, Khaveen Investments
In the previous analysis from January, we switched our revenue projections to be based on a more detailed product breakdown for each of its semicon subsegments. We believe this reflects a more accurate projection compared to our previous analyses (from 2021 to 2022) where we had based its growth on the overall semiconductor market growth, as Broadcom’s semicon segment has exposure to high growth subsegments such as in Networking with a forward average growth forecast of 22.5%.
In Q1 2024, its total growth was only 4% compared to our full-year growth of 9.8%, as its Storage, Wireless, Broadband and Industrial segments growth contracted despite robust growth in Networking. We had anticipated Storage, Wireless, Broadband and Industrial subsegments to be weak in 2024 due to market weakness. However, the Storage and Industrial subsegments in particular had the largest differences with our full-year forecasts. Though, management highlighted a weaker first half and anticipated a recovery in the second half, with their full-year guidance in still line with our forecast.
However, our forecast for its Networking revenue growth is in line with its Q1 2024 growth of 46.6%. According to management, this was “largely driven by strong demand for our custom AI accelerators”. Also, its “latest generation Tomahawk 5 800G switches saw through Ethernet mix refinements, DSPs and optical components are experiencing strong demand at hyperscale customers as well as large-scale enterprises deploying AI data centers”. Furthermore, compared to previous guidance, management highlighted that it now raised its guidance for the subsegment to grow by 35% compared to 30% previously, though we had already anticipated stronger growth in Networking with a full-year forecast of 46.6% due to the strong growth of its AI solutions. Recently, Broadcom has started sampling next-gen PCIe6 switch chips to customers and announced new products such as Thor2 NIC with 400G bandwidth while announcing it has secured a new third custom ASIC customer.
Software Segment
|
Broadcom Semikron Projections |
2020 |
2021 |
2022 |
2023 |
Q1 2024 |
2024 (Guidance) |
2024 (Our Forecast) |
|
Core Software |
6,600 |
7,067 |
7,385 |
7,637 |
2,471 |
8,000 |
8,295 |
|
Growth % |
28.0% |
7.1% |
4.5% |
3.4% |
36.7% |
4.8% |
8.6% |
|
VMWare |
2,100 |
12,000 |
12,000 |
||||
|
Total Software |
6,600 |
7,067 |
7,385 |
7,637 |
4,571 |
20,000 |
20,295 |
|
Growth % |
28.0% |
7.1% |
4.5% |
3.4% |
153% |
153% |
165.7% |
Source: Khaveen Investments
Furthermore, in Software, the company’s revenue grew by 153% in Q1, mainly due to the incremental revenue contribution of its VMWare acquisition. Besides that, we calculated its Core software revenue to have grown superbly in Q1 2024 as well as management highlighted its bookings tripled during the quarter. Management also highlighted its positive outlook for its VMWare growth. The company announced a partnership between VMware and Nvidia and introduced VMware Private AI Foundation, enabling VCF to run GPUs, allowing customers to deploy AI models on-premises while maintaining control over their data privacy, supporting enterprise demand according to the company.
Analysts’ Consensus
|
Our Broadcom Semicon Projections ($ mln) |
2024F |
2025F |
2026F |
2027F |
2028F |
|
Total Semicon |
31,065 |
35,884 |
41,010 |
46,505 |
52,325 |
|
Growth % |
9.8% |
15.5% |
14.3% |
13.4% |
12.5% |
|
Total Software |
20,295 |
26,719 |
31,087 |
37,559 |
42,159 |
|
Growth % |
165.7% |
31.7% |
16.3% |
20.8% |
12.2% |
|
Total Broadcom (With VMWare) |
51,359 |
62,603 |
72,097 |
84,064 |
94,483 |
|
Growth % |
43.0% |
21.9% |
15.2% |
16.6% |
12.4% |
Source: Khaveen Investments
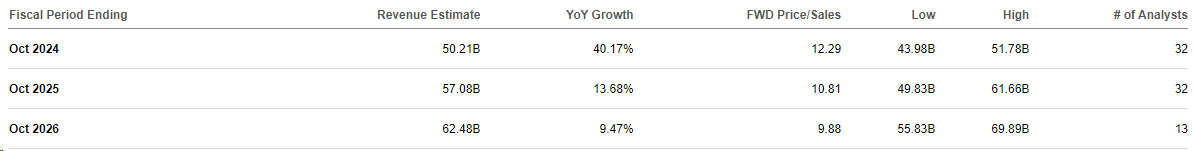
Seeking Alpha
Source: Seeking Alpha
Comparing analyst consensus with our forecasts, our forecast for 2024 is fairly in line at $51.4 bln at a 43% growth rate compared to 40.17% for analyst consensus. However, our growth forecasts for 2025 and beyond are higher than analysts’ consensus. This is as in our previous analysis, we had accounted for VMWare synergies of $1,814 mln. Thus, we anticipate stronger growth forecasts compared to the analyst’s consensus.
Outlook
Overall, we believe Broadcom’s stock outperformance since our previous coverage was not due to revenue growth. Broadcom’s revenue growth surpassed our expectations, thus we believe this could have contributed to the outperformance of its price target in our 2021 and 2022 coverages, mainly due to underestimated growth in its Semiconductor segment. However, our revenue forecasts for 2023 exceeded actual growth, management guidance, and analyst consensus. Moreover, our latest coverage for 2024 aligns closely with management guidance and analyst consensus, with management reaffirming its revenue forecasts for the year. Additionally, Broadcom’s Q1 results were largely within our expectations, driven by robust Networking semiconductor growth. We believe our revenue forecast for the company remains appropriate following our revised forecasts previously based on a better model that is more accurate taking into account its robust growth outlook for its Semicon segment growth driven by AI networking products.
Outperformance Not Due to Differences in Profitability
In the next point, we focused on the company’s profitability. In the table below, we compared our previous forecast for its earnings growth with its actual earnings growth for the fiscal year of each time we covered Broadcom.
|
Coverage Date |
Our Price Target Upside |
Price Target Lead |
Our Earnings Growth Forecast |
Actual Earnings Growth % |
|
30/1/2024 |
-2.3% |
-10% |
1.90% |
– |
|
25/7/2023 |
20.7% |
-30% |
-4.10% |
22.5% |
|
12/9/2022 |
19.3% |
40% |
-2.98% |
70.7% |
|
28/6/2022 |
44.5% |
36% |
-2.98% |
70.7% |
|
12/5/2022 |
24.3% |
47% |
-2.98% |
70.7% |
|
12/4/2022 |
38.9% |
-12% |
-2.98% |
70.7% |
|
5/5/2021 |
12.1% |
-12% |
-30.52% |
127.6% |
|
30/1/2020 |
31.1% |
5% |
32.00% |
8.7% |
|
31/1/2019 |
22.0% |
29% |
-3.28% |
-77.8% |
|
19/12/2018 |
35.4% |
-3.28% |
-77.8% |
Source: Khaveen Investments
Based on the table above, each time the company’s stock price outperformed our price targets in the past 3 years in 2021, 2022 and 2023, we believe this could be due to our earnings growth forecasts being below the company’s actual earnings growth. For example, in May 2021, the price target lead was -12% as its actual earnings growth surged to 127.6% compared to our forecast of -30.52%. Furthermore, in our April 2022 coverage, its actual earnings growth was 70.7% for 2022 compared to our forecast of a slight decline of -2.98%. However, there was a price target lead in our subsequent coverage in 2022 as we highlighted above Broadcom’s stock declined over 20% as the semicon industry slumped. In 2023, the company’s earnings grew by 22.5% compared to our forecast of -4.1%.
|
Our Previous Broadcom Earnings & Margins Forecast ($ mln) |
2020 |
2021 |
2022 |
2023 |
2024F |
|
Revenue |
23,888 |
27,450 |
33,203 |
35,819 |
51,208 |
|
Net Earnings |
2,960 |
6,736 |
11,495 |
14,082 |
14,350 |
|
Growth % |
8.7% |
127.6% |
70.7% |
22.5% |
1.9% |
|
Net Margins % |
12.39% |
24.54% |
34.62% |
39.31% |
28.02% |
Source: Company Data, Khaveen Investments
In 2024, we previously forecasted its net earnings growth to be flat at 1.9% for the full year despite the strong growth of 43% for its revenues due to the impact of the lower margins of VMWare which we previously analyzed. In Q1 2024, the company’s net earnings growth declined by 65% with a net margin of 11%. Management also highlighted in its latest briefing that its Software segment’s gross margin declined, as anticipated, due to the acquisition of VMWare.
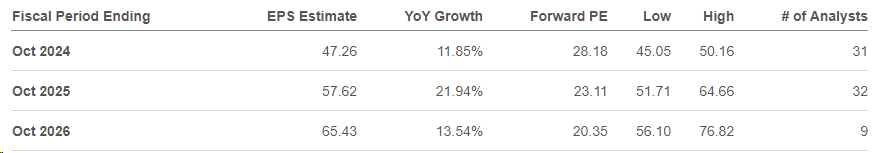
In comparison, despite that, analyst consensus forecasts for the full year for the company’s EPS are positive at 11.85%, higher compared to our forecasts for the company’s net earnings growth of 1.9%. This is as analyst consensus is non-GAAP adjusted whereas our earnings forecasts are based on GAAP. The major difference between the company’s non-GAAP and GAAP earnings is attributed to the amortization of intangible assets which is not accounted for in non-GAAP earnings. In Q1 2024, Broadcom’s amortization of intangible assets surged, more than doubling to $2.1 bln from $883 bln in the previous year’s quarter. Furthermore, the second largest elimination in its non-GAAP earnings is stock-based compensation. In Q1 2024, its stock-based compensation was $1,572 mln compared with net income of $1,325 mln. Other expenses include acquisition-related restructuring charges and costs and tax adjustments.
Seeking Alpha
Share Buybacks
|
Broadcom Earnings and FCF ($ mln) |
2018 |
2019 |
2020 |
2021 |
2022 |
2023 |
2024F |
|
Net Earnings |
12,259 |
2,724 |
2,960 |
6,736 |
11,495 |
14,082 |
14,350 |
|
Growth % |
-77.8% |
8.7% |
127.6% |
70.7% |
22.5% |
1.9% |
|
|
Broadcom Shares Outstanding (‘mln’) |
431 |
419 |
421 |
429 |
423 |
427 |
492 |
|
Growth % |
-2.8% |
0.5% |
1.9% |
-1.4% |
0.9% |
15.2% |
|
|
EPS |
28.44 |
6.50 |
7.03 |
15.70 |
27.17 |
32.98 |
29.17 |
|
Growth % |
-77.1% |
8.1% |
123.3% |
73.1% |
21.4% |
-11.6% |
|
|
FCF |
4,612 |
-4,662 |
2,314 |
14,996 |
17,362 |
18,255 |
-20,472 |
|
FCF per share |
10.70 |
-11.13 |
5.50 |
34.95 |
41.05 |
42.75 |
-41.61 |
|
Growth % |
-204.0% |
-149.4% |
536.0% |
17.4% |
4.2% |
-197.3% |
Source: Khaveen Investments
As seen in the table above, the company’s share buybacks had little impact on the company’s EPS growth as its shares outstanding were relatively flattish with the largest decline only by 2.8% in 2019. In the period, the average share outstanding growth was only -0.2% despite the company’s share buybacks.
|
Broadcom Share Repurchases and Stock-based Compensation |
2018 |
2019 |
2020 |
2021 |
2022 |
2023 |
TTM |
|
Share Issuance ($ mln) |
212 |
253 |
276 |
170 |
114 |
122 |
122 |
|
Share Repurchases ($ mln) |
-7,314 |
-6,407 |
-765 |
-1,299 |
-8,455 |
-7,685 |
-14,454 |
|
Net Shares ($ mln) |
-7,102 |
-6,154 |
-489 |
-1,129 |
-8,341 |
-7,563 |
-14,332 |
|
Average Stock Price ($) |
198 |
247 |
289 |
459 |
517 |
771 |
1,233 |
|
Broadcom Shares Outstanding (‘mln’) |
431 |
419 |
421 |
429 |
423 |
427 |
478 |
|
Growth % |
-2.8% |
0.5% |
1.9% |
-1.4% |
0.9% |
11.9% |
|
|
Market Capitalization ($ mln) |
85,210 |
103,291 |
121,619 |
196,764 |
218,594 |
329,298 |
589,389 |
|
Share Buyback % of Market Cap |
8.3% |
6.0% |
0.4% |
0.6% |
3.8% |
2.3% |
2.4% |
|
Stock-Based Compensation |
1,227 |
2,185 |
1,976 |
1,704 |
1,533 |
2,171 |
|
|
Stock-Based Compensation % of Market Cap |
1.4% |
2.1% |
1.6% |
0.9% |
0.7% |
0.7% |
Source: Company Data, Macro Trends, Khaveen Investments
The company had purchased $7.2 bln shares in Q1 which led to a reduction of 7.7 mln shares according to management. However, its total shares outstanding increased overall in Q1 2024 to 478 mln, due to shares issued for its VMWare acquisition and is expected to increase to 492 mln in Q2.
In the table above, we compiled the company’s share repurchases and share issuance with the net share issuance/repurchases. We compared this with the company’s market cap in the past 6 years. The company has net share repurchases as it spent more on share repurchases than it received from its share issuance activities. In Q1 2024 TTM, the company’s net share repurchases were a record $14.3 bln. However, compared to its market cap which had risen strongly over the past year as its stock price rose by 60%, its share repurchases % of market cap was only 2.4% in TTM, in line with 2023. Furthermore, its share repurchases % of market cap actually declined over the period with the highest in 2018 at 8.3% and 6% in 2019.
Furthermore, we compiled the company’s stock-based compensation in the past 6 years in the table above and calculated it as a % of market cap. Its stock-based compensation was between 0.7% to 2.1% of its market cap over the period. Notably, in 2020 and 2021, its stock-based compensation % of market cap was higher than share buyback % of market cap. Thus, we believe this explains its total shares outstanding positive growth in 2020 and 2021. However, in 2023, its shares outstanding had positive growth despite its stock-based compensation % of market cap being lower than share buyback % of Market Cap due to the completion of its VMWare acquisition by 13 mln in Q4 2023. Overall, while its stock-based compensation has led to an increase in shares outstanding which would be negative for investors due to the dilution of its EPS, it only happened in 2 out of the 6 years. However, the company’s shares are guided by management to increase in 2024, due to the effect of its acquisition of VMWare. As a result, we believe the overall EPS is forecasted to decline in 2024 despite the share buybacks as the company’s share increase from its acquisition is expected to dilute its EPS.
Outlook
All in all, we determined that our forecasts for its earnings were quite different compared with the company’s growth as our forecasts are based on its GAAP earnings which take into account expense adjustments such as amortization of intangible assets, stock-based compensation, acquisition-related restructuring charges and costs as well as tax adjustments. In comparison, analyst consensus that earnings growth is based on non-GAAP, thus the difference between its forecast (11.85%) compared to our previous forecast of 1.8%. Additionally, while the company has increased its share repurchases over the years, its shares outstanding have been relatively stable, and thus did not support significant EPS growth. This is as its share buyback % of market cap has been on a declining trend over the period as well as the company’s stock-based compensation offsetting its share buybacks in 2020 and 2021. However, due to the acquisition of VMWare, the company’s shares outstanding are expected to rise significantly in 2024, which we expect to result in a dilution of its EPS in 2024. Overall, we do not believe the company’s stock price outperformance in our previous coverage was due to differences in earnings growth.
Stock Influenced by Market Sentiment
Finally, in this section, we examined the company’s valuation ratios in terms of PS, PE and P/FCF. We compiled the table below our previous price target upsides and price target leads for each coverage as well as the company’s P/S, P/E, EV/EBITDA and P/FCF ratios when it was above its mean/median.
|
Coverage Date |
Our Price Target Upside |
Price Target Lead |
P/S |
P/E |
EV/EBITDA |
P/FCF |
|
30/1/2024 |
-2.3% |
-10% |
Yes |
Yes |
Yes |
Yes |
|
25/7/2023 |
20.7% |
-30% |
Yes |
No |
Yes |
Yes |
|
12/9/2022 |
19.3% |
40% |
No |
No |
No |
No |
|
28/6/2022 |
44.5% |
36% |
No |
No |
No |
No |
|
12/5/2022 |
24.3% |
47% |
No |
No |
No |
No |
|
12/4/2022 |
38.9% |
-12% |
Yes |
No |
Yes |
Yes |
|
5/5/2021 |
12.1% |
-12% |
Yes |
Yes |
Yes |
Yes |
|
30/1/2020 |
31.1% |
5% |
No |
– |
No |
No |
|
31/1/2019 |
22.0% |
29% |
Yes |
– |
No |
No |
|
19/12/2018 |
35.4% |
– |
– |
– |
– |
Source: YCharts, Khaveen Investments
Based on the table, in the coverages where there was no price target lead (share price outperformed our price targets), the company’s valuation ratios were generally above its mean/median. For example, in our May 2021 coverage, all of the company’s valuation ratios (P/S, P/E, EV/EBITDA and P/FCF) were above their mean/median as well as in our latest coverage (Jan 2024). In April 2022 and July 2023 coverages, most of its valuation ratios were also above its mean/median, except for its P/E ratio.
For the rest of the coverage periods, its valuation ratios were mostly in line with or below its mean/median. In 2022, the company’s valuation ratios moved below their mean/median as Broadcom stock slumped by 25% following the contraction (-31%) of the overall semicon industry.
Therefore, we believe that when our price lead was negative, the company’s outperformance in these periods was temporary as its share price was above its valuation in those times, and we covered Broadcom.
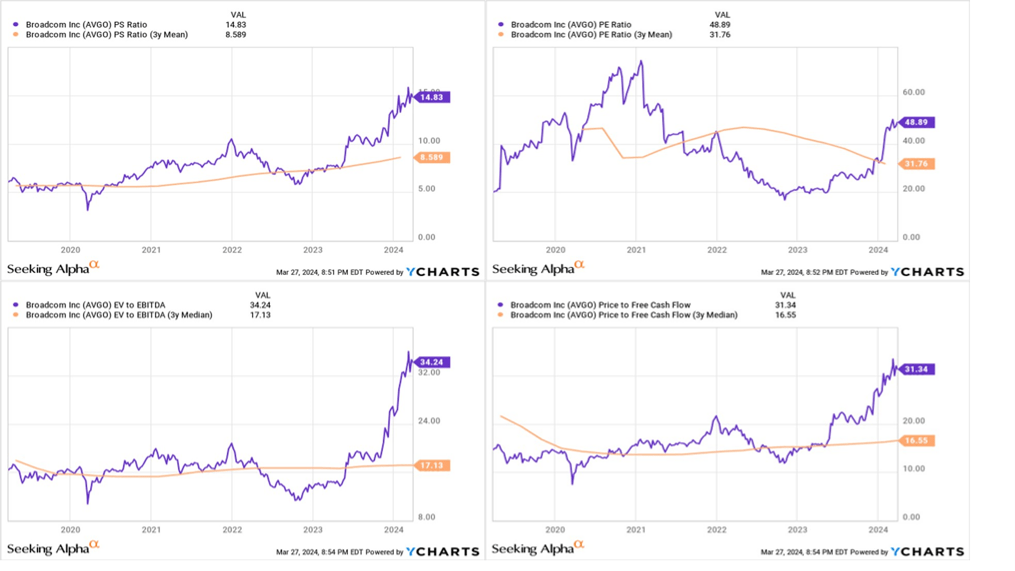
YCharts, Khaveen Investments
Based on the charts above of the company’s valuation ratios, its P/S, and P/FCF ratios were generally in line with its mean/median until the start of 2020. Its P/FCF ratio was below its median in 2019 and most of 2020 before increasing past its median in the second half of 2020. Its P/S, EV/EBITDA and PE ratios also increased past their mean/median during this period, indicating positive investor sentiment on its stock. For its P/S, EV/EBITDA and P/FCF ratios, it remained above its mean/median until 2022, dropping below it by the second half of the year. Though its PE ratio dropped below its mean in 2021 but further declined through 2022. Its valuation ratios recovered since then, with its ratio approaching its mean/median for P/S, EV/EBITDA and P/FCF in the first half of 2023, and surging past it is following that, remaining well above their respective mean/median to date. Its P/E ratio also increased past its mean since the start of 2024. Overall, this indicates strong investor sentiment on Broadcom currently. We examined several reasons that could explain its strong sentiment currently and during the end of 2020 to mid-2022 period.
Semicon Industry Optimism (2021)
Furthermore, we believe another factor for the positive market sentiment on Broadcom could be due to the semicon market optimism between 2021 to 2022. In 2021, the Philadelphia Semiconductor Index jumped by 41%. The semiconductor market sales growth surged that year by 26.2% as unit shipment demand reached an all-time high based on SIA while Broadcom’s stock price surged by 52% in 2021 as well as its sales growth accelerated to 14.9% that year. The industry also faced chip shortages which had benefited Broadcom as management highlighted its customers were increasing orders at an “unprecedented pace” as they accelerated bookings. Following that, Broadcom highlighted the supply situation had improved by 2022, indicating an end to its chip shortage.
Share Buyback Announcements (December 2021 to Mid-2022)
For the December 2021 to mid-2022 period, we believe one factor for the positive market sentiment could be due to Broadcom announcing the authorization of a $10 bln share buyback program through 2022. This share buyback announcement is significant as Broadcom’s share repurchases had fallen sharply in the past 2 years (2020 and 2021) as mentioned in the previous point following the acquisition of Symantec for $10 bln. Also, compared with its 2019 share repurchases, the $10 bln approved buyback amount is 56% higher than its actual buybacks in 2019. Following the share buyback announcement, Broadcom’s stock Broadcom stock rallied by 6%.
Recently, Broadcom highlighted in its latest earnings briefing that the company has resumed its share buybacks following the completion of its VMware deal in Q4 2023. In Q1 2024 TTM, its share repurchases have increased significantly by 90%. However, unlike the announcement and news of the market reaction to its share buybacks in 2021, we did not find any news for this announcement in 2023. Notwithstanding, we believe share buybacks may be a factor in the positive market sentiment on Broadcom in 2023 due to the large growth increase in share buybacks by the company in 2023.
AI Announcements (2023 to Current)
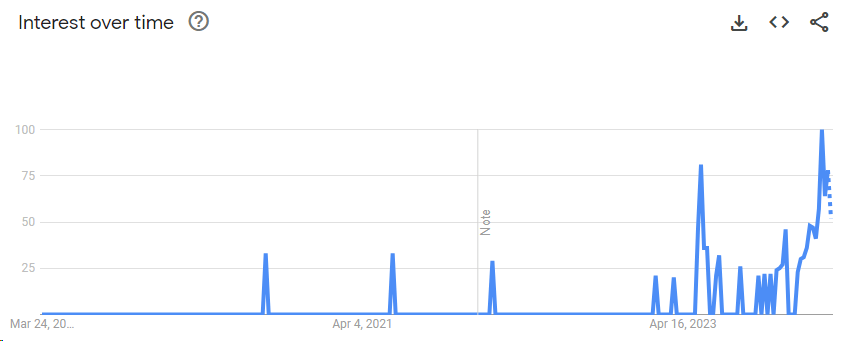
Furthermore, we believe another reason for the positive investor sentiment between mid-2023 and currently in 2024 is due to its AI announcements. Based on Google Trends on searches with “Broadcom AI”, interest has exploded since the middle of 2023, coinciding with the period when most of its valuation ratios surged past its mean/median.
Google Trends
Recently, Broadcom held an event presentation featuring its AI products, followed by a 3% rise in the company’s stock price after the event. However, we had already accounted for the growth prospects of Broadcom’s AI initiatives as covered in our previous analysis where we highlighted its strong growth outlook in its Networking semicon subsegment with a 46% growth rate forecast in 2024 which is even higher than management’s revised guidance of 35% for 2024. Based on Seeking Alpha news sections, we identified 23 news articles that mentioned Broadcom in relation to AI so far in 2024 with Oppenheimer, Barclays (BCS) and TD Cowen recently highlighting its new AI innovations and growth outlook, this is much higher compared with the last year’s (between June to Dec 2023) where we identified 8 news articles mentioning Broadcom in relation to AI, highlighting a growing news coverage on Broadcom’s AI initiatives. Therefore, this highlights there was a lot of news related to AI for Broadcom in 2023 but is even higher in 2024, which we believe indicates the increase in AI news developments on Broadcom which could further increase investor sentiment.
Conclusion
All in all, we believe the differences between our forecasts and valuation for Broadcom in terms of revenue and earnings are not the primary factors for the outperformance of Broadcom stock price compared to our price targets in several past coverage periods. Instead, we believe the outperformance of Broadcom stock in these periods was mainly attributable to the positive investor sentiment on Broadcom where its valuation ratios including P/S, P/FCF and EV/EBITDA surged past its mean reflecting factors we identified such as increased share buybacks in 2021 and 2023, AI developments in 2023 to 2024 and the semiconductor industry optimism during 2021. Overall, we believe our forecasts and valuation remain appropriate as we have accounted for the robust growth outlook of Broadcom’s AI growth reflected by its Networking semicon subsegment as highlighted in the first point. Furthermore, while its share buybacks had increased, we analyzed its shares outstanding remaining stable despite its share buybacks due to its stock-based compensation which offset the decline in its shares outstanding. Finally, we believe our forecasts are also appropriate as the chip shortage situation has subsided for Broadcom.
Risk: Competition in AI Networking Chips
We believe one of the risks to Broadcom is competition from Nvidia (NVDA) and Marvell (MRVL) in networking chips for AI. For example, Nvidia competes against Broadcom in Ethernet switching (12.7% of Broadcom revenue in 2022 with its Quantum InfiniBand switches with similar bandwidth capability of Broadcom products at 51.2 Tb/s as well as Marvell’s Teralynx. Additionally, according to Reuters, Nvidia is also reportedly developing custom ASICs for data center customers in AI to compete against Broadcom, which has a leading market share of 35%, and Marvell. Therefore, we believe competition from Nvidia and Marvell could be a risk for its overall revenue growth due to the significance of its high growth Networking segment which we believe is its key growth subsegment with a forward average of 22.5%.
Valuation
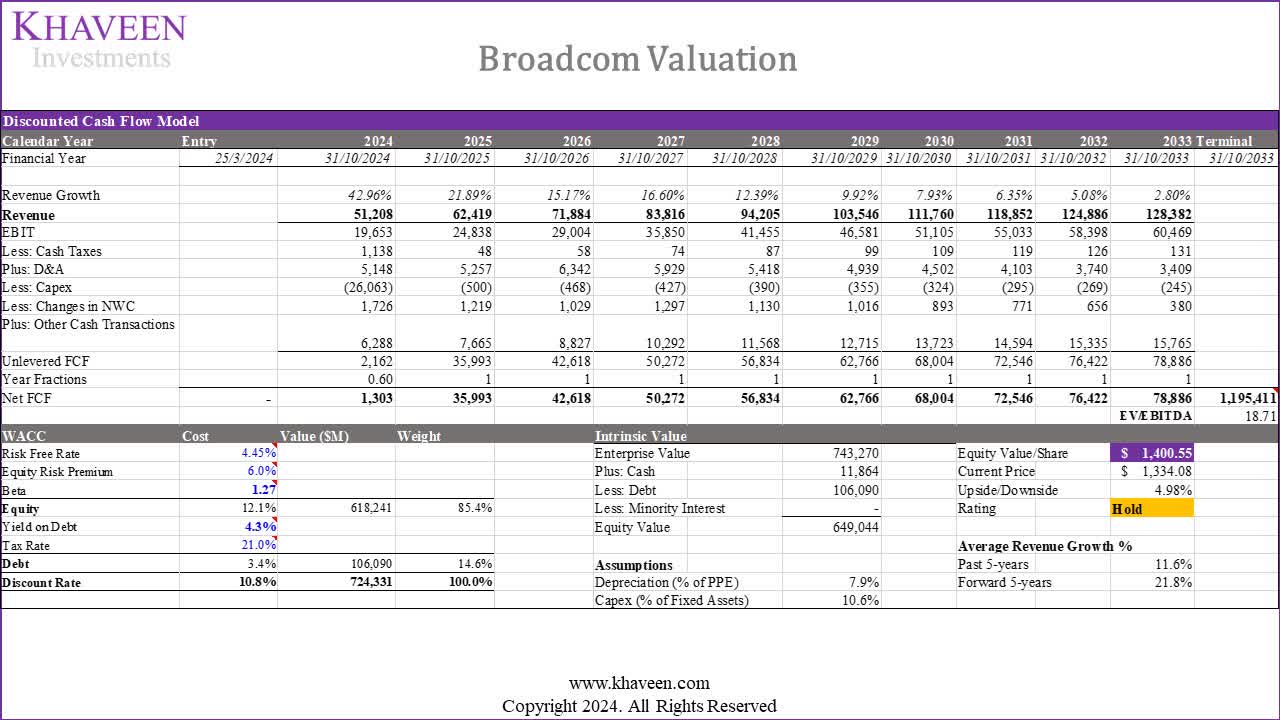
Khaveen Investments
We updated our DCF valuation of Broadcom, retaining similar assumptions from our previous analyses. However, we adjusted our assumptions to account for its stock-based compensation which we estimated at 12.3% of its revenue based on prorated Q1 figures. Based on a discount rate of 10.8% (company’s WACC) and terminal value based on the chipmakers’ average 5-year EV/EBITDA of 18.71x, we derived a limited upside of 4.98%. Furthermore, the company’s current EV/EBITDA is 34.24x, which is significantly higher compared to the chipmakers’ average 5-year EV/EBITDA of 18.71x which we attribute to the hype surrounding its AI developments. Therefore, we believe that its stock price increases are due to the market pricing in AI developments of the company, which we already accounted for in our projections as mentioned in the first point. As such, we believe this indicates the market may be irrationally pricing Broadcom due to investor sentiment rather than its financial or fundamentals.
Verdict
All in all, we believe that Broadcom’s stock outperformance in our past coverages was not due to differences in revenue or earnings growth. Despite exceeding our revenue expectations, which likely contributed to the stock outperforming our price targets in 2021 and 2022, particularly driven by underestimated Semiconductor segment growth, our forecasts for 2023 surpassed actual growth, management guidance, and analyst consensus. Our latest coverage for 2024 closely aligns with management guidance and analyst consensus, with management reaffirming its revenue forecasts for the year. Broadcom’s Q1 results were in line with our expectations, primarily fueled by strong Networking semiconductor growth. We maintain that our revenue forecast for the company remains appropriate, especially considering its robust growth outlook for its Semiconductor segment, driven by AI networking products. Furthermore, despite the company’s increasing share repurchases, its shares outstanding have remained relatively stable which has not benefitted EPS growth significantly.
We believe that the company’s stock price outperformance cannot solely be attributed to differences in earnings growth. Instead, positive investor sentiment, reflected in valuation ratios like P/S, P/FCF, and EV/EBITDA, has played a significant role. Factors contributing to this sentiment include increased share buybacks, AI developments, and industry optimism. However, our forecasts and valuation already accounted for Broadcom’s AI growth potential, especially in its Networking semicon segment. Overall, we believe our assessments are appropriate given these factors. Therefore, based on our valuation, we derived an updated price target of $1,400.55 compared to $1,177.26 previously mainly due to our revised projections accounting for its stock-based compensation at 12.3% of revenue. Despite that, we maintain a Hold rating on the company due to the limited upside of 5%.
Analyst’s Disclosure: I/we have a beneficial long position in the shares of AVGO either through stock ownership, options, or other derivatives. I wrote this article myself, and it expresses my own opinions. I am not receiving compensation for it (other than from Seeking Alpha). I have no business relationship with any company whose stock is mentioned in this article.
No information in this publication is intended as investment, tax, accounting, or legal advice, or as an offer/solicitation to sell or buy. Material provided in this publication is for educational purposes only, and was prepared from sources and data believed to be reliable, but we do not guarantee its accuracy or completeness.
Seeking Alpha’s Disclosure: Past performance is no guarantee of future results. No recommendation or advice is being given as to whether any investment is suitable for a particular investor. Any views or opinions expressed above may not reflect those of Seeking Alpha as a whole. Seeking Alpha is not a licensed securities dealer, broker or US investment adviser or investment bank. Our analysts are third party authors that include both professional investors and individual investors who may not be licensed or certified by any institute or regulatory body.